IndiaNivesh maintain 'buy' on this textile scrip with upgraded target after Q1FY16 results

IndiaNotes.com
IndiaNotes.comIndiaNotes.com

KPR Mills Q1FY16: IndiaNivesh maintain 'buy' with upgraded target #BrokerAdvice http://goo.gl/YS0d7t

 
  KPR Mills Ltd.
 
Q1FY16 Result/Concall Update  July 29, 2015


IndiaNivesh Research  IndiaNivesh Securities Private Limited|Research Analyst SEBI Registration No. INH000000511 
601 & 602, Sukh Sagar, N. S. Patkar Marg, Girgaum Chowpatty, Mumbai 400 007. Tel: (022) 66188800
  IndiaNivesh Research is also available on Bloomberg INNS, Thomson First Call, Reuters and Factiva INDNIV.
Financial  and  operating  leverage  to  continue;  Maintain  BUY  with 
revised TP of Rs 822 
KPR Mills Ltd (KML) reported consolidated results that outperformed our estimates 
on bottomline front. It would continue to focus on value added products and its 
vertically integrated facilities would enable better margins.  
Net Sales impacted by de‐growth in average realisation 
Net sales stood at Rs 6002 mn in Q1FY16 against Rs 5780 mn in Q1FY15 (vs. INSPL 
est:  Rs  6102  mn).  This  was  driven  by  textile  segment  which  grew  by  7%  yoy  to 
reach Rs 5046 mn in Q1FY16. Textile segment revenue was driven by garments and 
fabrics  which  grew  19%  yoy  and  22.9%  yoy  respectively.  Revenue  from  yarn 
declined 10% yoy due to lower cotton prices. While yarn volume increased by 6.5% 
yoy its average realisation declined 15.5% yoy inQ1FY16. Fabric realisation also de‐
grew by 16.5% yoy in Q1FY16 while fabric volume growth stood at 47.2% yoy in 
Q1FY16.  Garment  realisation  increased  2.4%  yoy  and  volume  growth  stood  at 
16.5%  yoy,  resulting  in  garment  sales  growth  of  19.3%.  Sugar  segment  declined 
19.8% yoy to reach Rs 650 mn. 
 
Particulars  Q1FY16 Q4FY15 Q1FY15 QoQ(%) YoY(%)
Qty
Yarn (tons) 10631 14775 9982 ‐28.0 6.5
Fabric (tons) 6850 6953 4653 ‐1.5 47.2
Garment (Mn Pcs) 10.6 10.9 9.1 ‐2.8 16.5
Value (Rs Mn)
Yarn 2060 2690 2290 ‐23.4 ‐10.0
Fabric 1340 1290 1090 3.9 22.9
Garments 1360 1270 1140 7.1 19.3
Sugar 650 566 810 14.8 ‐19.8
Others 590 723.75 450 ‐18.5 31.1
Total 6000 6539.75 5780 ‐8.3 3.8
Avg Realisation
Yarn (Rs/kg) 193.8 182.1 229.4 6.4 ‐15.5
Fabric (Rs/kg) 195.6 185.5 234.3 5.4 ‐16.5
Garment (Rs/pc) 128.3 116.5 125.3 10.1 2.4
Revenue Mix (%)
Yarn 34.3 41.1 39.6
Fabric 22.3 19.7 18.9
Garments 22.7 19.4 19.7
Sugar 10.8 8.7 14.0
Others 9.8 11.1 7.8
Total 100.0 100.0 100.0  
Source: Company, IndiaNivesh Research 
Daljeet S. Kohli 
Head of Research 
Tel: +91 22 66188826 
daljeet.kohli@indianivesh.in 
 
Prerna Jhunjhunwala 
Research Analyst 
Tel: +91 22 66188848 
prerna.jhunjhunwala@indianivesh.in 
Current  Previous 
CMP : Rs. 686   
Rating : BUY  Rating : HOLD 
Target : Rs.822  Target : Rs.750 
 
STOCK INFO 
BSE  532889 
NSE  KPRMILL 
Index   S&P BSE SMALL CAP 
Bloomberg  KPR IN 
Reuters  KPRM.BO 
Sector  Textiles 
Face Value (Rs)  10 
Equity Capital (Rs mn)   377 
Mkt Cap (Rs mn)  25,848 
52w H/L (Rs) (Adj.)  694/225 
3m Avg Daily Volume (BSE + NSE)  39597 
 
SHAREHOLDING PATTERN  % 
(as on Jun. 2015) 
Promoters  75.0 
FIIs  2.7 
DIIs  10.5 
Public & Others  11.8 
Source: BSE 
 
STOCK PER. (%)  1m  3m  12m 
KPR MILLS   14  21  182 
SENSEX   ‐1  0  6 
Source: Capitaline, IndiaNivesh Research 
 
KPR MILLS v/s SENSEX 
 
Source: Capitaline, IndiaNivesh Research 


20
70
120
170
220
270
320
Jul/2014
Aug/2014
Sep/2014
Oct/2014
Nov/2014
Dec/2014
Jan/2015
Feb/2015
Mar/2015
Apr/2015
May/2015
Jun/2015
Jul/2015
KPR Mills Sensex
Q1FY16 Result/Concall Update (contd...) 


KPR Mills Ltd. (contd...)    July 29, 2015 | 2 
 
 EBITDA stood at Rs 993 mn in Q1FY16 against Rs 934 mn in Q1FY15, growth of 6.2% yoy. 
EBITDA margin improved to 16.5% in Q1FY16 from 16.2% in Q1FY15, an improvement of 
37 bps yoy. EBITDA was positively impacted by lower raw material cost (62.5% of net 
sales in Q1FY16 vs 67.3% of net sales in Q1FY15) while it was offset by higher other 
expenses (12.5% vs 8.9%) and employee cost (8.4% vs. 7.6%).  
 PAT grew 28.1% yoy to reach Rs 505 mn in Q1FY16 from Rs 394 mn in Q1FY15 (INSPL 
est:  Rs  448  mn).  This  growth  in  PAT  is  on  account  of  higher  other  operating  income 
(48.1% yoy) and reduction in depreciation cost (‐6% yoy) and interest cost (17.3% yoy). 
Adjusting for other income and other operating income, adjusted PAT stood at Rs 212 
mn in Q1FY16 from Rs 173 mn in Q1FY15, signifying growth of 22% yoy. This illustrates 
the impact of lower interest and depreciation cost on the performance of the company.  
We attended the conference call of the company and following are the key takeaways: 
 Management focus would continue on garments business. The revenue mix would tilt 
towards garments with increasing garment capacities and higher captive consumption. 
 Exports of the company stood at Rs 2040 mn.  
 The share of compact yarn is likely to increase from 50% to 75% by end of FY16E. This 
would enable better profitability. Average realisation of compact yarn is generally better 
than basic yarn by Rs 5 per kg.  
 Increase  in  power  cost  was  the  primary  reason  for  increase  in  other  expenses.  The 
company incurred additional power cost of Rs 170 mn due to lower generation from 
wind power. Consequently, it had to purchase electricity from the grid. However, this is 
not a recurring phenomenon. Total power expenditure in Q1FY16 stood at Rs 470 mn.  
 Total capex for FY16E is likely to be Rs 2250 mn of which Rs 1750 mn would be for the 
new garment facility and Rs 500 mn would be for modernisation and maintenance.  
 Total debt at the end of the quarter stood at Rs 6120 mn of which term loan was Rs 
3780  mn  and  working  capital  loan  was  Rs  2330  mn  (reduced  from  Rs  4330  mn  in 
Q4FY15). The company would repay term loan of Rs 900 mn. It would take additional Rs 
1000  mn  for  the  Greenfield  garment  facility  under  Technological  Upgradation  Funds 
Scheme (TUFS). Cash flows generated through existing capacities would be utilised for 
working capital. The management stated that the debt level of the company is likely to 
remain at current levels in FY16E.  
 The  company  has  more  than  40  clients  of  which  2  are  from  the  US.  Top  20  clients 
contribute 70% to revenue.  
 The company reduced inventory by Rs 1170 mn. The cost of cotton stood at Rs 100 per 
kg. The management stated that the cotton prices are likely to stabilise at current levels.  
 The management stated that as a rule of thumb, for Rs 1000 mn revenue in garments, it 
would require 1000 people which would manufacture 8mn pcs, 500 sewing machines, 
capex of Rs 400‐500 mn and working capital of 20% of sales.  
 EBITDA margin in yarn is 18% while that in garments is 24%.   
 Management  guided  for  operating  margin  of  22%‐24%  (including  other  operating 
income) going forward. Operating margin (including other operating income) stood at 
20.4% in Q1FY16. It also guided that the company may become debt‐free eventually due 
to focus on low capital intensive garments business.  
 
Revision in estimates 
We maintain our revenue and EBITDA estimates, given the unpredictable nature of cotton 
prices. However, we have lowered debt assumption taking into consideration the company 
guidance to maintain it at current levels. Consequently, our net profit estimates are revised 
upwards by 2.7% /1% for FY16E / FY17E respectively.  
Q1FY16 Result/Concall Update (contd...) 


KPR Mills Ltd. (contd...)    July 29, 2015 | 3 
 
New Earlier % Chg New Earlier % Chg
Sales 28422 28422 0.0 33379 33379 0.0
EBITDA 4491 4491 0.0 5646 5646 0.0
PAT 2395 2332 2.7 3315 3282 1.0
EPS 63.6 61.9 2.7 88.0 87.1 1.0
EBITDA Margin (%) 15.8 15.8 3 bps 16.9 16.2 77 bps
PAT Margin (%) 8.4 8.2 19 bps 9.9 9.3 60 bps
FY16E FY17E
Particulars (Rs Mn)
 
Source: Company, IndiaNivesh Research 
Valuation 
At CMP of Rs 686, the stock trades at PE of 10.9x and 7.8x its FY16E and FY17E earnings of Rs 
63.2 and Rs 88 per share respectively. We are positive on the strong business model of the 
company due to its vertically integrated capacities, focus on value added products, captive 
green  power  capacity  and  leadership  position  in  knitwear  segment  of  the  industry.  Its 
proximity  to  clients  in  Tirupur  provides  location  advantages.  Reducing  debt  and  expected 
improvement in margin is likely to improve its ROE to 26.4% in FY17E from 19.7% in FY15. 
We maintain BUY rating on the stock with revised SOTP based target price of Rs 822. We 
have revised EV/EBITDA multiple of textile segment to 6.2x from 5.7x earlier due to expected 
improvement  in  margins  and  its  better  financial  performance  than  peers  like  Vardhaman 
Textiles,  Arvind  and  Raymond.  The  key  risk  to  our  estimates  would  be  steep  volatility  in 
cotton prices.  
SOTP based target price 
Segment EBITDA (FY17E) Multiple Rs  Mn
Textiles 5,990 6.2 36921
Sugar 320 6 1918
EV 38839
Debt (FY15) 8169
Cash (FY15) 286
Market Cap 30956
Target Price (Rs Per Share) 822  
Source: IndiaNivesh Research 
Textile Peers 
Company CMP Sales Sales CAGR  EPS CAGR  EBITDA Margin PAT Margin ROE (%) P/E EV/EBITDA
(FY17E) (FY14‐FY17E) (%) (FY14‐FY17E) (%) FY17E (%) FY17E (%) FY17E (%) FY17E (x) FY17E (x)
Arvind 291 103074 14.8 27.8 13.7 5.5 16.8 13.5 7.7
Raymond 467 66480 11.7 38.0 9.7 3.4 11.4 13.3 6.8
Vardhman 758 78291 7.4 31.9 19.2 8.3 16.0 7.4 4.4
Average ‐ 82615 11.3 32.6 14.2 5.7 14.7 11.4 6.3
KPR 686 33379 15.8 38.2 16.9 9.9 26.4 7.8 4.9 
Source: Company, Bloomberg, IndiaNivesh Research 
   
Q1FY16 Result/Concall Update (contd...) 


KPR Mills Ltd. (contd...)    July 29, 2015 | 4 
 
Financial Performance 
Rs in mn Q1FY16 Q4FY15 Q1FY15 QoQ (%) YoY (%)
Net sales 6,002 6,553 5,780 ‐8.4 3.8
Raw Materials 3,753 4,375 3,891 ‐14.2 ‐3.5
Staff cost 507 468 437 8.3 15.9
Other expenditure 750 860 517 ‐12.8 44.9
Operating Expenses 5,009 5,702 4,845 ‐12.1 3.4
EBITDA 993 851 934 16.7 6.2
EBITDA Margin (%) 16.5% 13.0% 16.2% 356 bps 37 bps
Other Operating Income 231 215 156 7.5 48.1
Other Income 63 63 65 ‐0.9 ‐3.4
Depreciation 376 369 400 1.8 ‐6.0
Profit bef. Int. & Tax 910 759 755 19.9 20.5
Interest & finance ch. 181 213 218 ‐15.3 ‐17.3
Profit before tax 730 546 537 33.6 35.9
Total tax expenses 225 45 143 398.0 57.4
Add/Less: Extraordinary Items 0 0 0
Net profit 505 501 394 0.8 28.1
PAT 505 501 394 0.8 28.1
Effective tax rate 30.8% 8.3% 26.6%
Adj. PAT Margins (%) 8.4% 7.6% 6.8% 76 bps 160 bps
EPS 13.4 13.3 10.5 0.8 28.1  
Source: Company, IndiaNivesh Research 
Segmental Performance 
Rs in mn Q1FY16 Q4FY15 Q1FY15 QoQ (%) YoY (%)
Revenue (Rs Mn)
Textile 5046 5532 4716 ‐8.8 7.0
Sugar 701 768 856 ‐8.8 ‐18.1
Others 308 252 253 22.2 21.8
Total 6055 6553 5824 ‐7.6 4.0
EBIT (Rs Mn)
Textile 834 675 630 23.6 32.5
Sugar 5 5 47 ‐13.2 ‐90.1
Others 9 16 14 ‐43.1 ‐35.0
Total 848 696 690 21.8 22.8
EBIT Margin (%)
Textile 16.5 12.2 13.3 432 bps 317 bps
Sugar 0.7 0.7 5.5 (3 bps) (480 bps)
Others 3.0 6.4 5.5 (340 bps) (258 bps)  
Source: Company, IndiaNivesh Research 
Q1FY16 Result/Concall Update (contd...) 


KPR Mills Ltd. (contd...)    July 29, 2015 | 5 
 
Consolidated Financial Statements 


Income statement
Y E March (Rs m) FY 13 FY 14 FY 15P FY 16E FY 17E
Net sales 16259 23105 24885 28422 33379
Growth % 35.1 42.1 7.7 14.2 17.4
Expenditure 12774 19488 21285 23931 27732
Raw Material 9938 15867 16740 18729 21541
Power and Fuel 646 713 1070 1279 1502
Employee 1167 1510 1827 2217 2770
Others 1024 1398 1648 1705 1919
EBITDA 3486 3617 3600 4491 5646
Growth % 195.2 3.8 ‐0.5 24.8 25.7
EBITDA Margin % 21.4 15.7 14.5 15.8 16.9
Other Income 445 915 1,013 1,141 1,243
Depreciation and amortisation 1509 1567 1540 1595 1664
EBIT 2421 2966 3073 4038 5226
EBIT Margin % 14.9 12.8 12.3 14.2 15.7
Interest 980 1045 839 637 490
Exceptional/Extraordinary item 0 0 0 0 0
PBT 1441 1921 2234 3401 4735
PBT Margin % 8.9 8.3 9.0 12.0 14.2
Tax 411 504 498 1020 1421
Effective tax rate % 29 26 22 30 30
PAT 1030 1417 1736 2381 3315
Adj. PAT 1030 1417 1736 2381 3315
Growth% 214.2 37.5 22.5 37.2 39.2
Adj. PAT Margin % 6.3 6.1 7.0 8.4 9.9
Balance sheet
Y E March (Rs m) FY 13 FY 14 FY 15P FY 16E FY 17E
Equity Share Capital 377 377 377 377 377
Preference Capital and others 150 150 150 150 150
Reserves & Surplus 6536 7619 8925 10649 13421
Net Worth 7063 8145 9452 11176 13947
Total debt 10082 9620 8169 6370 4904
Net defered tax liability 624 601 600 600 600
Total Liabilities 17768 18366 18222 18146 19452
Gross Fixed Assets 19508 20190 21208 22740 23340
Less Depreciation 6123 7638 9178 10852 12516
Capital Work in Progress 0 60 50 55 61
Net Fixed Assets 13385 12611 12080 11942 10884
Goodwill on Consolidation 7 7 7 7 7
Investments 665 627 615 615 615
Current Assets 6844 8399 9497 9842 13239
Inventories 3576 4053 5164 5400 7176
Sundry Debtors 1611 2380 2818 3126 3839
Cash & Bank Balance 761 992 286 36 774
Loans & advances 704 508 823 853 1001
Other Current assets 193 467 407 427 449
Current Liabilities & provisions 3132 3278 3978 4260 5293
Net Current Assets 3712 5121 5520 5582 7946
Mis Exp not written off 0 0 0 0 0
Total assets 17768 18366 18222 18146 19452
Cash Flow
Y E March (Rs m) FY 13 FY 14 FY 15P FY 16E FY 17E
PBT 1441 1921 2234 3401 4735
Adjustment for:
     Depreciation 1509 1567 1540 1595 1664
     Others 926 995 738 531 379
Changes in working capital ‐1476 450 ‐1721 ‐595 ‐1862
Tax expenses ‐255 ‐412 ‐498 ‐1020 ‐1421
Cash flow from operations 2145 4520 2294 3911 3495
Capital expenditure ‐2535 ‐2240 ‐990 ‐1555 ‐606
Free Cash Flow ‐389 2281 1304 2356 2890
Others 36 100 97 102 107
Cash flow from investments ‐2499 ‐2140 ‐893 ‐1453 ‐499
Interest  ‐883 ‐1101 ‐672 ‐510 ‐392
Loans availed or (repaid) 2063 ‐462 ‐1451 ‐1799 ‐1466
Proceeds from Issue of shares (incl share 
premium) 0 0 0 0 0
Dividend paid (incl tax) ‐363 ‐321 ‐399 ‐399 ‐399
Cash flow from Financing 817 ‐1883 ‐2521 ‐2708 ‐2257
Net change in cash 463 497 ‐1121 ‐250 739
Cash at the beginning of the year 446 910 1406 286 36
Cash at the end of the year 910 1406 286 36 774
Reconciliation with other balances ‐149 ‐415 0 0 0
Cash as per Balance Sheet 761 992 286 36 774
Key ratios
Y E March FY 13 FY 14 FY 15P FY 16E FY 17E
Adj. EPS (Rs) 27.3 37.6 46.1 63.2 88.0
Cash EPS (Rs) 67.4 79.2 86.9 105.5 145.3
BVPS 187.4 216.2 250.9 296.6 407.2
DPS (Rs) 6.0 7.0 9.0 9.0 9.0
Adj. P/E (x) 25.1 18.2 14.9 10.9 7.8
P/CEPS (x) 10.2 8.7 7.9 6.5 4.7
P/BV (x) 3.7 3.2 2.7 2.3 1.7
EV/EBITDA(x) 10.1 9.5 9.4 7.2 4.9
M cap/sales (x) 1.6 1.1 1.0 0.9 0.7
ROCE 15.4 17.0 17.4 23.0 28.7
ROE 15.5 18.6 19.7 23.1 26.4
Inventory (days) 61.1 60.3 67.6 67.8 68.8
Debtors (days) 33.7 31.5 38.1 38.2 38.1
Trade Payables (days) 17.0 31.1 41.1 36.3 35.6
Total Asset Turnover (x) 0.9 1.1 1.1 1.3 1.4
Fixed Asset Turnover (x) 1.3 1.8 2.0 2.4 2.9
Debt/equity (x) 1.4 1.2 0.9 0.6 0.4
Debt/ebitda (x) 2.9 2.7 2.3 1.4 0.9
Interest Coverage (x) 2.5 2.8 3.7 6.3 10.7
Dividend Yield % 0.9 1.0 1.3 1.3 1.3
Q1FY16 Result/Concall Update (contd...) 


KPR Mills Ltd. (contd...)    July 29, 2015 | 6 
 
Disclaimer: This document has been prepared by IndiaNivesh Securities Private Limited (“INSPL”), for use by the recipient as information only and is not for circulation or public distribution. INSPL 
includes subsidiaries, group and associate companies, promoters, employees and affiliates. INSPL researches, aggregates and faithfully reproduces information available in public domain and other 
sources, considered to be reliable and makes them available for the recipient, though its accuracy or completeness has not been verified by INSPL independently and cannot be guaranteed. The third 
party research material included in this document does not represent the views of INSPL and/or its officers, employees and the recipient must exercise independent judgement with regard to such 
content. This document has been published in accordance with the provisions of Regulation 18 of the Securities and Exchange Board of India (Research Analysts) Regulations, 2014. This document is 
not to be altered, transmitted, reproduced, copied, redistributed, uploaded or published or made available to others, in any form, in whole or in part, for any purpose without prior written permission 
from INSPL. This document is solely for information purpose and should not to be construed as an offer to sell or the solicitation of an offer to buy any security. Recipients of this document should be 
aware that past performance is not necessarily a guide for future performance and price and value of investments can go up or down. The suitability or otherwise of any investments will depend upon 
the recipients particular circumstances. INSPL does not take responsibility thereof. The research analysts of INSPL have adhered to the code of conduct under Regulation 24 (2) of the Securities and 
Exchange Board of India (Research Analysts) Regulations, 2014. This document is based on technical and derivative analysis center on studying charts of a stock’s price movement, outstanding positions 
and trading volume, as opposed to focusing on a company’s fundamentals and, as such, may not match with a report on a company’s fundamentals. Nothing in this document constitutes investment, 
legal, accounting and/or tax advice or a representation that any investment or strategy is suitable or appropriate to recipients’ specific circumstances. INSPL does not accept any responsibility or 
whatever nature for the information, assurances, statements and opinion given, made available or expressed herein or for any omission or for any liability arising from the use of this document. 
Opinions expressed are our current opinions as of the date appearing on this document only. The opinions are subject to change without any notice. INSPL directors/employees and its clients may have 
holdings in the stocks mentioned in the document. 
This report is based / focused on fundamentals of the Company and forward‐looking statements as such, may not match with a report on a company’s technical analysis report  
Each of the analysts named below hereby certifies that, with respect to each subject company and its securities for which the analyst is responsible in this report, (1) all of the views expressed in this 
report accurately reflect his or her personal views about the subject companies and securities, and (2) no part of his or her compensation was, is, or will be, directly or indirectly, related to the specific 
recommendations or views expressed in this report: Daljeet S Kohli, Amar Maurya, Abhishek Jain, Yogesh Hotwani, Prerna Jhunjhunwala, Kaushal Patel, Rahul Koli, Tushar Manudhane, Aman Vij, 
Abhitesh Agarwal, Harshraj Aggarwal & Dharmesh Kant. 
Following table contains the disclosure of interest in order to adhere to utmost transparency in the matter: 
Disclosure of Interest Statement 
1  Details  of  business  activity  of  IndiaNivesh  Securities  Private  Limited 
(INSPL)  
INSPL is a Stock Broker registered with BSE, NSE and MCX ‐ SX in all the major segments viz. Cash, F & O and CDS 
segments. INSPL is also a Depository Participant and registered with both Depository viz. CDSL and NSDL. Further, 
INSPL is a Registered Portfolio Manager and is registered with SEBI. 
2  Details of Disciplinary History of INSPL  No disciplinary action is / was running / initiated against INSPL 
3  Details of Associates of INSPL  Please refer to the important 'Stock Holding Disclosure' report on the IndiaNivesh website (investment Research 
Section  ‐http://www.indianivesh.in/Research/Holding_Disclosure.aspx?id=10  link).  Also,  please  refer  to  the  latest 
update on respective stocks for the disclosure status in respect of those stocks. INSPL and its affiliates may have 
investment positions in the stocks recommended in this report. 
4  Research analyst or INSPL or its relatives'/associates' financial interest 
in the subject company and nature of such financial interest 
No (except to the extent of shares held by Research analyst or INSPL or its relatives'/associates') 
5  Research analyst or INSPL or its relatives'/associates' actual/beneficial 
ownership of 1% or more in securities of the subject company, at the 
end  of  the  month  immediately  preceding  the  date  of  publication  of 
the document. 
Please refer to the important 'Stock Holding Disclosure' report on the IndiaNivesh website  (investment Research 
Section ‐ http://www.indianivesh.in/Research/Holding_Disclosure.aspx?id=10 link). Also, please refer to the latest 
update on respective stocks for the disclosure status in respect of those stocks. INSPL and its affiliates may have 
investment positions in the stocks recommended in this report. 
6  Research  analyst  or  INSPL  or  its  relatives'/associates'  any  other 
material conflict of interest at the time of publication of the document  
No 
7  Has  research  analyst  or  INSPL  or  its  associates  received  any 
compensation from the subject company in the past 12 months 
No 
8  Has  research  analyst  or  INSPL  or  its  associates  managed  or  co‐
managed public offering of securities for the subject company in the 
past 12 months 
No 
9  Has  research  analyst  or  INSPL  or  its  associates  received  any 
compensation  for  investment  banking  or  merchant  banking  or 
brokerage services from the subject company in the past 12 months 
No 
10  Has  research  analyst  or  INSPL  or  its  associates  received  any 
compensation for products or services other than investment banking 
or merchant banking or brokerage services from the subject company 
in the past 12 months 
No 
11  Has  research  analyst  or  INSPL  or  its  associates  received  any 
compensation  or  other  benefits  from  the  subject  company  or  third 
party in connection with the document. 
No 
12  Has research analyst served as an officer, director or employee of the 
subject company 
No 
13  Has research analyst or INSPL engaged in market making activity for 
the subject company 
No 
14  Other disclosures  No 
 
INSPL, its affiliates, directors, its proprietary trading and investment businesses may, from time to time, make investment decisions that are inconsistent with or contradictory to the recommendations 
expressed herein. The views contained in this document are those of the analyst, and the company may or may not subscribe to all the views expressed within. This information is subject to change, as 
per applicable law, without any prior notice. INSPL reserves the right to make modifications and alternations to this statement, as may be required, from time to time. 
Definitions of ratings  
BUY. We expect this stock to deliver more than 15% returns over the next 12 months.  
HOLD. We expect this stock to deliver ‐15% to +15% returns over the next 12 months.  
SELL. We expect this stock to deliver <‐15% returns over the next 12 months.  
Our target prices are on a 12‐month horizon basis.  
Other definitions  
NR = Not Rated. The investment rating and target price, if any, have been arrived at due to certain circumstances not in control of INSPL 
CS = Coverage Suspended. INSPL has suspended coverage of this company. 
UR=Under Review. Such e invest review happens when any developments have already occurred or likely to occur in target company & INSPL analyst is waiting for some more information to draw 
conclusion on rating/target.  
NA = Not Available or Not Applicable. The information is not available for display or is not applicable.  
NM = Not Meaningful. The information is not meaningful and is therefore excluded. 
Research Analyst has not served as an officer, director or employee of Subject Company 
One year Price history of the daily closing price of the securities covered in this note is available at www.nseindia.com and www.economictimes.indiatimes.com/markets/stocks/stock‐quotes. (Choose 
name of company in the list browse companies and select 1 year in icon YTD in the price chart) 


IndiaNivesh Securities Private Limited 
Research Analyst SEBI Registration No. INH000000511 
601 & 602, Sukh Sagar, N. S. Patkar Marg, Girgaum Chowpatty, Mumbai 400 007. 
Tel: (022) 66188800 / Fax: (022) 66188899 
e‐mail: research@indianivesh.in  |  Website: www.indianivesh.in 
 

Recommandé

Arvnd 20150205-mosl-ru-pg014 par
Arvnd 20150205-mosl-ru-pg014Arvnd 20150205-mosl-ru-pg014
Arvnd 20150205-mosl-ru-pg014Jigar Savla
216 vues14 diapositives
Dony 1020311 par
Dony   1020311Dony   1020311
Dony 1020311donyjo
169 vues14 diapositives
Buy Bata India for a target of Rs1180 by Motilal Oswal par
Buy Bata India for a target of Rs1180 by Motilal OswalBuy Bata India for a target of Rs1180 by Motilal Oswal
Buy Bata India for a target of Rs1180 by Motilal OswalIndiaNotes.com
405 vues8 diapositives
MindTree: Rupee appreciation drags revenue growth during Q1FY15 par
MindTree: Rupee appreciation drags revenue growth during Q1FY15MindTree: Rupee appreciation drags revenue growth during Q1FY15
MindTree: Rupee appreciation drags revenue growth during Q1FY15IndiaNotes.com
125 vues4 diapositives
India Office Property Market Overview April 2015 par
India Office Property Market Overview April 2015India Office Property Market Overview April 2015
India Office Property Market Overview April 2015Sachin Sharma
346 vues20 diapositives
Return plus january 2015 par
Return plus january 2015Return plus january 2015
Return plus january 2015Arpita0306
268 vues10 diapositives

Contenu connexe

Tendances

Stocks par
StocksStocks
StocksCapital Stars
123 vues4 diapositives
Buy Multibase India, globalisation of the auto component sector to benefit th... par
Buy Multibase India, globalisation of the auto component sector to benefit th...Buy Multibase India, globalisation of the auto component sector to benefit th...
Buy Multibase India, globalisation of the auto component sector to benefit th...IndiaNotes.com
447 vues9 diapositives
Prak avenue raymond porter's five model 4ps par
Prak avenue raymond porter's five model 4psPrak avenue raymond porter's five model 4ps
Prak avenue raymond porter's five model 4psKshitijPathak15
245 vues15 diapositives
Se quent press release q3fy20 par
Se quent press release q3fy20Se quent press release q3fy20
Se quent press release q3fy20Ravi Babu Adusumilli
24 vues22 diapositives
Epic research monte carlo ipo par
Epic research  monte carlo ipoEpic research  monte carlo ipo
Epic research monte carlo ipoEpic Research Limited
303 vues9 diapositives
Reliance q12011 par
Reliance q12011Reliance q12011
Reliance q12011atul baride
869 vues14 diapositives

Tendances(20)

Buy Multibase India, globalisation of the auto component sector to benefit th... par IndiaNotes.com
Buy Multibase India, globalisation of the auto component sector to benefit th...Buy Multibase India, globalisation of the auto component sector to benefit th...
Buy Multibase India, globalisation of the auto component sector to benefit th...
IndiaNotes.com447 vues
Prak avenue raymond porter's five model 4ps par KshitijPathak15
Prak avenue raymond porter's five model 4psPrak avenue raymond porter's five model 4ps
Prak avenue raymond porter's five model 4ps
KshitijPathak15245 vues
Final project report on - Raymonds - Park Avenue Deo par Sabyasachi Das
Final project report on - Raymonds - Park Avenue DeoFinal project report on - Raymonds - Park Avenue Deo
Final project report on - Raymonds - Park Avenue Deo
Sabyasachi Das105 vues
Orbit Exports Q4FY15: Growth story to continue in coming quarters also par IndiaNotes.com
Orbit Exports Q4FY15: Growth story to continue in coming quarters alsoOrbit Exports Q4FY15: Growth story to continue in coming quarters also
Orbit Exports Q4FY15: Growth story to continue in coming quarters also
IndiaNotes.com254 vues
Firstcall recommend this pharma scrip after Q4FY15 revenue rise 18.10% y/y par IndiaNotes.com
Firstcall recommend this pharma scrip after Q4FY15 revenue rise 18.10% y/yFirstcall recommend this pharma scrip after Q4FY15 revenue rise 18.10% y/y
Firstcall recommend this pharma scrip after Q4FY15 revenue rise 18.10% y/y
IndiaNotes.com334 vues
MC Oppday 60Q1 21/5/2017 par Share Rora
MC Oppday 60Q1 21/5/2017MC Oppday 60Q1 21/5/2017
MC Oppday 60Q1 21/5/2017
Share Rora123 vues
Q408 release 02/03/09 par finance26
Q408 release 02/03/09Q408 release 02/03/09
Q408 release 02/03/09
finance26247 vues
Textile mills in india - Reports Corner par Reports Corner
Textile mills in india - Reports CornerTextile mills in india - Reports Corner
Textile mills in india - Reports Corner
Reports Corner487 vues
FINANCIAL PERFORMANCE ANALYSIS OF ITC, BRITANNIA, CADBURY IN FMCG- FOOD SECTOR par Ankita Kamble
FINANCIAL PERFORMANCE ANALYSIS OF ITC, BRITANNIA, CADBURY IN FMCG-FOOD SECTORFINANCIAL PERFORMANCE ANALYSIS OF ITC, BRITANNIA, CADBURY IN FMCG-FOOD SECTOR
FINANCIAL PERFORMANCE ANALYSIS OF ITC, BRITANNIA, CADBURY IN FMCG- FOOD SECTOR
Ankita Kamble1.3K vues

Similaire à IndiaNivesh maintain 'buy' on this textile scrip with upgraded target after Q1FY16 results

Stock Advisory for Today - Natural View on the Stock JSW Steel LTD, Marico a... par
Stock Advisory for Today -  Natural View on the Stock JSW Steel LTD, Marico a...Stock Advisory for Today -  Natural View on the Stock JSW Steel LTD, Marico a...
Stock Advisory for Today - Natural View on the Stock JSW Steel LTD, Marico a...NARNOLIA SECURITIES LIMITED
431 vues25 diapositives
AxisBank‬ Ltd.Q2 FY16 Result Analysis par
AxisBank‬ Ltd.Q2 FY16 Result AnalysisAxisBank‬ Ltd.Q2 FY16 Result Analysis
AxisBank‬ Ltd.Q2 FY16 Result Analysischoice broking
42 vues9 diapositives
Financial Advisory Stock for Today- Buy Stocks of Infosys with Target Price R... par
Financial Advisory Stock for Today- Buy Stocks of Infosys with Target Price R...Financial Advisory Stock for Today- Buy Stocks of Infosys with Target Price R...
Financial Advisory Stock for Today- Buy Stocks of Infosys with Target Price R...NARNOLIA SECURITIES LIMITED
718 vues26 diapositives
BSNL PDF .pdf par
BSNL PDF .pdfBSNL PDF .pdf
BSNL PDF .pdfShubhamNimje8
116 vues59 diapositives
Itc ltd (update) new par
Itc ltd (update)   newItc ltd (update)   new
Itc ltd (update) newAnkurShah108
20 vues6 diapositives
Stock of the week hexaware tech. par
Stock of the week   hexaware tech.Stock of the week   hexaware tech.
Stock of the week hexaware tech.stockquint
294 vues14 diapositives

Similaire à IndiaNivesh maintain 'buy' on this textile scrip with upgraded target after Q1FY16 results(20)

AxisBank‬ Ltd.Q2 FY16 Result Analysis par choice broking
AxisBank‬ Ltd.Q2 FY16 Result AnalysisAxisBank‬ Ltd.Q2 FY16 Result Analysis
AxisBank‬ Ltd.Q2 FY16 Result Analysis
choice broking42 vues
Stock of the week hexaware tech. par stockquint
Stock of the week   hexaware tech.Stock of the week   hexaware tech.
Stock of the week hexaware tech.
stockquint294 vues
Equity Research Report on FMCG sector par Nirransh Jain
Equity Research Report on FMCG sectorEquity Research Report on FMCG sector
Equity Research Report on FMCG sector
Nirransh Jain78 vues
Equity Research Report on FMCG sector par Nirransh Jain
Equity Research Report on FMCG sectorEquity Research Report on FMCG sector
Equity Research Report on FMCG sector
Nirransh Jain49 vues
The Quarter One Update for GHCL par KritiSahani
The Quarter One Update for GHCLThe Quarter One Update for GHCL
The Quarter One Update for GHCL
KritiSahani51 vues
ALDAR_August 2016-Investement Update par Majd Dola
ALDAR_August 2016-Investement UpdateALDAR_August 2016-Investement Update
ALDAR_August 2016-Investement Update
Majd Dola327 vues
Q3FY15: Buy Jain Irrigation for 51% upside par IndiaNotes.com
Q3FY15: Buy Jain Irrigation for 51% upsideQ3FY15: Buy Jain Irrigation for 51% upside
Q3FY15: Buy Jain Irrigation for 51% upside
IndiaNotes.com454 vues

Plus de IndiaNotes.com

Fce glaxo smithkline_12aug15 par
Fce glaxo smithkline_12aug15Fce glaxo smithkline_12aug15
Fce glaxo smithkline_12aug15IndiaNotes.com
837 vues11 diapositives
GSK Consumer: Horlicks strengthens its position as No.1 brand across India par
GSK Consumer: Horlicks strengthens its position as No.1 brand across IndiaGSK Consumer: Horlicks strengthens its position as No.1 brand across India
GSK Consumer: Horlicks strengthens its position as No.1 brand across IndiaIndiaNotes.com
733 vues11 diapositives
GSK Consumer: Horlicks strengthens its position as No.1 brand across India par
GSK Consumer: Horlicks strengthens its position as No.1 brand across IndiaGSK Consumer: Horlicks strengthens its position as No.1 brand across India
GSK Consumer: Horlicks strengthens its position as No.1 brand across IndiaIndiaNotes.com
821 vues11 diapositives
Hester Biosciences gets manufacturing licence for 2 additional poultry vaccines par
Hester Biosciences gets manufacturing licence for 2 additional poultry vaccinesHester Biosciences gets manufacturing licence for 2 additional poultry vaccines
Hester Biosciences gets manufacturing licence for 2 additional poultry vaccinesIndiaNotes.com
571 vues11 diapositives
Vidhi Dyestuffs: To keep its growth story in the coming quarters also par
Vidhi Dyestuffs: To keep its growth story in the coming quarters alsoVidhi Dyestuffs: To keep its growth story in the coming quarters also
Vidhi Dyestuffs: To keep its growth story in the coming quarters alsoIndiaNotes.com
643 vues9 diapositives
Apollo Tyres approves further expansion of the Truck & Bus radial tyre capacity par
Apollo Tyres approves further expansion of the Truck & Bus radial tyre capacityApollo Tyres approves further expansion of the Truck & Bus radial tyre capacity
Apollo Tyres approves further expansion of the Truck & Bus radial tyre capacityIndiaNotes.com
1.3K vues11 diapositives

Plus de IndiaNotes.com(20)

GSK Consumer: Horlicks strengthens its position as No.1 brand across India par IndiaNotes.com
GSK Consumer: Horlicks strengthens its position as No.1 brand across IndiaGSK Consumer: Horlicks strengthens its position as No.1 brand across India
GSK Consumer: Horlicks strengthens its position as No.1 brand across India
IndiaNotes.com733 vues
GSK Consumer: Horlicks strengthens its position as No.1 brand across India par IndiaNotes.com
GSK Consumer: Horlicks strengthens its position as No.1 brand across IndiaGSK Consumer: Horlicks strengthens its position as No.1 brand across India
GSK Consumer: Horlicks strengthens its position as No.1 brand across India
IndiaNotes.com821 vues
Hester Biosciences gets manufacturing licence for 2 additional poultry vaccines par IndiaNotes.com
Hester Biosciences gets manufacturing licence for 2 additional poultry vaccinesHester Biosciences gets manufacturing licence for 2 additional poultry vaccines
Hester Biosciences gets manufacturing licence for 2 additional poultry vaccines
IndiaNotes.com571 vues
Vidhi Dyestuffs: To keep its growth story in the coming quarters also par IndiaNotes.com
Vidhi Dyestuffs: To keep its growth story in the coming quarters alsoVidhi Dyestuffs: To keep its growth story in the coming quarters also
Vidhi Dyestuffs: To keep its growth story in the coming quarters also
IndiaNotes.com643 vues
Apollo Tyres approves further expansion of the Truck & Bus radial tyre capacity par IndiaNotes.com
Apollo Tyres approves further expansion of the Truck & Bus radial tyre capacityApollo Tyres approves further expansion of the Truck & Bus radial tyre capacity
Apollo Tyres approves further expansion of the Truck & Bus radial tyre capacity
IndiaNotes.com1.3K vues
Grasim Industries reports improved performance in Q1FY16 par IndiaNotes.com
Grasim Industries reports improved performance in Q1FY16Grasim Industries reports improved performance in Q1FY16
Grasim Industries reports improved performance in Q1FY16
IndiaNotes.com358 vues
Cummins India: No interest burden being free from long-term or short-term debt par IndiaNotes.com
Cummins India: No interest burden being free from long-term or short-term debtCummins India: No interest burden being free from long-term or short-term debt
Cummins India: No interest burden being free from long-term or short-term debt
IndiaNotes.com771 vues
Buy Makers Laboratories, company growing rapidly with strong thrust on brande... par IndiaNotes.com
Buy Makers Laboratories, company growing rapidly with strong thrust on brande...Buy Makers Laboratories, company growing rapidly with strong thrust on brande...
Buy Makers Laboratories, company growing rapidly with strong thrust on brande...
IndiaNotes.com375 vues
Capital First: Long-term credit rating is rated highly at AA+ by CARE par IndiaNotes.com
Capital First: Long-term credit rating is rated highly at AA+ by CARECapital First: Long-term credit rating is rated highly at AA+ by CARE
Capital First: Long-term credit rating is rated highly at AA+ by CARE
IndiaNotes.com396 vues
Orient Cement: Best placed to benefit from demand revival in AP & Telengana r... par IndiaNotes.com
Orient Cement: Best placed to benefit from demand revival in AP & Telengana r...Orient Cement: Best placed to benefit from demand revival in AP & Telengana r...
Orient Cement: Best placed to benefit from demand revival in AP & Telengana r...
IndiaNotes.com529 vues
Canara Bank's operating performance to improve in remaining 9MFY16E par IndiaNotes.com
Canara Bank's operating performance to improve in remaining 9MFY16ECanara Bank's operating performance to improve in remaining 9MFY16E
Canara Bank's operating performance to improve in remaining 9MFY16E
IndiaNotes.com238 vues
Buy Jenburkt Pharmaceuticals; government's amended FDI policy to cover medica... par IndiaNotes.com
Buy Jenburkt Pharmaceuticals; government's amended FDI policy to cover medica...Buy Jenburkt Pharmaceuticals; government's amended FDI policy to cover medica...
Buy Jenburkt Pharmaceuticals; government's amended FDI policy to cover medica...
IndiaNotes.com550 vues
Hexaware Technologies adds 9 clients in Q2CY15, Buy par IndiaNotes.com
Hexaware Technologies adds 9 clients in Q2CY15, BuyHexaware Technologies adds 9 clients in Q2CY15, Buy
Hexaware Technologies adds 9 clients in Q2CY15, Buy
IndiaNotes.com1.2K vues
Indoco Remedies: Weak domestic growth offsets export revenues in Q1FY16; Hold par IndiaNotes.com
Indoco Remedies: Weak domestic growth offsets export revenues in Q1FY16; HoldIndoco Remedies: Weak domestic growth offsets export revenues in Q1FY16; Hold
Indoco Remedies: Weak domestic growth offsets export revenues in Q1FY16; Hold
IndiaNotes.com246 vues
PI Industries: Custom synthesis exports deliver growth of ~26% in Q1FY16; Buy par IndiaNotes.com
PI Industries: Custom synthesis exports deliver growth of ~26% in Q1FY16; BuyPI Industries: Custom synthesis exports deliver growth of ~26% in Q1FY16; Buy
PI Industries: Custom synthesis exports deliver growth of ~26% in Q1FY16; Buy
IndiaNotes.com356 vues
Torrent Pharma Q1FY16: IndiaNivesh maintain 'buy' for an upgraded price target par IndiaNotes.com
Torrent Pharma Q1FY16: IndiaNivesh maintain 'buy' for an upgraded price targetTorrent Pharma Q1FY16: IndiaNivesh maintain 'buy' for an upgraded price target
Torrent Pharma Q1FY16: IndiaNivesh maintain 'buy' for an upgraded price target
IndiaNotes.com619 vues

Dernier

Stock Market Brief Deck 1129.pdf par
Stock Market Brief Deck 1129.pdfStock Market Brief Deck 1129.pdf
Stock Market Brief Deck 1129.pdfMichael Silva
45 vues46 diapositives
Market Efficiency.pptx par
Market Efficiency.pptxMarket Efficiency.pptx
Market Efficiency.pptxRavindra Nath Shukla
20 vues25 diapositives
Slides.pdf par
Slides.pdfSlides.pdf
Slides.pdfGRAPE
13 vues168 diapositives
GroupPresentation_MicroEconomics par
GroupPresentation_MicroEconomicsGroupPresentation_MicroEconomics
GroupPresentation_MicroEconomicsBethanyAline
21 vues27 diapositives
Presentation_Yale.pdf par
Presentation_Yale.pdfPresentation_Yale.pdf
Presentation_Yale.pdfGRAPE
8 vues207 diapositives
Federal Reserve's Rate Hike Pause - Assessing the Ringmaster's Impact on Capi... par
Federal Reserve's Rate Hike Pause - Assessing the Ringmaster's Impact on Capi...Federal Reserve's Rate Hike Pause - Assessing the Ringmaster's Impact on Capi...
Federal Reserve's Rate Hike Pause - Assessing the Ringmaster's Impact on Capi...Jasper Colin
6 vues8 diapositives

Dernier(20)

Stock Market Brief Deck 1129.pdf par Michael Silva
Stock Market Brief Deck 1129.pdfStock Market Brief Deck 1129.pdf
Stock Market Brief Deck 1129.pdf
Michael Silva45 vues
Slides.pdf par GRAPE
Slides.pdfSlides.pdf
Slides.pdf
GRAPE13 vues
GroupPresentation_MicroEconomics par BethanyAline
GroupPresentation_MicroEconomicsGroupPresentation_MicroEconomics
GroupPresentation_MicroEconomics
BethanyAline21 vues
Presentation_Yale.pdf par GRAPE
Presentation_Yale.pdfPresentation_Yale.pdf
Presentation_Yale.pdf
GRAPE8 vues
Federal Reserve's Rate Hike Pause - Assessing the Ringmaster's Impact on Capi... par Jasper Colin
Federal Reserve's Rate Hike Pause - Assessing the Ringmaster's Impact on Capi...Federal Reserve's Rate Hike Pause - Assessing the Ringmaster's Impact on Capi...
Federal Reserve's Rate Hike Pause - Assessing the Ringmaster's Impact on Capi...
Jasper Colin6 vues
DDKT-Munich.pdf par GRAPE
DDKT-Munich.pdfDDKT-Munich.pdf
DDKT-Munich.pdf
GRAPE7 vues
Slides.pdf par GRAPE
Slides.pdfSlides.pdf
Slides.pdf
GRAPE13 vues
Stock Market Brief Deck 1124.pdf par Michael Silva
Stock Market Brief Deck 1124.pdfStock Market Brief Deck 1124.pdf
Stock Market Brief Deck 1124.pdf
Michael Silva59 vues
What is Credit Default Swaps par MksSkyView
What is Credit Default SwapsWhat is Credit Default Swaps
What is Credit Default Swaps
MksSkyView7 vues
Presentation.pdf par GRAPE
Presentation.pdfPresentation.pdf
Presentation.pdf
GRAPE13 vues
DDKT-SAET.pdf par GRAPE
DDKT-SAET.pdfDDKT-SAET.pdf
DDKT-SAET.pdf
GRAPE27 vues
DDKT-Praga.pdf par GRAPE
DDKT-Praga.pdfDDKT-Praga.pdf
DDKT-Praga.pdf
GRAPE10 vues
Monthly Market Outlook | November 2023 par iciciprumf
Monthly Market Outlook | November 2023Monthly Market Outlook | November 2023
Monthly Market Outlook | November 2023
iciciprumf23 vues
Teaching Third Generation Islamic Economics par Asad Zaman
Teaching Third Generation Islamic EconomicsTeaching Third Generation Islamic Economics
Teaching Third Generation Islamic Economics
Asad Zaman34 vues
MATRIX.pptx par baijup4
MATRIX.pptxMATRIX.pptx
MATRIX.pptx
baijup414 vues

IndiaNivesh maintain 'buy' on this textile scrip with upgraded target after Q1FY16 results

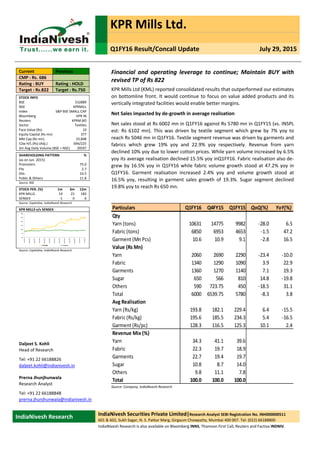
  • 1.     KPR Mills Ltd.   Q1FY16 Result/Concall Update  July 29, 2015                                                                                                     IndiaNivesh Research  IndiaNivesh Securities Private Limited|Research Analyst SEBI Registration No. INH000000511  601 & 602, Sukh Sagar, N. S. Patkar Marg, Girgaum Chowpatty, Mumbai 400 007. Tel: (022) 66188800   IndiaNivesh Research is also available on Bloomberg INNS, Thomson First Call, Reuters and Factiva INDNIV. Financial  and  operating  leverage  to  continue;  Maintain  BUY  with  revised TP of Rs 822  KPR Mills Ltd (KML) reported consolidated results that outperformed our estimates  on bottomline front. It would continue to focus on value added products and its  vertically integrated facilities would enable better margins.   Net Sales impacted by de‐growth in average realisation  Net sales stood at Rs 6002 mn in Q1FY16 against Rs 5780 mn in Q1FY15 (vs. INSPL  est:  Rs  6102  mn).  This  was  driven  by  textile  segment  which  grew  by  7%  yoy  to  reach Rs 5046 mn in Q1FY16. Textile segment revenue was driven by garments and  fabrics  which  grew  19%  yoy  and  22.9%  yoy  respectively.  Revenue  from  yarn  declined 10% yoy due to lower cotton prices. While yarn volume increased by 6.5%  yoy its average realisation declined 15.5% yoy inQ1FY16. Fabric realisation also de‐ grew by 16.5% yoy in Q1FY16 while fabric volume growth stood at 47.2% yoy in  Q1FY16.  Garment  realisation  increased  2.4%  yoy  and  volume  growth  stood  at  16.5%  yoy,  resulting  in  garment  sales  growth  of  19.3%.  Sugar  segment  declined  19.8% yoy to reach Rs 650 mn.    Particulars  Q1FY16 Q4FY15 Q1FY15 QoQ(%) YoY(%) Qty Yarn (tons) 10631 14775 9982 ‐28.0 6.5 Fabric (tons) 6850 6953 4653 ‐1.5 47.2 Garment (Mn Pcs) 10.6 10.9 9.1 ‐2.8 16.5 Value (Rs Mn) Yarn 2060 2690 2290 ‐23.4 ‐10.0 Fabric 1340 1290 1090 3.9 22.9 Garments 1360 1270 1140 7.1 19.3 Sugar 650 566 810 14.8 ‐19.8 Others 590 723.75 450 ‐18.5 31.1 Total 6000 6539.75 5780 ‐8.3 3.8 Avg Realisation Yarn (Rs/kg) 193.8 182.1 229.4 6.4 ‐15.5 Fabric (Rs/kg) 195.6 185.5 234.3 5.4 ‐16.5 Garment (Rs/pc) 128.3 116.5 125.3 10.1 2.4 Revenue Mix (%) Yarn 34.3 41.1 39.6 Fabric 22.3 19.7 18.9 Garments 22.7 19.4 19.7 Sugar 10.8 8.7 14.0 Others 9.8 11.1 7.8 Total 100.0 100.0 100.0   Source: Company, IndiaNivesh Research  Daljeet S. Kohli  Head of Research  Tel: +91 22 66188826  daljeet.kohli@indianivesh.in    Prerna Jhunjhunwala  Research Analyst  Tel: +91 22 66188848  prerna.jhunjhunwala@indianivesh.in  Current  Previous  CMP : Rs. 686    Rating : BUY  Rating : HOLD  Target : Rs.822  Target : Rs.750    STOCK INFO  BSE  532889  NSE  KPRMILL  Index   S&P BSE SMALL CAP  Bloomberg  KPR IN  Reuters  KPRM.BO  Sector  Textiles  Face Value (Rs)  10  Equity Capital (Rs mn)   377  Mkt Cap (Rs mn)  25,848  52w H/L (Rs) (Adj.)  694/225  3m Avg Daily Volume (BSE + NSE)  39597    SHAREHOLDING PATTERN  %  (as on Jun. 2015)  Promoters  75.0  FIIs  2.7  DIIs  10.5  Public & Others  11.8  Source: BSE    STOCK PER. (%)  1m  3m  12m  KPR MILLS   14  21  182  SENSEX   ‐1  0  6  Source: Capitaline, IndiaNivesh Research    KPR MILLS v/s SENSEX    Source: Capitaline, IndiaNivesh Research          20 70 120 170 220 270 320 Jul/2014 Aug/2014 Sep/2014 Oct/2014 Nov/2014 Dec/2014 Jan/2015 Feb/2015 Mar/2015 Apr/2015 May/2015 Jun/2015 Jul/2015 KPR Mills Sensex
  • 2. Q1FY16 Result/Concall Update (contd...)            KPR Mills Ltd. (contd...)    July 29, 2015 | 2     EBITDA stood at Rs 993 mn in Q1FY16 against Rs 934 mn in Q1FY15, growth of 6.2% yoy.  EBITDA margin improved to 16.5% in Q1FY16 from 16.2% in Q1FY15, an improvement of  37 bps yoy. EBITDA was positively impacted by lower raw material cost (62.5% of net  sales in Q1FY16 vs 67.3% of net sales in Q1FY15) while it was offset by higher other  expenses (12.5% vs 8.9%) and employee cost (8.4% vs. 7.6%).    PAT grew 28.1% yoy to reach Rs 505 mn in Q1FY16 from Rs 394 mn in Q1FY15 (INSPL  est:  Rs  448  mn).  This  growth  in  PAT  is  on  account  of  higher  other  operating  income  (48.1% yoy) and reduction in depreciation cost (‐6% yoy) and interest cost (17.3% yoy).  Adjusting for other income and other operating income, adjusted PAT stood at Rs 212  mn in Q1FY16 from Rs 173 mn in Q1FY15, signifying growth of 22% yoy. This illustrates  the impact of lower interest and depreciation cost on the performance of the company.   We attended the conference call of the company and following are the key takeaways:   Management focus would continue on garments business. The revenue mix would tilt  towards garments with increasing garment capacities and higher captive consumption.   Exports of the company stood at Rs 2040 mn.    The share of compact yarn is likely to increase from 50% to 75% by end of FY16E. This  would enable better profitability. Average realisation of compact yarn is generally better  than basic yarn by Rs 5 per kg.    Increase  in  power  cost  was  the  primary  reason  for  increase  in  other  expenses.  The  company incurred additional power cost of Rs 170 mn due to lower generation from  wind power. Consequently, it had to purchase electricity from the grid. However, this is  not a recurring phenomenon. Total power expenditure in Q1FY16 stood at Rs 470 mn.    Total capex for FY16E is likely to be Rs 2250 mn of which Rs 1750 mn would be for the  new garment facility and Rs 500 mn would be for modernisation and maintenance.    Total debt at the end of the quarter stood at Rs 6120 mn of which term loan was Rs  3780  mn  and  working  capital  loan  was  Rs  2330  mn  (reduced  from  Rs  4330  mn  in  Q4FY15). The company would repay term loan of Rs 900 mn. It would take additional Rs  1000  mn  for  the  Greenfield  garment  facility  under  Technological  Upgradation  Funds  Scheme (TUFS). Cash flows generated through existing capacities would be utilised for  working capital. The management stated that the debt level of the company is likely to  remain at current levels in FY16E.    The  company  has  more  than  40  clients  of  which  2  are  from  the  US.  Top  20  clients  contribute 70% to revenue.    The company reduced inventory by Rs 1170 mn. The cost of cotton stood at Rs 100 per  kg. The management stated that the cotton prices are likely to stabilise at current levels.    The management stated that as a rule of thumb, for Rs 1000 mn revenue in garments, it  would require 1000 people which would manufacture 8mn pcs, 500 sewing machines,  capex of Rs 400‐500 mn and working capital of 20% of sales.    EBITDA margin in yarn is 18% while that in garments is 24%.     Management  guided  for  operating  margin  of  22%‐24%  (including  other  operating  income) going forward. Operating margin (including other operating income) stood at  20.4% in Q1FY16. It also guided that the company may become debt‐free eventually due  to focus on low capital intensive garments business.     Revision in estimates  We maintain our revenue and EBITDA estimates, given the unpredictable nature of cotton  prices. However, we have lowered debt assumption taking into consideration the company  guidance to maintain it at current levels. Consequently, our net profit estimates are revised  upwards by 2.7% /1% for FY16E / FY17E respectively.  
  • 3. Q1FY16 Result/Concall Update (contd...)            KPR Mills Ltd. (contd...)    July 29, 2015 | 3    New Earlier % Chg New Earlier % Chg Sales 28422 28422 0.0 33379 33379 0.0 EBITDA 4491 4491 0.0 5646 5646 0.0 PAT 2395 2332 2.7 3315 3282 1.0 EPS 63.6 61.9 2.7 88.0 87.1 1.0 EBITDA Margin (%) 15.8 15.8 3 bps 16.9 16.2 77 bps PAT Margin (%) 8.4 8.2 19 bps 9.9 9.3 60 bps FY16E FY17E Particulars (Rs Mn)   Source: Company, IndiaNivesh Research  Valuation  At CMP of Rs 686, the stock trades at PE of 10.9x and 7.8x its FY16E and FY17E earnings of Rs  63.2 and Rs 88 per share respectively. We are positive on the strong business model of the  company due to its vertically integrated capacities, focus on value added products, captive  green  power  capacity  and  leadership  position  in  knitwear  segment  of  the  industry.  Its  proximity  to  clients  in  Tirupur  provides  location  advantages.  Reducing  debt  and  expected  improvement in margin is likely to improve its ROE to 26.4% in FY17E from 19.7% in FY15.  We maintain BUY rating on the stock with revised SOTP based target price of Rs 822. We  have revised EV/EBITDA multiple of textile segment to 6.2x from 5.7x earlier due to expected  improvement  in  margins  and  its  better  financial  performance  than  peers  like  Vardhaman  Textiles,  Arvind  and  Raymond.  The  key  risk  to  our  estimates  would  be  steep  volatility  in  cotton prices.   SOTP based target price  Segment EBITDA (FY17E) Multiple Rs  Mn Textiles 5,990 6.2 36921 Sugar 320 6 1918 EV 38839 Debt (FY15) 8169 Cash (FY15) 286 Market Cap 30956 Target Price (Rs Per Share) 822   Source: IndiaNivesh Research  Textile Peers  Company CMP Sales Sales CAGR  EPS CAGR  EBITDA Margin PAT Margin ROE (%) P/E EV/EBITDA (FY17E) (FY14‐FY17E) (%) (FY14‐FY17E) (%) FY17E (%) FY17E (%) FY17E (%) FY17E (x) FY17E (x) Arvind 291 103074 14.8 27.8 13.7 5.5 16.8 13.5 7.7 Raymond 467 66480 11.7 38.0 9.7 3.4 11.4 13.3 6.8 Vardhman 758 78291 7.4 31.9 19.2 8.3 16.0 7.4 4.4 Average ‐ 82615 11.3 32.6 14.2 5.7 14.7 11.4 6.3 KPR 686 33379 15.8 38.2 16.9 9.9 26.4 7.8 4.9  Source: Company, Bloomberg, IndiaNivesh Research     
  • 4. Q1FY16 Result/Concall Update (contd...)            KPR Mills Ltd. (contd...)    July 29, 2015 | 4    Financial Performance  Rs in mn Q1FY16 Q4FY15 Q1FY15 QoQ (%) YoY (%) Net sales 6,002 6,553 5,780 ‐8.4 3.8 Raw Materials 3,753 4,375 3,891 ‐14.2 ‐3.5 Staff cost 507 468 437 8.3 15.9 Other expenditure 750 860 517 ‐12.8 44.9 Operating Expenses 5,009 5,702 4,845 ‐12.1 3.4 EBITDA 993 851 934 16.7 6.2 EBITDA Margin (%) 16.5% 13.0% 16.2% 356 bps 37 bps Other Operating Income 231 215 156 7.5 48.1 Other Income 63 63 65 ‐0.9 ‐3.4 Depreciation 376 369 400 1.8 ‐6.0 Profit bef. Int. & Tax 910 759 755 19.9 20.5 Interest & finance ch. 181 213 218 ‐15.3 ‐17.3 Profit before tax 730 546 537 33.6 35.9 Total tax expenses 225 45 143 398.0 57.4 Add/Less: Extraordinary Items 0 0 0 Net profit 505 501 394 0.8 28.1 PAT 505 501 394 0.8 28.1 Effective tax rate 30.8% 8.3% 26.6% Adj. PAT Margins (%) 8.4% 7.6% 6.8% 76 bps 160 bps EPS 13.4 13.3 10.5 0.8 28.1   Source: Company, IndiaNivesh Research  Segmental Performance  Rs in mn Q1FY16 Q4FY15 Q1FY15 QoQ (%) YoY (%) Revenue (Rs Mn) Textile 5046 5532 4716 ‐8.8 7.0 Sugar 701 768 856 ‐8.8 ‐18.1 Others 308 252 253 22.2 21.8 Total 6055 6553 5824 ‐7.6 4.0 EBIT (Rs Mn) Textile 834 675 630 23.6 32.5 Sugar 5 5 47 ‐13.2 ‐90.1 Others 9 16 14 ‐43.1 ‐35.0 Total 848 696 690 21.8 22.8 EBIT Margin (%) Textile 16.5 12.2 13.3 432 bps 317 bps Sugar 0.7 0.7 5.5 (3 bps) (480 bps) Others 3.0 6.4 5.5 (340 bps) (258 bps)   Source: Company, IndiaNivesh Research 
  • 5. Q1FY16 Result/Concall Update (contd...)            KPR Mills Ltd. (contd...)    July 29, 2015 | 5    Consolidated Financial Statements              Income statement Y E March (Rs m) FY 13 FY 14 FY 15P FY 16E FY 17E Net sales 16259 23105 24885 28422 33379 Growth % 35.1 42.1 7.7 14.2 17.4 Expenditure 12774 19488 21285 23931 27732 Raw Material 9938 15867 16740 18729 21541 Power and Fuel 646 713 1070 1279 1502 Employee 1167 1510 1827 2217 2770 Others 1024 1398 1648 1705 1919 EBITDA 3486 3617 3600 4491 5646 Growth % 195.2 3.8 ‐0.5 24.8 25.7 EBITDA Margin % 21.4 15.7 14.5 15.8 16.9 Other Income 445 915 1,013 1,141 1,243 Depreciation and amortisation 1509 1567 1540 1595 1664 EBIT 2421 2966 3073 4038 5226 EBIT Margin % 14.9 12.8 12.3 14.2 15.7 Interest 980 1045 839 637 490 Exceptional/Extraordinary item 0 0 0 0 0 PBT 1441 1921 2234 3401 4735 PBT Margin % 8.9 8.3 9.0 12.0 14.2 Tax 411 504 498 1020 1421 Effective tax rate % 29 26 22 30 30 PAT 1030 1417 1736 2381 3315 Adj. PAT 1030 1417 1736 2381 3315 Growth% 214.2 37.5 22.5 37.2 39.2 Adj. PAT Margin % 6.3 6.1 7.0 8.4 9.9 Balance sheet Y E March (Rs m) FY 13 FY 14 FY 15P FY 16E FY 17E Equity Share Capital 377 377 377 377 377 Preference Capital and others 150 150 150 150 150 Reserves & Surplus 6536 7619 8925 10649 13421 Net Worth 7063 8145 9452 11176 13947 Total debt 10082 9620 8169 6370 4904 Net defered tax liability 624 601 600 600 600 Total Liabilities 17768 18366 18222 18146 19452 Gross Fixed Assets 19508 20190 21208 22740 23340 Less Depreciation 6123 7638 9178 10852 12516 Capital Work in Progress 0 60 50 55 61 Net Fixed Assets 13385 12611 12080 11942 10884 Goodwill on Consolidation 7 7 7 7 7 Investments 665 627 615 615 615 Current Assets 6844 8399 9497 9842 13239 Inventories 3576 4053 5164 5400 7176 Sundry Debtors 1611 2380 2818 3126 3839 Cash & Bank Balance 761 992 286 36 774 Loans & advances 704 508 823 853 1001 Other Current assets 193 467 407 427 449 Current Liabilities & provisions 3132 3278 3978 4260 5293 Net Current Assets 3712 5121 5520 5582 7946 Mis Exp not written off 0 0 0 0 0 Total assets 17768 18366 18222 18146 19452 Cash Flow Y E March (Rs m) FY 13 FY 14 FY 15P FY 16E FY 17E PBT 1441 1921 2234 3401 4735 Adjustment for:      Depreciation 1509 1567 1540 1595 1664      Others 926 995 738 531 379 Changes in working capital ‐1476 450 ‐1721 ‐595 ‐1862 Tax expenses ‐255 ‐412 ‐498 ‐1020 ‐1421 Cash flow from operations 2145 4520 2294 3911 3495 Capital expenditure ‐2535 ‐2240 ‐990 ‐1555 ‐606 Free Cash Flow ‐389 2281 1304 2356 2890 Others 36 100 97 102 107 Cash flow from investments ‐2499 ‐2140 ‐893 ‐1453 ‐499 Interest  ‐883 ‐1101 ‐672 ‐510 ‐392 Loans availed or (repaid) 2063 ‐462 ‐1451 ‐1799 ‐1466 Proceeds from Issue of shares (incl share  premium) 0 0 0 0 0 Dividend paid (incl tax) ‐363 ‐321 ‐399 ‐399 ‐399 Cash flow from Financing 817 ‐1883 ‐2521 ‐2708 ‐2257 Net change in cash 463 497 ‐1121 ‐250 739 Cash at the beginning of the year 446 910 1406 286 36 Cash at the end of the year 910 1406 286 36 774 Reconciliation with other balances ‐149 ‐415 0 0 0 Cash as per Balance Sheet 761 992 286 36 774 Key ratios Y E March FY 13 FY 14 FY 15P FY 16E FY 17E Adj. EPS (Rs) 27.3 37.6 46.1 63.2 88.0 Cash EPS (Rs) 67.4 79.2 86.9 105.5 145.3 BVPS 187.4 216.2 250.9 296.6 407.2 DPS (Rs) 6.0 7.0 9.0 9.0 9.0 Adj. P/E (x) 25.1 18.2 14.9 10.9 7.8 P/CEPS (x) 10.2 8.7 7.9 6.5 4.7 P/BV (x) 3.7 3.2 2.7 2.3 1.7 EV/EBITDA(x) 10.1 9.5 9.4 7.2 4.9 M cap/sales (x) 1.6 1.1 1.0 0.9 0.7 ROCE 15.4 17.0 17.4 23.0 28.7 ROE 15.5 18.6 19.7 23.1 26.4 Inventory (days) 61.1 60.3 67.6 67.8 68.8 Debtors (days) 33.7 31.5 38.1 38.2 38.1 Trade Payables (days) 17.0 31.1 41.1 36.3 35.6 Total Asset Turnover (x) 0.9 1.1 1.1 1.3 1.4 Fixed Asset Turnover (x) 1.3 1.8 2.0 2.4 2.9 Debt/equity (x) 1.4 1.2 0.9 0.6 0.4 Debt/ebitda (x) 2.9 2.7 2.3 1.4 0.9 Interest Coverage (x) 2.5 2.8 3.7 6.3 10.7 Dividend Yield % 0.9 1.0 1.3 1.3 1.3
  • 6. Q1FY16 Result/Concall Update (contd...)            KPR Mills Ltd. (contd...)    July 29, 2015 | 6    Disclaimer: This document has been prepared by IndiaNivesh Securities Private Limited (“INSPL”), for use by the recipient as information only and is not for circulation or public distribution. INSPL  includes subsidiaries, group and associate companies, promoters, employees and affiliates. INSPL researches, aggregates and faithfully reproduces information available in public domain and other  sources, considered to be reliable and makes them available for the recipient, though its accuracy or completeness has not been verified by INSPL independently and cannot be guaranteed. The third  party research material included in this document does not represent the views of INSPL and/or its officers, employees and the recipient must exercise independent judgement with regard to such  content. This document has been published in accordance with the provisions of Regulation 18 of the Securities and Exchange Board of India (Research Analysts) Regulations, 2014. This document is  not to be altered, transmitted, reproduced, copied, redistributed, uploaded or published or made available to others, in any form, in whole or in part, for any purpose without prior written permission  from INSPL. This document is solely for information purpose and should not to be construed as an offer to sell or the solicitation of an offer to buy any security. Recipients of this document should be  aware that past performance is not necessarily a guide for future performance and price and value of investments can go up or down. The suitability or otherwise of any investments will depend upon  the recipients particular circumstances. INSPL does not take responsibility thereof. The research analysts of INSPL have adhered to the code of conduct under Regulation 24 (2) of the Securities and  Exchange Board of India (Research Analysts) Regulations, 2014. This document is based on technical and derivative analysis center on studying charts of a stock’s price movement, outstanding positions  and trading volume, as opposed to focusing on a company’s fundamentals and, as such, may not match with a report on a company’s fundamentals. Nothing in this document constitutes investment,  legal, accounting and/or tax advice or a representation that any investment or strategy is suitable or appropriate to recipients’ specific circumstances. INSPL does not accept any responsibility or  whatever nature for the information, assurances, statements and opinion given, made available or expressed herein or for any omission or for any liability arising from the use of this document.  Opinions expressed are our current opinions as of the date appearing on this document only. The opinions are subject to change without any notice. INSPL directors/employees and its clients may have  holdings in the stocks mentioned in the document.  This report is based / focused on fundamentals of the Company and forward‐looking statements as such, may not match with a report on a company’s technical analysis report   Each of the analysts named below hereby certifies that, with respect to each subject company and its securities for which the analyst is responsible in this report, (1) all of the views expressed in this  report accurately reflect his or her personal views about the subject companies and securities, and (2) no part of his or her compensation was, is, or will be, directly or indirectly, related to the specific  recommendations or views expressed in this report: Daljeet S Kohli, Amar Maurya, Abhishek Jain, Yogesh Hotwani, Prerna Jhunjhunwala, Kaushal Patel, Rahul Koli, Tushar Manudhane, Aman Vij,  Abhitesh Agarwal, Harshraj Aggarwal & Dharmesh Kant.  Following table contains the disclosure of interest in order to adhere to utmost transparency in the matter:  Disclosure of Interest Statement  1  Details  of  business  activity  of  IndiaNivesh  Securities  Private  Limited  (INSPL)   INSPL is a Stock Broker registered with BSE, NSE and MCX ‐ SX in all the major segments viz. Cash, F & O and CDS  segments. INSPL is also a Depository Participant and registered with both Depository viz. CDSL and NSDL. Further,  INSPL is a Registered Portfolio Manager and is registered with SEBI.  2  Details of Disciplinary History of INSPL  No disciplinary action is / was running / initiated against INSPL  3  Details of Associates of INSPL  Please refer to the important 'Stock Holding Disclosure' report on the IndiaNivesh website (investment Research  Section  ‐http://www.indianivesh.in/Research/Holding_Disclosure.aspx?id=10  link).  Also,  please  refer  to  the  latest  update on respective stocks for the disclosure status in respect of those stocks. INSPL and its affiliates may have  investment positions in the stocks recommended in this report.  4  Research analyst or INSPL or its relatives'/associates' financial interest  in the subject company and nature of such financial interest  No (except to the extent of shares held by Research analyst or INSPL or its relatives'/associates')  5  Research analyst or INSPL or its relatives'/associates' actual/beneficial  ownership of 1% or more in securities of the subject company, at the  end  of  the  month  immediately  preceding  the  date  of  publication  of  the document.  Please refer to the important 'Stock Holding Disclosure' report on the IndiaNivesh website  (investment Research  Section ‐ http://www.indianivesh.in/Research/Holding_Disclosure.aspx?id=10 link). Also, please refer to the latest  update on respective stocks for the disclosure status in respect of those stocks. INSPL and its affiliates may have  investment positions in the stocks recommended in this report.  6  Research  analyst  or  INSPL  or  its  relatives'/associates'  any  other  material conflict of interest at the time of publication of the document   No  7  Has  research  analyst  or  INSPL  or  its  associates  received  any  compensation from the subject company in the past 12 months  No  8  Has  research  analyst  or  INSPL  or  its  associates  managed  or  co‐ managed public offering of securities for the subject company in the  past 12 months  No  9  Has  research  analyst  or  INSPL  or  its  associates  received  any  compensation  for  investment  banking  or  merchant  banking  or  brokerage services from the subject company in the past 12 months  No  10  Has  research  analyst  or  INSPL  or  its  associates  received  any  compensation for products or services other than investment banking  or merchant banking or brokerage services from the subject company  in the past 12 months  No  11  Has  research  analyst  or  INSPL  or  its  associates  received  any  compensation  or  other  benefits  from  the  subject  company  or  third  party in connection with the document.  No  12  Has research analyst served as an officer, director or employee of the  subject company  No  13  Has research analyst or INSPL engaged in market making activity for  the subject company  No  14  Other disclosures  No    INSPL, its affiliates, directors, its proprietary trading and investment businesses may, from time to time, make investment decisions that are inconsistent with or contradictory to the recommendations  expressed herein. The views contained in this document are those of the analyst, and the company may or may not subscribe to all the views expressed within. This information is subject to change, as  per applicable law, without any prior notice. INSPL reserves the right to make modifications and alternations to this statement, as may be required, from time to time.  Definitions of ratings   BUY. We expect this stock to deliver more than 15% returns over the next 12 months.   HOLD. We expect this stock to deliver ‐15% to +15% returns over the next 12 months.   SELL. We expect this stock to deliver <‐15% returns over the next 12 months.   Our target prices are on a 12‐month horizon basis.   Other definitions   NR = Not Rated. The investment rating and target price, if any, have been arrived at due to certain circumstances not in control of INSPL  CS = Coverage Suspended. INSPL has suspended coverage of this company.  UR=Under Review. Such e invest review happens when any developments have already occurred or likely to occur in target company & INSPL analyst is waiting for some more information to draw  conclusion on rating/target.   NA = Not Available or Not Applicable. The information is not available for display or is not applicable.   NM = Not Meaningful. The information is not meaningful and is therefore excluded.  Research Analyst has not served as an officer, director or employee of Subject Company  One year Price history of the daily closing price of the securities covered in this note is available at www.nseindia.com and www.economictimes.indiatimes.com/markets/stocks/stock‐quotes. (Choose  name of company in the list browse companies and select 1 year in icon YTD in the price chart)        IndiaNivesh Securities Private Limited  Research Analyst SEBI Registration No. INH000000511  601 & 602, Sukh Sagar, N. S. Patkar Marg, Girgaum Chowpatty, Mumbai 400 007.  Tel: (022) 66188800 / Fax: (022) 66188899  e‐mail: research@indianivesh.in  |  Website: www.indianivesh.in