ACC: Buy for a target of Rs1650
•
0 j'aime•197 vues

ACC would be the biggest beneficiary of an improvement in the domestic economy due to its Pan-India presence and have one of the cheapest valuations compared to its peers. The recent modernization of Wadi and Chanda and upcoming commissioning of modernized Jamul plant should see improved efficiencies kicking in. Stock trades at EV/T of US$120 CY15E capacity, significantly lower compared to US$156 and US$160 of UTCEM and ACEM, respectively. We maintain our Buy rating with TP of Rs1,653 at EV/T of US$140 CY15E capacity of 34m tonnes.

Recommandé
Recommandé
Contenu connexe
Tendances
Tendances (19)
Similaire à ACC: Buy for a target of Rs1650
Similaire à ACC: Buy for a target of Rs1650 (20)
Plus de IndiaNotes.com
Plus de IndiaNotes.com (20)
Dernier
Dernier (20)
ACC: Buy for a target of Rs1650
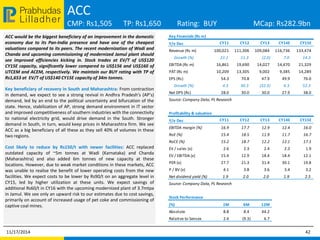
- 1. Prabhudas ACC Lilladher CMP: Rs1,505 TP: Rs1,650 Rating: BUY MCap: Rs282.9bn ACC would be the biggest beneficiary of an improvement in the domestic economy due to its Pan-India presence and have one of the cheapest valuations compared to its peers. The recent modernization of Wadi and Chanda and upcoming commissioning of modernized Jamul plant should see improved efficiencies kicking in. Stock trades at EV/T of US$120 CY15E capacity, significantly lower compared to US$156 and US$160 of UTCEM and ACEM, respectively. We maintain our BUY rating with TP of Rs1,653 at EV/T of US$140 CY15E capacity of 34m tonnes. Key beneficiary of recovery in South and Maharashtra: From contraction in demand, we expect to see a strong revival in Andhra Pradesh’s (AP’s) demand, led by an end to the political uncertainty and bifurcation of the state. Hence, stabilization of AP, strong demand environment in IT sector and improved competitiveness of southern industries with the connectivity to national electricity grid, would drive demand in the South. Stronger demand in South, in turn, would keep prices in Maharashtra firm. We see ACC as a big beneficiary of all these as they sell 40% of volumes in these two regions. Cost likely to reduce by Rs150/t with newer facilities: ACC replaced outdated capacity of ~5m tonnes at Wadi (Karnataka) and Chanda (Maharashtra) and also added 6m tonnes of new capacity at these locations. However, due to weak market conditions in these markets, ACC was unable to realise the benefit of lower operating costs from the new facilities. We expect costs to be lower by Rs90/t on an aggregate level in CY15, led by higher utilization at these units. We expect savings of additional Rs60/t in CY16 with the upcoming modernized plant of 3.7mtpa in Jamul. We see only an upward risk to our estimates due to cost savings, primarily on account of increased usage of pet coke and commissioning of captive coal mines. Key Financials (Rs m) Y/e Dec CY11 CY12 CY13 CY14E CY15E Revenue (Rs m) 100,021 111,306 109,084 116,736 133,474 Growth (%) 21.1 11.3 (2.0) 7.0 14.3 EBITDA (Rs m) 16,861 19,690 14,027 14,470 21,329 PAT (Rs m) 10,209 13,305 9,002 9,385 14,289 EPS (Rs) 54.3 70.8 47.9 49.9 76.0 Growth (%) 4.3 30.3 (32.3) 4.3 52.3 Net DPS (Rs) 28.0 30.0 30.0 27.9 38.0 Source: Company Data, PL Research Profitability & valuation Y/e Dec CY11 CY12 CY13 CY14E CY15E EBITDA margin (%) 16.9 17.7 12.9 12.4 16.0 RoE (%) 15.4 18.5 11.9 11.7 16.7 RoCE (%) 15.2 18.7 12.2 12.1 17.1 EV / sales (x) 2.6 2.3 2.4 2.3 1.9 EV / EBITDA (x) 15.4 12.9 18.4 18.4 12.1 PER (x) 27.7 21.3 31.4 30.1 19.8 P / BV (x) 4.1 3.8 3.6 3.4 3.2 Net dividend yield (%) 1.9 2.0 2.0 1.9 2.5 Source: Company Data, PL Research Stock Performance (%) 1M 6M 12M Absolute 8.8 8.4 44.2 Relative to Sensex 2.4 (9.3) 6.7 11/17/2014 42
- 2. Prabhudas Financials Lilladher ACC Income Statement (Rs m) Y/e Dec CY11 CY12 CY13 CY14E CY15E Net Revenue 100,021 111,306 109,084 116,736 133,474 Direct Expenses 37,708 41,146 42,453 44,798 48,719 % of Net Sales 37.7 37.0 38.9 38.4 36.5 Employee Cost 5,743 6,179 6,630 7,212 7,861 % of Net Sales 5.7 5.6 6.1 6.2 5.9 SG&A Expenses 19,400 22,063 22,992 25,571 28,537 % of Net Sales 19.4 19.8 21.1 21.9 21.4 Other Expenses 20,308 22,228 22,983 24,685 27,027 % of Net Sales 20.3 20.0 21.1 21.1 20.2 EBITDA 16,861 19,690 14,027 14,470 21,329 Margin (%) 16.9 17.7 12.9 12.4 16.0 Depreciation 5,100 5,689 5,838 5,939 5,988 PBIT 11,761 14,001 8,189 8,531 15,341 Interest Expenses 969 1,147 517 488 534 PBT 15,053 14,410 12,136 12,837 19,629 Total tax 2,155 3,911 1,319 2,467 5,496 Effective Tax rate (%) 14.3 27.1 10.9 19.2 28.0 PAT 13,008 10,593 10,947 10,512 14,289 Extraordinary Gain/(Loss) 520 (2,460) (223) - - Adjusted PAT 10,209 13,305 9,002 9,385 14,289 Source: Company Data, PL Research Balance Sheet (Rs m) Y/e Dec CY11 CY12 CY13 CY14E CY15E Share Capital 1,880 1,880 1,880 1,880 1,880 Reserves & Surplus 67,911 71,845 76,254 80,664 86,659 Shareholder's Fund 69,791 73,724 78,134 82,544 88,539 Preference Share Capital - - - - - Total Debt 5,107 1,631 350 - - Other Liabilities(net) 25 26 27 29 31 Deferred Tax Liability 5,238 5,226 5,128 5,642 6,623 Total Liabilities 80,161 80,606 83,640 88,215 95,193 Gross Block 100,322 103,994 105,867 108,976 142,867 Less: Depreciation 36,258 44,680 50,167 56,106 62,093 Net Block 64,065 59,314 55,700 52,870 80,773 Capital Work in Progress 4,408 5,083 12,236 25,977 - Cash & Cash Equivalent 29,530 31,594 26,313 17,919 24,920 Total Current Assets 49,756 53,871 52,208 44,838 54,014 Total Current Liabilities 39,049 38,676 37,371 36,481 40,763 Net Current Assets 10,707 15,195 14,837 8,357 13,251 Other Assets - - - - - Total Assets 80,161 80,606 83,640 88,215 95,193 Source: Company Data, PL Research 11/17/2014 43
- 3. Prabhudas Disclaimer Lilladher Prabhudas Lilladher Pvt. Ltd. 3rd Floor, Sadhana House, 570, P. B. Marg, Worli, Mumbai 400 018, India. Tel: (91 22) 6632 2222 Fax: (91 22) 6632 2209 Rating Distribution of Research Coverage 32.7% 49.5% 60% 50% 40% 30% 20% 10% 0% BUY Accumulate Reduce Sell % of Total Coverage PL’s Recommendation Nomenclature 16.8% 0.9% BUY : Over 15% Outperformance to Sensex over 12-months Accumulate : Outperformance to Sensex over 12-months Reduce : Underperformance to Sensex over 12-months Sell : Over 15% underperformance to Sensex over 12-months Trading Buy : Over 10% absolute upside in 1-month Trading Sell : Over 10% absolute decline in 1-month Not Rated (NR) : No specific call on the stock Under Review (UR) : Rating likely to change shortly This document has been prepared by the Research Division of Prabhudas Lilladher Pvt. Ltd. Mumbai, India (PL) and is meant for use by the recipient only as information and is not for circulation. This document is not to be reported or copied or made available to others without prior permission of PL. It should not be considered or taken as an offer to sell or a solicitation to buy or sell any security. The information contained in this report has been obtained from sources that are considered to be reliable. However, PL has not independently verified the accuracy or completeness of the same. Neither PL nor any of its affiliates, its directors or its employees accept any responsibility of whatsoever nature for the information, statements and opinion given, made available or expressed herein or for any omission therein. Recipients of this report should be aware that past performance is not necessarily a guide to future performance and value of investments can go down as well. The suitability or otherwise of any investments will depend upon the recipient's particular circumstances and, in case of doubt, advice should be sought from an independent expert/advisor. Either PL or its affiliates or its directors or its employees or its representatives or its clients or their relatives may have position(s), make market, act as principal or engage in transactions of securities of companies referred to in this report and they may have used the research material prior to publication. We may from time to time solicit or perform investment banking or other services for any company mentioned in this document. 11/17/2014 58