Tata Sponge: Q1 Net grows a whopping 145.45%, buy
•
0 j'aime•320 vues

During Q1FY15, the company's net profit jumps to Rs. 442.80 million against Rs. 180.40 million in the corresponding quarter ending of previous year, an increase of 145.45%. Revenue for the quarter rose by 23.52% to Rs. 2031.20 million. Maintain buy

Recommandé
Recommandé
Contenu connexe
Tendances
Tendances (20)
Similaire à Tata Sponge: Q1 Net grows a whopping 145.45%, buy
Similaire à Tata Sponge: Q1 Net grows a whopping 145.45%, buy (20)
Plus de IndiaNotes.com
Plus de IndiaNotes.com (20)
Dernier
Dernier (20)
Tata Sponge: Q1 Net grows a whopping 145.45%, buy
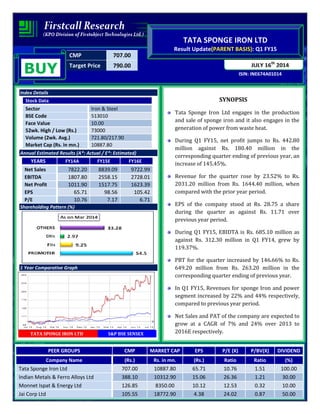
- 1. CMP 707.00 Target Price 790.00 ISIN: INE674A01014 JULY 16th 2014 TATA SPONGE IRON LTD Result Update(PARENT BASIS): Q1 FY15 BUY Index Details Stock Data Sector Iron & Steel BSE Code 513010 Face Value 10.00 52wk. High / Low (Rs.) 73000 Volume (2wk. Avg.) 721.80/217.90 Market Cap (Rs. in mn.) 10887.80 Annual Estimated Results (A*: Actual / E*: Estimated) YEARS FY14A FY15E FY16E Net Sales 7822.20 8839.09 9722.99 EBITDA 1807.80 2558.15 2728.01 Net Profit 1011.90 1517.75 1623.39 EPS 65.71 98.56 105.42 P/E 10.76 7.17 6.71 Shareholding Pattern (%) 1 Year Comparative Graph TATA SPONGE IRON LTD S&P BSE SENSEX SYNOPSIS Tata Sponge Iron Ltd engages in the production and sale of sponge iron and it also engages in the generation of power from waste heat. During Q1 FY15, net profit jumps to Rs. 442.80 million against Rs. 180.40 million in the corresponding quarter ending of previous year, an increase of 145.45%. Revenue for the quarter rose by 23.52% to Rs. 2031.20 million from Rs. 1644.40 million, when compared with the prior year period. EPS of the company stood at Rs. 28.75 a share during the quarter as against Rs. 11.71 over previous year period. During Q1 FY15, EBIDTA is Rs. 685.10 million as against Rs. 312.30 million in Q1 FY14, grew by 119.37%. PBT for the quarter increased by 146.66% to Rs. 649.20 million from Rs. 263.20 million in the corresponding quarter ending of previous year. In Q1 FY15, Revenues for sponge Iron and power segment increased by 22% and 44% respectively, compared to previous year period. Net Sales and PAT of the company are expected to grow at a CAGR of 7% and 24% over 2013 to 2016E respectively. PEER GROUPS CMP MARKET CAP EPS P/E (X) P/BV(X) DIVIDEND Company Name (Rs.) Rs. in mn. (Rs.) Ratio Ratio (%) Tata Sponge Iron Ltd 707.00 10887.80 65.71 10.76 1.51 100.00 Indian Metals & Ferro Alloys Ltd 388.10 10312.90 15.06 26.36 1.21 30.00 Monnet Ispat & Energy Ltd 126.85 8350.00 10.12 12.53 0.32 10.00 Jai Corp Ltd 105.55 18772.90 4.38 24.02 0.87 50.00
- 2. ANAYSIS & RECOMMENDATION- ‘BUY’ Net sales of the company have increased by 23.52% of Rs. 2031.20 in the current June quarter as against Rs. 1644.40 over the corresponding quarter in the previous year. Net profit grew by an insignificant 145.45% of Rs. 442.80 in Q1 FY15 as compared to Rs. 180.40 in previous year quarter. Profit before interest, depreciation and tax rose by 119.37% of Rs. 685.10 million as against Rs. 312.30 million in the corresponding period of the previous year. In Q1 FY15, total expenses increased by just 2% and stood at Rs. 1478.30 from Rs. 1450.10 over the same quarter previous year. In Q1 FY15, Revenues for sponge Iron and power segment increased by 22% and 44% respectively. Tata Sponge Ltd has no long term and short term debt, thus no interest burden on profit margins. We expect that the company to post a CAGR of 7% and 24% in its top-line and bottom-line respectively, over 2013 to 2016E. We expect that the company surplus scenario is likely to continue for the next two to three years, will keep its growth story in the coming quarters also. Thus we recommend ‘BUY’ for the scrip with a target price of Rs. 790.00 for medium to long term investment. QUARTERLY HIGHLIGHTS (PARENT BASIS) Results Updates- Q1 FY15, Months JUN-14 JUN-13 % Change Net Sales 2031.20 1644.40 23.52 PAT 442.80 180.40 145.45 EPS 28.75 11.71 145.45 EBITDA 685.10 312.30 119.37 The company’s net profit jumps to Rs. 442.80.00 million against Rs. 180.40 million in the corresponding quarter ending of previous year, an increase of 145.45%. Revenue for the quarter rose by 23.52% to Rs. 2031.20 million from Rs. 1644.40 million, when compared with the prior year period. Reported earnings per share of the company stood at Rs. 28.75 a share during the quarter as against Rs. 11.71 over previous year period. Profit before interest, depreciation and tax is Rs. 685.10 million as against Rs. 312.30 million in the corresponding period of the previous year.
- 3. Break up of Expenditure Break up of Expenditure Rs. in Million Q1 FY15 Q1 FY14 % Change Cost of Material Consumed 1272.30 1231.20 3% Employee Benefit Expenses 73.70 67.20 10% Depreciation & Amortization Expense 27.60 44.40 -38% Other Expenses 165.90 132.20 25% Segment Revenue
- 4. COMPANY PROFILE Tata Sponge Ltd incorporated in 1982. The company produces and sells sponge iron in India. It offers sponge iron to secondary steel sector for the production of steel. Tata Sponge Iron Limited is a subsidiary of Tata Steel Limited. The company also operates two power plants with a combined generation capacity of 26 MW that generate power from waste heat. The Company has an annual manufacturing capacity of 390,000 tonnes of sponge iron from its 3 kilns The entire process of management system certification and reduce paperwork primarily through duplication, eliminate conflicting responsibility & relationships and harmonise & optimise practices, progressive companies have been adopting the concept of Integrated Management System (IMS) which is a merged system standard comprising ISO 9000, ISO 14000 & OHSAS 18000 specification. Products and Services • Sponge Iron • Quality • Power Generation • Customer support • Technology Raw Materials: The basic raw materials for the production of sponge iron • Iron Ore • Coal • Dolomite
- 5. FINANCIAL HIGHLIGHT (PARENT BASIS) (A*- Actual, E* -Estimations & Rs. In Millions) Balance Sheet as at March 31, 2013 -2016E TATA SPONGE IRON LTD FY13A FY14A FY15E FY16E SOURCES OF FUNDS Shareholder's Funds Share Capital 154.00 154.00 154.00 154.00 Reserves and Surplus 6240.66 7072.25 7991.13 8870.16 1. Sub Total - Net worth 6394.66 7226.25 8145.13 9024.16 Non Current Liabilities Deferred Tax Liabilities 298.04 218.14 183.24 161.25 Other Long term Liabilities 0.15 0.00 0.00 0.00 Long term Provisions 54.49 46.61 49.78 52.27 2. Sub Total - Non Current Liabilities 352.68 264.75 233.02 213.52 Current Liabilities Trade Payables 507.07 540.45 567.47 590.17 Other Current Liabilities 368.18 668.83 802.60 931.01 Short Term Provisions 525.77 592.92 640.35 672.37 3. Sub Total - Current Liabilities 1401.02 1802.20 2010.42 2193.55 Total Liabilities (1+2+3) 8148.35 9293.20 10388.57 11431.23 APPLICATION OF FUNDS Non Current Assets Fixed Assets Tangible Assets 1615.14 1502.38 1577.50 1640.60 Intangible Assets 1.27 0.61 0.67 0.74 Capital work-in-progress 156.46 162.50 170.62 180.86 a) Sub Total - Total Fixed Assets 1772.87 1665.49 1748.79 1822.19 b) Non-current investments 8.60 18.60 21.95 25.24 c) Long Term loans and advances 1708.21 1780.88 1869.92 1944.72 d) Other non-current assets 0.16 0.25 0.29 0.32 1. Sub Total - Non Current Assets 3489.83 3465.21 3640.95 3792.47 Current Assets Current Investments 1268.30 2027.00 2454.74 2847.50 Inventories 586.38 618.54 668.02 711.70 Trade receivables 203.58 260.75 318.12 375.38 Cash and Bank Balances 2344.82 2693.00 3043.09 3408.26 Short-terms loans & advances 209.84 166.15 186.09 202.84 Other current assets 45.60 62.56 77.57 93.09 2. Sub Total - Current Assets 4658.52 5827.99 6747.63 7638.76 Total Assets (1+2) 8148.35 9293.20 10388.57 11431.23
- 6. Annual Profit & Loss Statement for the period of 2013 to 2016E Value(Rs.in.mn) FY13A FY14A FY15E FY16E Description 15m 12m 12m 12m Net Sales 7957.60 7822.20 8839.09 9722.99 Other Income 315.60 354.50 379.32 394.49 Total Income 8273.20 8176.70 9218.40 10117.48 Expenditure -6756.30 -6368.90 -6660.25 -7389.48 Operating Profit 1516.90 1807.80 2558.15 2728.01 Interest -79.10 -132.20 -142.78 -151.34 Gross profit 1437.80 1675.60 2415.37 2576.66 Depreciation -178.80 -177.50 -166.85 -175.19 Profit Before Tax 1259.00 1498.10 2248.52 2401.47 Tax -404.70 -486.20 -730.77 -778.08 Net Profit 854.30 1011.90 1517.75 1623.39 Equity capital 154.00 154.00 154.00 154.00 Reserves 6240.66 7071.80 7991.13 8870.16 Face value 10.00 10.00 10.00 10.00 EPS 55.47 65.71 98.56 105.42 Quarterly Profit & Loss Statement for the period of 31 DEC, 2013 to 30 SEP, 2014E Value(Rs.in.mn) 31-Dec-13 31-Mar-14 30-Jun-14 30-Sep-14E Description 3m 3m 3m 3m Net sales 1984.20 2365.60 2031.20 2173.38 Other income 87.30 97.50 104.60 108.78 Total Income 2071.50 2463.10 2135.80 2282.17 Expenditure -1581.30 -1772.70 -1450.70 -1637.64 Operating profit 490.20 690.40 685.10 644.52 Interest -88.30 -34.40 -8.30 -8.63 Gross profit 401.90 656.00 676.80 635.89 Depreciation -44.60 -43.70 -27.60 -30.64 Profit Before Tax 357.30 612.30 649.20 605.26 Tax -114.20 -207.30 -206.40 -196.71 Net Profit 243.10 405.00 442.80 408.55 Equity capital 154.00 154.00 154.00 154.00 Face value 10.00 10.00 10.00 10.00 EPS 15.79 26.30 28.75 26.53
- 7. Ratio Analysis Particulars FY13A FY14A FY15E FY16E EPS (Rs.) 55.47 65.71 98.56 105.42 EBITDA Margin (%) 19.06% 23.11% 28.94% 28.06% PBT Margin (%) 15.82% 19.15% 25.44% 24.70% PAT Margin (%) 10.74% 12.94% 17.17% 16.70% P/E Ratio (x) 12.74 10.76 7.17 6.71 ROE (%) 13.36% 14.00% 18.63% 17.99% ROCE (%) 26.52% 27.48% 33.46% 32.17% EV/EBITDA (x) 4.80 3.41 2.11 1.70 Book Value (Rs.) 415.24 469.21 528.90 585.98 P/BV 1.70 1.51 1.34 1.21 Charts
- 8. OUTLOOK AND CONCLUSION At the current market price of Rs.707.00, the stock P/E ratio is at 7.17 x FY15E and 6.71 x FY16E respectively. Earning per share (EPS) of the company for the earnings for FY15E and FY16E is seen at Rs. 98.56 and Rs. 105.42 respectively. Net Sales and PAT of the company are expected to grow at a CAGR of 7% and 24% over 2013 to 2016E respectively. On the basis of EV/EBITDA, the stock trades at 2.11 x for FY15E and 1.70 x for FY16E. Price to Book Value of the stock is expected to be at 1.34 x and 1.21x respectively for FY15E and FY16E. We recommend ‘BUY’ in this particular scrip with a target price of Rs. 790.00 for Medium to Long term investment. INDUSTRY OVERVIEW India has become the second best in terms of growth amongst the top ten steel producing countries in the world and a net exporter of steel during 2013–14. Steel production in India recorded a growth rate of 4.8 per cent in February 2014 over February 2013. The cumulative growth during April–February, 2013–14 stood at 4.2 per cent over the corresponding period of the previous year. Steel contributes to nearly two per cent of the gross domestic product (GDP) and employs over 500,000 people. The total market value of the Indian steel sector stood at US$ 57.8 billion in 2011 and is expected to touch US$ 95.3 billion by 2016. The infrastructure sector is India’s largest steel consumer, thereby attracting investments from several global players. Owing to this connection with core infrastructure segments of the economy, the steel industry is of high priority right now. Also, steel demand is derived from other sectors like automobiles, consumer durables and infrastructure; therefore, its fortune is dependent on the growth of these user industries. The liberalisations of the industrial policy and other government initiatives have given a definite impetus for entry, participation and growth of the private sector in the steel industry. Allowing foreign direct investment (FDI) has been a positive step since India is heavily dependent on foreign technologies. These foreign technologies generally add life to the plant and production units, which ultimately lead to the country’s economic growth.
- 9. Market Size India’s real consumption of total finished steel grew by 0.6 per cent year-on-year in April–March 2013-14 to 73.93 million tonnes (MT). Construction sector accounts for around 60 per cent of the country's total steel demand while the automobile industry consumes 15 per cent. India became net steel exporter in 2013–14 and is likely to maintain the momentum in 2014-15 as producers are looking to dock more overseas shipment to tide over subdued domestic consumption. Total steel exports by India during 2013–14 stood at 5.59 MT, as against imports of 5.44 MT. During the period, Steel Authority of India (SAIL) clocked a 30 per cent growth in exports and aims to more than double the shipments to 1 MT in 2014–15. Rashtriya Ispat Nigam Ltd (RINL), which exported 1 lakh tonne steel last fiscal, aims to treble that in the current fiscal. Iron ore export from India has showed a 253 per cent increase during the period October–December 2013, at 3.75 MT as against 1.06 MT in the corresponding period of the previous year, on the back of the opening of new mines in Chhattisgarh, Madhya Pradesh and Rajasthan. Investments India needs investment of US$ 210 billion over the next decade to achieve the steel production capacity of 300 million tonnes per annum (MTPA) by 2025 from the current 90 MT. Some of the major investments in the sector are as follows: • India's third-largest steel maker, JSW Steel, plans to purchase Welspun Maxsteel for about Rs 1,000 crore (US$ 165.32 million). The acquisition will help JSW secure continuous supply of cheaper raw material as it plans to expand its capacity at Dolvi, Maharashtra, to 5 MT to supply in the western and northern markets. • Prize Petroleum, a wholly-owned subsidiary of Hindustan Petroleum Corporation Ltd (HPCL), has acquired stakes in two Australian hydrocarbon fields for A$ 85 million (US$ 79.27 million). The company has entered into an agreement with Sydney-based AWE Ltd to acquire 11.25 per cent stake in T/L1 area and 9.75 per cent interest in T/18P area. • McNally Bharat Engineering Co Ltd has entered Russia for the first time through a subsidiary, MBE Coal & Minerals Technologies GMBH. It received an order worth €5.95 million (US$ 8.21 million) from Eurochem Group of Russia for an iron ore mining project. • Canada has invited Coal India Ltd (CIL) to explore mining opportunities in British Columbia, Canada. Mr. Stewart Beck, Canadian High Commissioner met with Mr. N Kumar, Director (Technical) of Coal India Ltd, to
- 10. seek investments for coal assets in the Canadian province. CIL currently holds interests in two assets in Mozambique acquired through a concession agreement between the African and Indian governments. Government Initiatives The Government of India has allowed 100 per cent FDI through the automatic route in the Indian steel sector. It has significantly reduced the duty payable on finished steel products and has streamlined the associated approval process. In order to provide thrust on research and development (R&D), the Ministry of Steel is encouraging R&D activities both in public and private steel sectors, by providing financial assistance from Steel Development Fund (SDF) and Plan Scheme of the Central Government. Under the SDF scheme, 82 R&D projects have been approved with total project cost of Rs 677 crore (US$ 111.92 million) wherein SDF assistance is Rs 370 crore (US$ 61.17 million). Under the Plan Scheme, eight projects were approved with a total cost of Rs 123.27 crore (US$ 20.38 million) wherein Government assistance is Rs 87.28 crore (US$ 14.43 million). To encourage beneficiation and pelletisation of iron ore fines in the country, basic customs duty on the plants and equipment required for initial setting up or substantial expansion of iron ore pellets plants and iron ore beneficiation plants has been reduced from 7.5 per cent to 2.5 per cent. Import of critical raw materials for steel industry, such as coking coal, non-coking coal and scrap are subject to zero or very low levels of custom duty. Road Ahead The future of the Indian steel industry is bright. The government plans to increase infrastructure spending from the current 5 per cent GDP to 10 per cent by 2017, and the country is committed to investing US$ 1 trillion in infrastructure during the 12th Five-Year plan. “Taking 15 per cent as steel component in the total investment, then it can generate additional demand worth US$ 75 billion of steel in the next few years or US$ 15 billion worth of additional demand a year or in terms of quantity, an additional demand of 18.75 MT per annum,”. Disclaimer: This document prepared by our research analysts does not constitute an offer or solicitation for the purchase or sale of any financial instrument or as an official confirmation of any transaction. The information contained herein is from publicly available data or other sources believed to be reliable but do not represent that it is accurate or complete and it should not be relied on as such. Firstcall India Equity Advisors Pvt. Ltd. or any of it’s affiliates shall not be in any way responsible for any loss or damage that may arise to any person from any inadvertent error in the information contained in this report. This document is provide for assistance only and is not intended to be and must not alone be taken as the basis for an investment decision.
- 11. Firstcall India Equity Research: Email – info@firstcallindia.com C.V.S.L.Kameswari Pharma U. Janaki Rao Capital Goods B. Anil Kumar Auto, IT & FMCG M. Vinayak Rao Diversified C. Bhagya Lakshmi Diversified B. Vasanthi Diversified Firstcall India also provides Firstcall India Equity Advisors Pvt.Ltd focuses on, IPO’s, QIP’s, F.P.O’s,Takeover Offers, Offer for Sale and Buy Back Offerings. Corporate Finance Offerings include Foreign Currency Loan Syndications, Placement of Equity / Debt with multilateral organizations, Short Term Funds Management Debt & Equity, Working Capital Limits, Equity & Debt Syndications and Structured Deals. Corporate Advisory Offerings include Mergers & Acquisitions(domestic and cross-border), divestitures, spin-offs, valuation of business, corporate restructuring-Capital and Debt, Turnkey Corporate Revival – Planning & Execution, Project Financing, Venture capital, Private Equity and Financial Joint Ventures Firstcall India also provides Financial Advisory services with respect to raising of capital through FCCBs, GDRs, ADRs and listing of the same on International Stock Exchanges namely AIMs, Luxembourg, Singapore Stock Exchanges and other international stock exchanges. For Further Details Contact: 3rd Floor,Sankalp,The Bureau,Dr.R.C.Marg,Chembur,Mumbai 400 071 Tel. : 022-2527 2510/2527 6077/25276089 Telefax : 022-25276089 E-mail: info@firstcallindiaequity.com www.firstcallindiaequity.com