USDINR: Sell below 60.60 - Way2wealth
•
1 j'aime•320 vues

It can be seen from the daily chart that the pair has a multiple supports between 60.65 – 60.53 levels. Hence a move above immediate resistance of 61 can strengthen the pair to test 61.40 to 61.60 levels in the coming week. On the flipside, breach of 60.53 level might prompt further selling towards 60. Action: Sell below 60.60

Recommandé
Recommandé
Contenu connexe
En vedette
En vedette (16)
Plus de IndiaNotes.com
Plus de IndiaNotes.com (20)
Dernier
Dernier (20)
USDINR: Sell below 60.60 - Way2wealth
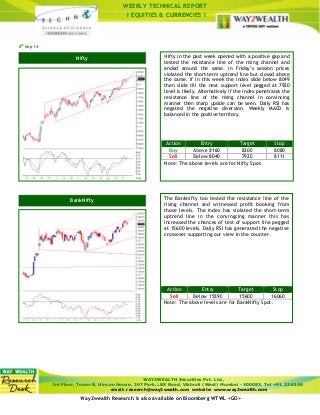
- 1. WEEKLY TECHNICAL REPORT I EQUITIES & CURRENCIES I Nifty in the past week opened with a positive gap and tested the resistance line of the rising channel and ended around the same. In Friday’s session prices violated the short-term uptrend line but closed above the same. If in this week the index slide below 8049 then slide till the next support level pegged at 7920 level is likely. Alternatively if the index penetrates the resistance line of the rising channel in convincing manner then sharp upside can be seen. Daily RSI has negated the negative diversion. Weekly MACD is balanced in the positive territory. Action Entry Target Stop Buy Above 8160 8300 8080 Sell Below 8040 7920 8111 Note: The above levels are for Nifty Spot. WAY2WEALTH Securities Pvt. Ltd., Nifty BankNifty 3rd Floor, Tower B, Hincon House, 247 Park, LBS Road, Vikhroli (West) Mumbai - 400083. Tel +91 22 6146 email: research@way2wealth.com website: www.way2wealth.com Way2wealth Research is also available on Bloomberg WTWL <GO> 8th Sep 14 The Banknifty too tested the resistance line of the rising channel and witnessed profit booking from those levels. The index has violated the short-term uptrend line in the convingcing manner this has increased the chances of test of support line pegged at 15600 levels. Daily RSI has generated the negative crossover supporting our view in the counter. Action Entry Target Stop Sell Below 15890 15600 16060 Note: The above levels are for BankNifty Spot.
- 2. WEEKLY TECHNICAL REPORT I EQUITIES & CURRENCIES I The stock future tested the long term flat support line on the weekly chart and ended the day with the hammer candlestick pattern. Daily RSI is valued at 29 in the oversold zone. Above all technical observations are indicating some bounce from current levels. Action Entry Target Stop Buy Above 113 124 107 The stock future has completed the bullish head and shoulders chart pattern on the weekly. Prices penetrated the rising neckline resistance but failed to close above the same. If in the upcoming sessions prices surpass the previous week’s high then swift run up is likely. Conservative price target according to the chart pattern is at 460 levels. Weekly MACD has given the positive crossover in the positive territory which is a bullish sign. Action Entry Target Stop Buy Above 400 460 369 WAY2WEALTH Securities Pvt. Ltd., RCOM Future IOC Future 3rd Floor, Tower B, Hincon House, 247 Park, LBS Road, Vikhroli (West) Mumbai - 400083. Tel +91 22 6146 2900 email: research@way2wealth.com website: www.way2wealth.com Way2wealth Research is also available on Bloomberg WTWL <GO>
- 3. WEEKLY TECHNICAL REPORT I EQUITIES & CURRENCIES I WAY2WEALTH Securities Pvt. Ltd., IRB Future 3rd Floor, Tower B, Hincon House, 247 Park, LBS Road, Vikhroli (West) Mumbai - 400083. Tel +91 22 6146 2900 email: research@way2wealth.com website: www.way2wealth.com Way2wealth Research is also available on Bloomberg WTWL <GO> = The stock future has provided the breakout from the symmetrical triangle chart pattern on the daily chart after a consolidation of 45 days. Height of the triangle is of 45 points and adding the same to the breakout point i.e. 260 provides us the price target of 305. Daily RSI is in line with the price structure. Action Entry Target Stop Buy Around 265 305 249
- 4. WEEKLY TECHNICAL REPORT I EQUITIES & CURRENCIES I Currencies USDINR (60.68) Yet again throughout the week USDINR remained sideways to negative during most of the session. Despite selling pressure in other currency pairs USDINR managed to sustain above its crucial support of 60.53. This was mainly due to muscular rally in the dollar index. Now at this stage, it can be seen from the daily chart that the pair has a multiple supports between 60.65 – 60.53 levels. Hence a move above immediate resistance of 61 can strengthen the pair to test 61.40 to 61.60 levels in the coming week. On the flipside, breach of 60.53 level might prompt further selling towards 60. JPYINR (57.71) The pair traded with negative bias throughout the week and even breached the support of 58.50. The fall was so sharp that JPYINR lost almost 2% during this period and is trading below 58 mark. Now the daily and hourly chart of the pair seems a bit exhausted and thus a bounce from current levels cannot be ruled out. In such scenario, 57.82 and 58.50 are likely to remain strong resistance for the coming sessions. However, in case of further downside 57.50 – 56.80 could act as the decent support for the pair. GBPINR (98.95) Surprisingly, instead of crossing an upside trigger of 101.22 level, the pair collapsed during the week registering a fall of almost 2%. This was mainly because of outcome from ECB meet and concerns in the euro region. As a result the pair breached the support of 100 and is now trading near 99 mark. The breakdown on the daily and weekly chart indicates that going forward the strategy should be ‘Sell on Rise’ for GBPINR. In case of further downside, the pair might drift towards 98 mark whereas in case of any bounce 100 & 101 levels will remain strong resistance for the coming weeks. Action Entry Target Stop Loss USDINR Sell Below 60.60 60 60.90 JPYINR Buy Above 57.85 58.50 57.57 GBPINR Sell Around 100 98 101 WAY2WEALTH Securities Pvt. Ltd., 3rd Floor, Tower B, Hincon House, 247 Park, LBS Road, Vikhroli (West) Mumbai - 400083. Tel +91 22 6146 email: research@way2wealth.com website: www.way2wealth.com Way2wealth Research is also available on Bloomberg WTWL <GO>
- 5. WEEKLY TECHNICAL REPORT I EQUITIES & CURRENCIES I WAY2WEALTH Securities Pvt. Ltd., 3rd Floor, Tower B, Hincon House, 247 Park, LBS Road, Vikhroli (West) Mumbai - 400083. Tel +91 22 6146 2900 email: research@way2wealth.com website: www.way2wealth.com Way2wealth Research is also available on Bloomberg WTWL <GO> DISCLAIMER The contents of this material are general and are neither comprehensive nor appropriate for every individual and are solely for the informational purposes of the readers. This material does not take into account the specific investment objectives, financial situation or needs of an individual/s or a Corporate/s or any entity/s. A qualified professional should be consulted before making an investment decisions or acting on any information contained in this material. All investments involve risk and past performance does not guarantee future results. Investigate before you invest. You are strongly cautioned to verify any information before using it for any personal or business purpose. Way2wealth Brokers (P) Limited (herein after called Way2Wealth) does not guarantee the accuracy, quality or completeness of any information. Much of the information is relevant only in India. Way2wealth makes no warranties, either express or implied, including, but not limited to warranties of suitability, fitness for a particular purpose, accuracy, timeliness, completeness or non-infringement. In no event shall Way2Wealth be liable for any damages of any kind, including, but not limited to, indirect, special, incidental, consequential, punitive, lost profits, or lost opportunity, whether or not Way2Wealth has advised of the possibility of such damages. This material contains statements that are forward-looking; such statements are based upon the current beliefs and expectations and are subject to significant risks and uncertainties. Actual results may differ from those set forth in the forward-looking statements. These uncertainties include but are not limited to: the risk of adverse movements or volatility in the securities markets or in interest or foreign exchange rates or indices; adverse impact from an economic slowdown; downturn in domestic or foreign securities and trading conditions or markets; increased competition; unfavorable political and diplomatic developments; change in the governmental or regulatory policies; failure of a corporate event and such others. This is not an offer to buy or sell or a solicitation of an offer to buy or sell any security or instrument or to participate in any particular trading strategy. No part of this material may be copied or duplicated in any form by any means or redistributed without the written consent of Way2Wealth. In no event shall any reader publish, retransmit, redistribute or otherwise reproduce any information provided by Way2Wealth in any format to anyone. Way2Wealth and its affiliates, officers, directors and employees including persons involved in the preparation or issuance of this report may from time to time have interest in securities thereof, of companies mentioned herein.