Midmarket Analytics in North America: Transforming Data into IAnsight
•
0 j'aime•344 vues

For mid-sized organizations, business analytics offers the crucial ability to transform data into insight and uncover opportunities for growth and competitive advantage. Specifically in North America, where the U.S. and Canada have long been global early adopters of technology, companies in this region have helped pave the way for the diverse IT backbone that supports our global business climate.

Recommandé
Recommandé
Contenu connexe
En vedette
En vedette (20)
Midmarket Analytics in North America: Transforming Data into IAnsight
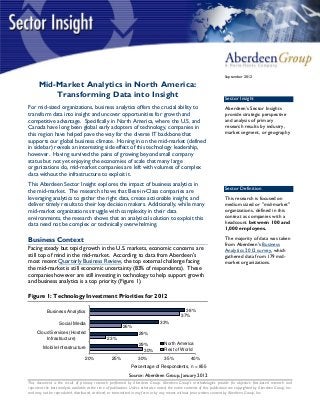
- 1. September 2012 Mid-Market Analytics in North America: Transforming Data into Insight Sector Insight For mid-sized organizations, business analytics offers the crucial ability to Aberdeen’s Sector Insights transform data into insight and uncover opportunities for growth and provide strategic perspective competitive advantage. Specifically in North America, where the U.S. and and analysis of primary Canada have long been global early adopters of technology, companies in research results by industry, this region have helped pave the way for the diverse IT backbone that market segment, or geography supports our global business climate. Honing in on the mid-market (defined in sidebar) reveals an interesting side effect of this technology leadership, however. Having survived the pains of growing beyond small company status but not yet enjoying the economies of scale that many large organizations do, mid-market companies are left with volumes of complex data without the infrastructure to exploit it. This Aberdeen Sector Insight explores the impact of business analytics in Sector Definition the mid-market. The research shows that Best-in-Class companies are leveraging analytics to gather the right data, create actionable insight, and This research is focused on deliver timely results to their key decision makers. Additionally, while many medium sized or "mid-market" mid-market organizations struggle with complexity in their data organizations, defined in this environments, the research shows that an analytical solution to exploit this context as companies with a data need not be complex or technically overwhelming. headcount between 100 and 1,000 employees. Business Context The majority of data was taken from Aberdeen's Business Facing steady but tepid growth in the U.S. markets, economic concerns are Analytics 2012 survey, which still top of mind in the mid-market. According to data from Aberdeen's gathered data from 179 mid- most recent Quarterly Business Review, the top external challenge facing market organizations. the mid-market is still economic uncertainty (83% of respondents). These companies however are still investing in technology to help support growth and business analytics is a top priority (Figure 1). Figure 1: Technology Investment Priorities for 2012 Business Analytics 38% 37% Social Media 33% 26% Cloud Services (Hosted 29% Infrastructure) 23% 29% North America Mobile Infrastructure Rest of World 30% 20% 25% 30% 35% 40% Percentage of Respondents, n = 855 Source: Aberdeen Group, January 2012 This document is the result of primary research performed by Aberdeen Group. Aberdeen Group's methodologies provide for objective fact-based research and represent the best analysis available at the time of publication. Unless otherwise noted, the entire contents of this publication are copyrighted by Aberdeen Group, Inc. and may not be reproduced, distributed, archived, or transmitted in any form or by any means without prior written consent by Aberdeen Group, Inc.
- 2. Mid-Market Analytics in North America Page 2 Part of the reason for the high priority on business analytics is related to the Fast Facts data environment for these North American companies. According to Aberdeen's Business Analytics 2012 survey, two of the top pressures driving Top pressures driving the need for business analytics*: the need for analytics were related to the complexity and quality of data (see sidebar). Additionally, the data shows that these companies are seeing √ Too many business decisions a larger influx of sheer data volume (Figure 2). are based on inaccurate / incomplete data - 51% Figure 2: Data Challenges Abound in North America √ Data is too fragmented / "siloed" to develop a clear 75% picture of the business - 29% Percentage of Respondents Percentage of Respondents 40% 72% 40% √ Lack of operational visibility 34% 66% causing inefficiency - 28% 65% 30% * - Mid-market companies in North America, percentage of respondents 20% 55% Average Y/Y growth in data Average percentage of data used for analysis that is complete & up to date North America Rest of World n = 179 Source: Aberdeen Group, February 2012 Compounding the challenge of volume and complexity is the issue of quality. Data that is old, corrupted, or just plain absent presents a challenge for any organization looking to generate business insight. North American companies face an additional challenge with the usability and quality of their data as depicted above. Effective Analytics Knows No Borders Aberdeen's Maturity Class Across regions, industries, and cultures, implementing a strategy for analytics or business intelligence (BI) and realizing tangible business value is Aberdeen divides survey predicated on far more than simply investing in technology. A well- respondents into three functioning analytical environment is one where the business users are maturity classes based on their self-reported performance actively involved in creating insight, where information is delivered in time across several key metrics: to positively impact decisions, and where the most crucial business processes are tightly measured, managed, and continuously improved. With √ Best-in-Class: Top 20% of these concepts in mind, Aberdeen used the following three metrics to respondents based on distinguish between Best-in-Class, Average, and Laggard organizations in the performance mid-market (framework depicted in sidebar). √ Industry Average: Middle 50% of respondents based • Analytical Engagement: Measured as the average percentage of on performance business users that actively engage with business analytics at least once a week √ Laggard: Bottom 30% of respondents based on • Timeliness of Information: Measured as an average percentage performance of actionable information delivered on-time, or within the so-called "decision window" (see sidebar) © 2011 Aberdeen Group. Telephone: 617 854 5200 www.aberdeen.com Fax: 617 723 7897
- 3. Mid-Market Analytics in North America Page 3 • Process Efficiency: Measured as a percentage of organizations Aberdeen Definitions within each maturity class that drove a year over year "improvement" or "substantial improvement" in the cycle times of In the context of this research, their most crucial business processes the decision window is defined as the period of time Based on self-reported performance across these metrics, Aberdeen's three during which the presence of maturity classes were defined by the data shown below in Table 1. actionable information can impact a business decision. Table 1: Top Performers Earn Best-in-Class Status Survey respondents were asked Definition of to define their own decision Mean Class Performance window; the breakdown for all Maturity Class participating mid-market Best-in-Class: 62% of users are actively engaged with business analytics companies was as follows*: Top 20% 89% of critical information is available "on-time" √ Real / near real-time: 14% of aggregate performance scorers 73% of companies improved process efficiency √ Within the hour: 13% Industry Average: 27% of users are actively engaged with business analytics Middle 50% √ Within the day: 36% 75% of critical information is available "on-time" of aggregate √ Within the week: 24% performance scorers 54% of companies improved process efficiency √ Within the month or longer: Laggard: 8% of users are actively engaged with business analytics 13% Bottom 30% 32% of critical information is available "on-time" of aggregate * Percentage of Respondents performance scorers 27% of companies improved process efficiency Source: Aberdeen Group, February 2012 Best-in-Class Strategies In an effort to address their top business pressures and execute against a growing need for analytics, Best-in-Class companies employ a variety of strategies ranging from more formalized data management to driving more pervasive analytical culture across the organization. Far and away the top priority for Best-in-Class companies, though, is their effort to build a self- service environment for business analytics (Figure 3). Figure 3: Top Actions to Support Business Analytics Enable business users to be more self- 52% sufficient with analytics 30% Deliver analytical capability to more 36% operational business functions 36% Formalize and centralize approach to 27% analytical projects 33% 0% 20% 40% 60% Best-in-Class All Others Percentage of Respondents, n = 179 Source: Aberdeen Group, February 2012 © 2011 Aberdeen Group. Telephone: 617 854 5200 www.aberdeen.com Fax: 617 723 7897
- 4. Mid-Market Analytics in North America Page 4 While other actions are elemental to a Best-in-Class strategy, these top performers distinguish themselves most in regards to self-service analytics. In the world of business analytics, reducing reliance on IT and making business users more self-sufficient creates a wave of positive impact in two main areas. First, without a constant flood of low-level requests from business users to make minor alterations to reports and views, IT resources can be repurposed to focus on activities more strategic to the business such as ensuring the reliability of the infrastructure and creating a more accessible data environment. Second, with self-service access to analytical capability, business users across multiple functions within the organization (e.g. finance, sales, marketing) are able to ask better questions of their data and magnify the business impact of analytics. Anatomy of a Best-in-Class Company Aberdeen's research has long supported the notion that effective business analytics is born out of execution in one or more of three areas of activity: • Data capture and optimization • Assembly of information into actionable insight • Delivery or dissemination of business insight However, the ability to leverage business analytics for faster and more informed decisions is not predicated upon a simultaneous focus in all three areas. Mid-market companies don't need to invest exhaustively in data management technologies to derive insight from its analysis. Nor is extensive domain expertise a prerequisite for driving a tangible return on investment (ROI) from business analytics. Best-in-Class companies start by demonstrating organizational maturity with several internal capabilities related to these three main aspects of business analytics (Figure 4). Figure 4: Best-in-Class Internal Capabilities 79% Percentage of Respondents 80% 70% 70% 60% 43% 45% 40% 36% 36% 35% 29% 20% 0% Central repository of Standard process for Established financial & operational defining and performance-driven performance data communicating KPI information culture Best-in-Class Industry Average Laggard n = 179 Source: Aberdeen Group, February 2012 On the data side, Best-in-Class companies are almost twice as likely as all others to create a central repository of performance data in order to measure, manage, and improve the metrics most critical for driving business © 2011 Aberdeen Group. Telephone: 617 854 5200 www.aberdeen.com Fax: 617 723 7897
- 5. Mid-Market Analytics in North America Page 5 growth. Having a standard process in place to define and communicate those metrics is also a key element of creating business insight. Additionally, the Best-in-Class are more than twice as likely as all others to report a performance driven culture that values the timely delivery of actionable information. These capabilities used in concert help form the foundation of a holistic strategy for business analytics, ultimately supporting the performance described in Table 1. Additionally, from a technology standpoint Best-in-Class companies are utilizing the right tools to facilitate efficiency when it comes to data optimization, information assembly, and insight delivery (Figure 5). Figure 5: Putting the Right Tools in Place Percentage of Respondents 75% 67% 70% 59% 50% 47% 39% 42% 31% 33% 30% 25% 0% Data management / data Query tools for data Operational / tactical quality technology exploration & discovery dashboards Best-in-Class Industry Average Laggard n = 179 Source: Aberdeen Group, February 2012 Data quality tools help ensure the foundation for effective business analytics. Mitigating the amount of corrupted, outdated, or simply incorrect data allows for a cleaner input into the process of data transformation inherent in any analytical environment. Best-in-Class companies are also more likely to utilize data discovery tools to help their business users ask questions of and explore data, and ultimately create their own personalized version of business insight. This enables business users to apply their own domain specific knowledge to their analysis and deliver results that are more actionable and have a greater potential of affecting business performance. Finally, the use of tactical or operational dashboards is a powerful way to render business insight in a relevant and meaningful way to business users. By displaying key metrics and data views on a day-to-day operational basis (often times even near real-time), top mid-market companies are enabling business users to become more inquisitive about their business and develop the answers they need to facilitate more effective decisions. Conclusion & Recommendations In a world consumed with information in all its many forms, companies are rewarded for their ability to transform raw data into actionable business insight and deliver it to their decision makers in a timely fashion. The mid- © 2011 Aberdeen Group. Telephone: 617 854 5200 www.aberdeen.com Fax: 617 723 7897
- 6. Mid-Market Analytics in North America Page 6 market is an important economic engine within North America and will help shape the future of our business landscape. As such, mid-size companies that embrace the analytical methodology are better positioned for more effective decisions, enhanced business performance, and entry into the next generation of enterprise-level organizations. The issues specific to North America relate largely to the complexity and disparity of their data environments. In addition to the growth in data volume discussed above, Aberdeen's January 2012 research on Data Management demonstrated that mid-market organizations were struggling to manage and average of 12 unique data sources. Best-in-Class companies use this data to their advantage within their strategy for business analytics and are able to extract usable business insight. For mid-market companies seeking a more effective analytical environment, the following recommendations should be taken into consideration: • Start by focusing on the data. While the challenges of data volume and complexity are borderless, Figure 2 demonstrated that North American companies are seeing a particularly sizeable influx of data. Best-in-Class companies in the mid-market are more likely to think strategically about their data environment by identifying their most critical data sources, ensuring their quality and viability, and improving their accessibility across the organization. This more manageable and usable foundation of data is what sets the stage for more effective analytical activity against that data. • Build the analytical mindset, don't be overwhelmed by technology. Business analytics is just as much a philosophy as it is a technology. Aberdeen's research continually shows a correlation between active engagement in analytical activity and enhanced business performance. Best-in-Class companies are more than twice as likely to report an ingrained culture of curiosity that values data-driven decisions and encourages exploration of business data. These mid-market leaders rely on this culture to drive adoption and engagement in their analytical solutions, not only leading to enhanced business performance, but a higher return on investment in business analytics as well. • When expanding analytics, fill the need… and the want. Prior Aberdeen research on the total cost of ownership (TCO) of BI demonstrates how building adoption and engagement with analytics leads to a lower total cost of ownership and a higher ROI. The first logical step toward this adoption is by enabling the users with the most direct need for analytics, be it Sales, Marketing, Finance, or other areas. However, taking it a step further involves delivering analytical capability to the users with the greatest creative urge to ask questions of their business and perform their own analysis. While budgets are finite, as are IT resources, the users willing and able to get creative with their own application of business analytics are the ones most likely to uncover vital hidden © 2011 Aberdeen Group. Telephone: 617 854 5200 www.aberdeen.com Fax: 617 723 7897
- 7. Mid-Market Analytics in North America Page 7 insights in the data and leverage those insights to boost business performance. For more information on this or other research topics, please visit www.aberdeen.com. Related Research Managing the TCO of BI: The Path to Beyond Agile Analytics: Is Agile Data ROI is Paved with Adoption; May 2012 Integration Next?; May 2012 Embedded BI: Boosting Analytical 2012 Strategies: Putting the Intelligence in Adoption and Engagement; March 2012 Mobile BI to Work; January 2012 BI in the SMB Market: Delivering The Analytical SMB: More Data, More Measurable Business Results; July 2011 Users, Less Time; November 2011 Author: Michael Lock, Research Director & Group Leader, Technology Markets (michael.lock@aberdeen.com) For more than two decades, Aberdeen's research has been helping corporations worldwide become Best-in-Class. Having benchmarked the performance of more than 644,000 companies, Aberdeen is uniquely positioned to provide organizations with the facts that matter — the facts that enable companies to get ahead and drive results. That's why our research is relied on by more than 2.5 million readers in over 40 countries, 90% of the Fortune 1,000, and 93% of the Technology 500. As a Harte-Hanks Company, Aberdeen’s research provides insight and analysis to the Harte-Hanks community of local, regional, national and international marketing executives. Combined, we help our customers leverage the power of insight to deliver innovative multichannel marketing programs that drive business-changing results. For additional information, visit Aberdeen http://www.aberdeen.com or call (617) 854-5200, or to learn more about Harte-Hanks, call (800) 456-9748 or go to http://www.harte-hanks.com. This document is the result of primary research performed by Aberdeen Group. Aberdeen Group's methodologies provide for objective fact-based research and represent the best analysis available at the time of publication. Unless otherwise noted, the entire contents of this publication are copyrighted by Aberdeen Group, Inc. and may not be reproduced, distributed, archived, or transmitted in any form or by any means without prior written consent by Aberdeen Group, Inc. (2011a) © 2011 Aberdeen Group. Telephone: 617 854 5200 www.aberdeen.com Fax: 617 723 7897