SlideShare une entreprise Scribd logo
1  sur  22
Télécharger pour lire hors ligne
U.S. employment situation: September 2013
Release date: October 22, 2013
Unemployment falls to 4.6 percent, while
growth is adjusting to a new normal
U.S. employment situation: November 2016 December 2, 2016
November 2016 employment summary
• November job growth was moderate, but consistent with H2 2016 levels
- The U.S. labor market added 178,000 net new jobs in November, consistent with monthly additions during the second half of 2016 but
below the year-to-date and 2015 averages. With the notable exception of professional and business services (PBS), slower growth affected
most sectors during November, keeping the composition of gains similar in both monthly and annual terms.
- Unemployment dropped by 30 basis points to a cyclical low of 4.6 percent on the back of consistent job growth and a slight decline in the
labor force participation rate to 62.7 percent. Total unemployment mirrored this trend, also declining by 20 basis points to 9.3 percent. At
the same time, initial unemployment claims continue to slide and now average roughly 252,000 per week, in line with mid-2000s levels.
• The civilian labor force is not expanding fast enough to keep job creation as fast as in 2015
- Labor-market tightening has become very visible at the national level as well as across metropolitan areas. A combination of falling
unemployment and job creation exceeding the rate of labor-force expansion will likely lead to a new normal for monthly growth. Annual
growth in the labor force totaled 1.3 percent in November compared to 1.6 percent for total non-farm employment, further thinning the
remaining slack.
- Demand for goods and services remains on the rise, as evidenced by job openings remaining at roughly 5.5 million and maintaining a 3.7-
percent opening rate. This will keep upward pressure on wages steady and above inflation, although the consumer price index is beginning
to rebound as energy demonstrates initial signs of recovery.
• Consistent growth and inflation approaching 2.0-percent target make Fed hike very likely
- Although growth figures are not at previous levels, they remain healthy enough for the overall labor market to continue heading in the right
direction in terms of demand for workers and wage growth. With inflation now at 1.6 percent and nearing the Federal Reserve’s 2.0-percent
target and unemployment at its lowest point since August 2007, the stage has been set for a rate hike by the end of the year.
Source: JLL Research, Bureau of Labor Statistics
2
November 2016 U.S. labor market at a glance
+178,000
(74 consecutive months
of growth)
1-month net change
+2,253,000
(+1.6% y-o-y)
12-month change
+785,000
10-year average annual growth
Source: JLL Research, Bureau of Labor Statistics
4.6%
Unemployment rate
-40bp
12-month change in unemployment
62.7%
Labor force participation rate
5,486,000
(3.7% rate)
Job openings
5,081,000
(3.5% rate)
Hires
3,070,000
(2.1% rate)
Quits
3
November growth slightly below 2016 average, but gains remain
healthy in light of minimal labor-market slack
360,000
226,000
243,000
96,000
110,000
88,000
106,000
122,000
221,000
183,000
164,000
196,000
360,000
226,000
243,000
96,000
110,000
88,000
160,000
150,000
161,000
225,000
203,000
214,000
197,000
280,000
141,000
203,000
199,000
201,000
149,000
202,000
164,000
237,000
274,000
84,000
166,000
188,000
225,000
330,000
236,000
286,000
249,000
213,000
250,000
221,000
423,000
329,000
221,000
265,000
84,000
251,000
273,000
228,000
277,000
150,000
149,000
295,000
280,000
262,000
168,000
233,000
186,000
277,000
24,000
271,000
252,000
176,000
208,000
142,000
178,000
0
50,000
100,000
150,000
200,000
250,000
300,000
350,000
400,000
450,000
2011
2012
2013
2014
2015
2016
1-monthnetchange
4
Source: JLL Research, Bureau of Labor Statistics
Consistent growth and a drop in participation pushed
unemployment to a cyclical low of 4.6 percent
0.0%
2.0%
4.0%
6.0%
8.0%
10.0%
12.0%
-1,000.0
-800.0
-600.0
-400.0
-200.0
0.0
200.0
400.0
600.0
Unemploymentrate(%)
1-monthnetchange(thousands)
Monthly employment change Unemployment rate
Source: JLL Research, Bureau of Labor Statistics
5
Job openings show little change at 5.5 million, but continue to
rise faster than employment at 3.7 percent annually
Source: JLL Research, Bureau of Labor Statistics
6
0
1,000
2,000
3,000
4,000
5,000
6,000
7,000
Jobopenings(thousands)
2.5%
2.7%
3.2%
3.3%
3.5%
3.9%
4.1%
4.3%
4.5%
4.9%
1.0% 1.5% 2.0% 2.5% 3.0% 3.5% 4.0% 4.5% 5.0% 5.5%
Mining and logging
Manufacturing
Construction
Information
Trade, transportation and utilities
Other services
Financial activities
Leisure and hospitality
Education and health
Professional and business services
Job openings rate
A healthy mix of office-using and non-office-using sectors is
seeing the fastest rate of job-opening growth
Source: JLL Research, Bureau of Labor Statistics
7
0
1,000
2,000
3,000
4,000
5,000
6,000
2007 2008 2009 2010 2011 2012 2013 2014 2015 2016
Hiresandquits(thousands)
Hires Quits
Hires levels have become more volatile, but the hiring rate
remains stable at 3.5-3.6 percent
Source: JLL Research, Bureau of Labor Statistics
Hourly wage growth fell back to 2.5 percent in November, while
rising inflation is beginning to eat away at gains
Source: JLL Research, Bureau of Labor Statistics – CPI data as of March 2016
9
-3.0%
-2.0%
-1.0%
0.0%
1.0%
2.0%
3.0%
4.0%
5.0%
6.0%
2008 2009 2010 2011 2012 2013 2014 2015 2016
12-month%change
Hourly wage growth CPI growth
0.0%
1.5%
1.9%
2.4%
2.4%
2.5%
2.6%
2.7%
4.1%
4.1%
0.0% 0.5% 1.0% 1.5% 2.0% 2.5% 3.0% 3.5% 4.0% 4.5%
Mining and logging
Education and health
Other services
Professional and business services
Construction
Trade, transportation and utilities
Manufacturing
Financial activities
Leisure and hospitality
Information
12-month % change in wages
Information and leisure back to recent levels of wage growth
(4.1 percent); education and mining continue to lag
Source: JLL Research, Bureau of Labor Statistics – office-using sectors in red
10
A slowdown in labor-force growth will keep employment from
reaching the gains seen in 2015 and early 2016
Source: JLL Research, Bureau of Labor Statistics
11
-6.0%
-5.0%
-4.0%
-3.0%
-2.0%
-1.0%
0.0%
1.0%
2.0%
3.0%
2008 2009 2010 2011 2012 2013 2014 2015 2016
12-month%change
Civilian labor force Total non-farm
After showing signs of growth, the labor force participation
rate declined by 10bp to 62.7 percent
Source: JLL Research, Bureau of Labor Statistics
12
60%
61%
62%
63%
64%
65%
66%
67%
2008 2009 2010 2011 2012 2013 2014 2015 2016
Laborforceparticipationrate(%)
-10.0
-8.3
-6.0
-4.0
-0.3
1.2
2.0
2.0
2.8
4.0
6.0
8.9
14.3
19.0
22.0
29.0
34.7
44.0
63.0
-20 -10 0 10 20 30 40 50 60 70
Information
Retail trade
Durable goods
Manufacturing
Utilities
Motor vehicles and parts
Nondurable goods
Mining and logging
Wholesale trade
Other services
Financial activities
Transportation and warehousing
Temporary help services
Construction
Government
Leisure and hospitality
Health care and social assistance
Education and health services
Professional and business services
1-month net change (thousands)
Countering slow growth or even contractions in key industries,
PBS returned to very healthy rates of increase in November
13
Source: JLL Research, Bureau of Labor Statistics
-89.0
-77.0
-54.0
2.4
12.1
15.0
23.0
52.2
60.6
63.1
74.0
153.0
155.0
217.0
222.6
293.0
492.1
571.0
581.0
-200 0 200 400 600 800
Mining and logging
Durable goods
Manufacturing
Utilities
Motor vehicles and parts
Information
Nondurable goods
Wholesale trade
Transportation and warehousing
Temporary help services
Other services
Financial activities
Construction
Government
Retail trade
Leisure and hospitality
Health care and social assistance
Professional and business services
Education and health services
12-month net change (thousands)
581.0
571.0
293.0
222.6
153.0
432.4
Education and health PBS
Leisure and hospitality Retail trade
Financial activities Manufacturing
All other jobs
With the slowdown in growth affecting most industries, there
has been little change in annual composition of gains
Source: JLL Research, Bureau of Labor Statistics
14
Core subsectors added 80.8 percent
of all jobs over the past 12 months.
0.0%
1.0%
2.0%
3.0%
4.0%
5.0%
6.0%
Unemploymentrateforbachelor’sdegreeholders(%)
Like the official unemployment rate, bachelor’s degree
unemployment fell again to a new cyclical low of 2.3 percent
Source: JLL Research, Bureau of Labor Statistics
15
A rebound in PBS in recent months is making up for downward
revisions to financial activities and information figures
-300
-250
-200
-150
-100
-50
0
50
100
150
200
2009 2010 2011 2012 2013 2014 2015 2016
1-monthnetchange(thousands)
Information Professional and business services Financial activities
Source: JLL Research, Bureau of Labor Statistics
16
The tech slowdown continued in November, with year-over-year
growth now at 4.3 percent; still 2.7x faster than total non-farm
-11.0
-9.0
-7.0
-5.0
-3.0
-1.0
1.0
3.0
5.0
7.0
9.0
2008 2009 2010 2011 2012 2013 2014 2015 2016
High-tech Energy, Mining, and Utilities Office-using industries Total non-farm
Source: JLL Research, Moody’s. Note: Due to data lags, high-tech employment only available through September 2016
17
12-month%change(jobs)
Initial unemployment claims remain on a slow but steady
downward trend and now average ~252,000 per week
Source: JLL Research, U.S. Department of Labor
18
200,000
250,000
300,000
350,000
400,000
450,000
500,000
550,000
600,000
650,000
700,000
Claims
Initial claims 4-week moving average
0
20
40
60
80
100
120
140
ConsumerconfidenceIndex
Consumer confidence rose considerably in November to 107.1
points, mirroring upward revisions to GDP and spending
Source: JLL Research, Conference Board
19
Florida remains the leader in local employment growth due to
cyclical volatility and diversified growth
Source: JLL Research, Bureau of Labor Statistics
20
Dallas
3.3%
Salt Lake
City
3.4%
Seattle-
Bellevue
3.7%
Orlando
4.0%
Denver
3.6%
As with the official unemployment rate, total unemployment
registered a 20-basis-point drop to 9.3 percent
6.0%
8.0%
10.0%
12.0%
14.0%
16.0%
18.0%
Totalunemployment(%)
Total unemployment U-6 10-year average
Source: JLL Research, Bureau of Labor Statistics
21
©2016 Jones Lang LaSalle Research IP, Inc. All rights reserved. All information contained herein is from sources deemed reliable; however, no representation or warranty is made to the accuracy thereof.
For more information, please contact:
Ben Breslau
Managing Director - Americas Research
Benjamin.Breslau@am.jll.com
Ryan Severino
Chief Economist - Americas Research
Ryan.Severino@am.jll.com
Phil Ryan
Senior Research Analyst – Office and Economy Research
Phil.Ryan@am.jll.com

Contenu connexe

En vedette

Visualizing the Bureau of Labor Statistics Employment Dataset
Visualizing the Bureau of Labor Statistics Employment DatasetVisualizing the Bureau of Labor Statistics Employment Dataset
Visualizing the Bureau of Labor Statistics Employment DatasetCurran Kelleher
 
Contextualizing Real-Time and Traditional Labor Market Data
Contextualizing Real-Time and Traditional Labor Market DataContextualizing Real-Time and Traditional Labor Market Data
Contextualizing Real-Time and Traditional Labor Market DataEMSI
 
What are companies planning for Workplace Strategy?
What are companies planning for Workplace Strategy?What are companies planning for Workplace Strategy?
What are companies planning for Workplace Strategy?JLL
 
October 2016 U.S. employment update and outlook
October 2016 U.S. employment update and outlookOctober 2016 U.S. employment update and outlook
October 2016 U.S. employment update and outlookJLL
 
November 2016 U.S. employment update and outlook
November 2016 U.S. employment update and outlookNovember 2016 U.S. employment update and outlook
November 2016 U.S. employment update and outlookJLL
 
How to start the workplace productivity conversation
How to start the workplace productivity conversationHow to start the workplace productivity conversation
How to start the workplace productivity conversationJLL
 
U.S. life sciences industry trends to watch
U.S. life sciences industry trends to watch U.S. life sciences industry trends to watch
U.S. life sciences industry trends to watch JLL
 
US employment rate data and trends – December 2016
US employment rate data and trends – December 2016 US employment rate data and trends – December 2016
US employment rate data and trends – December 2016 JLL
 
Pause the workplace debate: ask these 4 questions first
Pause the workplace debate: ask these 4 questions firstPause the workplace debate: ask these 4 questions first
Pause the workplace debate: ask these 4 questions firstJLL
 
US employment rate data and trends – January 2017
US employment rate data and trends – January 2017US employment rate data and trends – January 2017
US employment rate data and trends – January 2017JLL
 

En vedette (11)

Carlos a
Carlos aCarlos a
Carlos a
 
Visualizing the Bureau of Labor Statistics Employment Dataset
Visualizing the Bureau of Labor Statistics Employment DatasetVisualizing the Bureau of Labor Statistics Employment Dataset
Visualizing the Bureau of Labor Statistics Employment Dataset
 
Contextualizing Real-Time and Traditional Labor Market Data
Contextualizing Real-Time and Traditional Labor Market DataContextualizing Real-Time and Traditional Labor Market Data
Contextualizing Real-Time and Traditional Labor Market Data
 
What are companies planning for Workplace Strategy?
What are companies planning for Workplace Strategy?What are companies planning for Workplace Strategy?
What are companies planning for Workplace Strategy?
 
October 2016 U.S. employment update and outlook
October 2016 U.S. employment update and outlookOctober 2016 U.S. employment update and outlook
October 2016 U.S. employment update and outlook
 
November 2016 U.S. employment update and outlook
November 2016 U.S. employment update and outlookNovember 2016 U.S. employment update and outlook
November 2016 U.S. employment update and outlook
 
How to start the workplace productivity conversation
How to start the workplace productivity conversationHow to start the workplace productivity conversation
How to start the workplace productivity conversation
 
U.S. life sciences industry trends to watch
U.S. life sciences industry trends to watch U.S. life sciences industry trends to watch
U.S. life sciences industry trends to watch
 
US employment rate data and trends – December 2016
US employment rate data and trends – December 2016 US employment rate data and trends – December 2016
US employment rate data and trends – December 2016
 
Pause the workplace debate: ask these 4 questions first
Pause the workplace debate: ask these 4 questions firstPause the workplace debate: ask these 4 questions first
Pause the workplace debate: ask these 4 questions first
 
US employment rate data and trends – January 2017
US employment rate data and trends – January 2017US employment rate data and trends – January 2017
US employment rate data and trends – January 2017
 

Plus de JLL

September 2018 U.S. employment update and outlook
September 2018 U.S. employment update and outlookSeptember 2018 U.S. employment update and outlook
September 2018 U.S. employment update and outlookJLL
 
August 2018 U.S. employment update and outlook
August 2018 U.S. employment update and outlookAugust 2018 U.S. employment update and outlook
August 2018 U.S. employment update and outlookJLL
 
July 2018 U.S. employment update and outlook
July 2018 U.S. employment update and outlookJuly 2018 U.S. employment update and outlook
July 2018 U.S. employment update and outlookJLL
 
June 2018 U.S. employment update and outlook
June 2018 U.S. employment update and outlookJune 2018 U.S. employment update and outlook
June 2018 U.S. employment update and outlookJLL
 
May 2018 U.S. employment update and outlook
May 2018 U.S. employment update and outlookMay 2018 U.S. employment update and outlook
May 2018 U.S. employment update and outlookJLL
 
Capital Markets: Slicing the debt pie
Capital Markets: Slicing the debt pieCapital Markets: Slicing the debt pie
Capital Markets: Slicing the debt pieJLL
 
JLL Retail: Store closure summary, March 2018
JLL Retail: Store closure summary, March 2018JLL Retail: Store closure summary, March 2018
JLL Retail: Store closure summary, March 2018JLL
 
March 2018 U.S. employment update and outlook
March 2018 U.S. employment update and outlookMarch 2018 U.S. employment update and outlook
March 2018 U.S. employment update and outlookJLL
 
February 2018 U.S. employment update and outlook
February 2018 U.S. employment update and outlookFebruary 2018 U.S. employment update and outlook
February 2018 U.S. employment update and outlookJLL
 
January 2018 U.S. employment update and outlook
January 2018 U.S. employment update and outlookJanuary 2018 U.S. employment update and outlook
January 2018 U.S. employment update and outlookJLL
 
December 2017 U.S. employment update and outlook
December 2017 U.S. employment update and outlookDecember 2017 U.S. employment update and outlook
December 2017 U.S. employment update and outlookJLL
 
JLL London Office Market Seminar
JLL London Office Market SeminarJLL London Office Market Seminar
JLL London Office Market SeminarJLL
 
November 2017 U.S. employment update and outlook
November 2017 U.S. employment update and outlookNovember 2017 U.S. employment update and outlook
November 2017 U.S. employment update and outlookJLL
 
Central London Office Market Report Q3 2017
Central London Office Market Report Q3 2017Central London Office Market Report Q3 2017
Central London Office Market Report Q3 2017JLL
 
2017 JLL Energy Outlook
2017 JLL Energy Outlook2017 JLL Energy Outlook
2017 JLL Energy OutlookJLL
 
JLL Retail: Store closure summary, October 2017
JLL Retail: Store closure summary, October 2017 JLL Retail: Store closure summary, October 2017
JLL Retail: Store closure summary, October 2017 JLL
 
2017 Law Firm office market overview
2017 Law Firm office market overview2017 Law Firm office market overview
2017 Law Firm office market overviewJLL
 
October 2017 U.S. employment update and outlook
October 2017 U.S. employment update and outlookOctober 2017 U.S. employment update and outlook
October 2017 U.S. employment update and outlookJLL
 
JLL Retail: Store closure summary, September 2017
JLL Retail: Store closure summary, September 2017 JLL Retail: Store closure summary, September 2017
JLL Retail: Store closure summary, September 2017 JLL
 
September 2017 U.S. employment update and outlook
September 2017 U.S. employment update and outlookSeptember 2017 U.S. employment update and outlook
September 2017 U.S. employment update and outlookJLL
 

Plus de JLL (20)

September 2018 U.S. employment update and outlook
September 2018 U.S. employment update and outlookSeptember 2018 U.S. employment update and outlook
September 2018 U.S. employment update and outlook
 
August 2018 U.S. employment update and outlook
August 2018 U.S. employment update and outlookAugust 2018 U.S. employment update and outlook
August 2018 U.S. employment update and outlook
 
July 2018 U.S. employment update and outlook
July 2018 U.S. employment update and outlookJuly 2018 U.S. employment update and outlook
July 2018 U.S. employment update and outlook
 
June 2018 U.S. employment update and outlook
June 2018 U.S. employment update and outlookJune 2018 U.S. employment update and outlook
June 2018 U.S. employment update and outlook
 
May 2018 U.S. employment update and outlook
May 2018 U.S. employment update and outlookMay 2018 U.S. employment update and outlook
May 2018 U.S. employment update and outlook
 
Capital Markets: Slicing the debt pie
Capital Markets: Slicing the debt pieCapital Markets: Slicing the debt pie
Capital Markets: Slicing the debt pie
 
JLL Retail: Store closure summary, March 2018
JLL Retail: Store closure summary, March 2018JLL Retail: Store closure summary, March 2018
JLL Retail: Store closure summary, March 2018
 
March 2018 U.S. employment update and outlook
March 2018 U.S. employment update and outlookMarch 2018 U.S. employment update and outlook
March 2018 U.S. employment update and outlook
 
February 2018 U.S. employment update and outlook
February 2018 U.S. employment update and outlookFebruary 2018 U.S. employment update and outlook
February 2018 U.S. employment update and outlook
 
January 2018 U.S. employment update and outlook
January 2018 U.S. employment update and outlookJanuary 2018 U.S. employment update and outlook
January 2018 U.S. employment update and outlook
 
December 2017 U.S. employment update and outlook
December 2017 U.S. employment update and outlookDecember 2017 U.S. employment update and outlook
December 2017 U.S. employment update and outlook
 
JLL London Office Market Seminar
JLL London Office Market SeminarJLL London Office Market Seminar
JLL London Office Market Seminar
 
November 2017 U.S. employment update and outlook
November 2017 U.S. employment update and outlookNovember 2017 U.S. employment update and outlook
November 2017 U.S. employment update and outlook
 
Central London Office Market Report Q3 2017
Central London Office Market Report Q3 2017Central London Office Market Report Q3 2017
Central London Office Market Report Q3 2017
 
2017 JLL Energy Outlook
2017 JLL Energy Outlook2017 JLL Energy Outlook
2017 JLL Energy Outlook
 
JLL Retail: Store closure summary, October 2017
JLL Retail: Store closure summary, October 2017 JLL Retail: Store closure summary, October 2017
JLL Retail: Store closure summary, October 2017
 
2017 Law Firm office market overview
2017 Law Firm office market overview2017 Law Firm office market overview
2017 Law Firm office market overview
 
October 2017 U.S. employment update and outlook
October 2017 U.S. employment update and outlookOctober 2017 U.S. employment update and outlook
October 2017 U.S. employment update and outlook
 
JLL Retail: Store closure summary, September 2017
JLL Retail: Store closure summary, September 2017 JLL Retail: Store closure summary, September 2017
JLL Retail: Store closure summary, September 2017
 
September 2017 U.S. employment update and outlook
September 2017 U.S. employment update and outlookSeptember 2017 U.S. employment update and outlook
September 2017 U.S. employment update and outlook
 

Dernier

The Economic History of the U.S. Lecture 26.pdf
The Economic History of the U.S. Lecture 26.pdfThe Economic History of the U.S. Lecture 26.pdf
The Economic History of the U.S. Lecture 26.pdfGale Pooley
 
The Economic History of the U.S. Lecture 23.pdf
The Economic History of the U.S. Lecture 23.pdfThe Economic History of the U.S. Lecture 23.pdf
The Economic History of the U.S. Lecture 23.pdfGale Pooley
 
Top Rated Pune Call Girls Viman Nagar ⟟ 6297143586 ⟟ Call Me For Genuine Sex...
Top Rated  Pune Call Girls Viman Nagar ⟟ 6297143586 ⟟ Call Me For Genuine Sex...Top Rated  Pune Call Girls Viman Nagar ⟟ 6297143586 ⟟ Call Me For Genuine Sex...
Top Rated Pune Call Girls Viman Nagar ⟟ 6297143586 ⟟ Call Me For Genuine Sex...Call Girls in Nagpur High Profile
 
High Class Call Girls Nashik Maya 7001305949 Independent Escort Service Nashik
High Class Call Girls Nashik Maya 7001305949 Independent Escort Service NashikHigh Class Call Girls Nashik Maya 7001305949 Independent Escort Service Nashik
High Class Call Girls Nashik Maya 7001305949 Independent Escort Service NashikCall Girls in Nagpur High Profile
 
High Class Call Girls Nagpur Grishma Call 7001035870 Meet With Nagpur Escorts
High Class Call Girls Nagpur Grishma Call 7001035870 Meet With Nagpur EscortsHigh Class Call Girls Nagpur Grishma Call 7001035870 Meet With Nagpur Escorts
High Class Call Girls Nagpur Grishma Call 7001035870 Meet With Nagpur Escortsranjana rawat
 
The Economic History of the U.S. Lecture 20.pdf
The Economic History of the U.S. Lecture 20.pdfThe Economic History of the U.S. Lecture 20.pdf
The Economic History of the U.S. Lecture 20.pdfGale Pooley
 
Stock Market Brief Deck (Under Pressure).pdf
Stock Market Brief Deck (Under Pressure).pdfStock Market Brief Deck (Under Pressure).pdf
Stock Market Brief Deck (Under Pressure).pdfMichael Silva
 
Call US 📞 9892124323 ✅ Kurla Call Girls In Kurla ( Mumbai ) secure service
Call US 📞 9892124323 ✅ Kurla Call Girls In Kurla ( Mumbai ) secure serviceCall US 📞 9892124323 ✅ Kurla Call Girls In Kurla ( Mumbai ) secure service
Call US 📞 9892124323 ✅ Kurla Call Girls In Kurla ( Mumbai ) secure servicePooja Nehwal
 
Log your LOA pain with Pension Lab's brilliant campaign
Log your LOA pain with Pension Lab's brilliant campaignLog your LOA pain with Pension Lab's brilliant campaign
Log your LOA pain with Pension Lab's brilliant campaignHenry Tapper
 
00_Main ppt_MeetupDORA&CyberSecurity.pptx
00_Main ppt_MeetupDORA&CyberSecurity.pptx00_Main ppt_MeetupDORA&CyberSecurity.pptx
00_Main ppt_MeetupDORA&CyberSecurity.pptxFinTech Belgium
 
Booking open Available Pune Call Girls Shivane 6297143586 Call Hot Indian Gi...
Booking open Available Pune Call Girls Shivane  6297143586 Call Hot Indian Gi...Booking open Available Pune Call Girls Shivane  6297143586 Call Hot Indian Gi...
Booking open Available Pune Call Girls Shivane 6297143586 Call Hot Indian Gi...Call Girls in Nagpur High Profile
 
The Economic History of the U.S. Lecture 30.pdf
The Economic History of the U.S. Lecture 30.pdfThe Economic History of the U.S. Lecture 30.pdf
The Economic History of the U.S. Lecture 30.pdfGale Pooley
 
Instant Issue Debit Cards - School Designs
Instant Issue Debit Cards - School DesignsInstant Issue Debit Cards - School Designs
Instant Issue Debit Cards - School Designsegoetzinger
 
05_Annelore Lenoir_Docbyte_MeetupDora&Cybersecurity.pptx
05_Annelore Lenoir_Docbyte_MeetupDora&Cybersecurity.pptx05_Annelore Lenoir_Docbyte_MeetupDora&Cybersecurity.pptx
05_Annelore Lenoir_Docbyte_MeetupDora&Cybersecurity.pptxFinTech Belgium
 
The Economic History of the U.S. Lecture 17.pdf
The Economic History of the U.S. Lecture 17.pdfThe Economic History of the U.S. Lecture 17.pdf
The Economic History of the U.S. Lecture 17.pdfGale Pooley
 
Pooja 9892124323 : Call Girl in Juhu Escorts Service Free Home Delivery
Pooja 9892124323 : Call Girl in Juhu Escorts Service Free Home DeliveryPooja 9892124323 : Call Girl in Juhu Escorts Service Free Home Delivery
Pooja 9892124323 : Call Girl in Juhu Escorts Service Free Home DeliveryPooja Nehwal
 
The Economic History of the U.S. Lecture 19.pdf
The Economic History of the U.S. Lecture 19.pdfThe Economic History of the U.S. Lecture 19.pdf
The Economic History of the U.S. Lecture 19.pdfGale Pooley
 
The Economic History of the U.S. Lecture 21.pdf
The Economic History of the U.S. Lecture 21.pdfThe Economic History of the U.S. Lecture 21.pdf
The Economic History of the U.S. Lecture 21.pdfGale Pooley
 
CALL ON ➥8923113531 🔝Call Girls Gomti Nagar Lucknow best sexual service
CALL ON ➥8923113531 🔝Call Girls Gomti Nagar Lucknow best sexual serviceCALL ON ➥8923113531 🔝Call Girls Gomti Nagar Lucknow best sexual service
CALL ON ➥8923113531 🔝Call Girls Gomti Nagar Lucknow best sexual serviceanilsa9823
 

Dernier (20)

The Economic History of the U.S. Lecture 26.pdf
The Economic History of the U.S. Lecture 26.pdfThe Economic History of the U.S. Lecture 26.pdf
The Economic History of the U.S. Lecture 26.pdf
 
The Economic History of the U.S. Lecture 23.pdf
The Economic History of the U.S. Lecture 23.pdfThe Economic History of the U.S. Lecture 23.pdf
The Economic History of the U.S. Lecture 23.pdf
 
Top Rated Pune Call Girls Viman Nagar ⟟ 6297143586 ⟟ Call Me For Genuine Sex...
Top Rated  Pune Call Girls Viman Nagar ⟟ 6297143586 ⟟ Call Me For Genuine Sex...Top Rated  Pune Call Girls Viman Nagar ⟟ 6297143586 ⟟ Call Me For Genuine Sex...
Top Rated Pune Call Girls Viman Nagar ⟟ 6297143586 ⟟ Call Me For Genuine Sex...
 
High Class Call Girls Nashik Maya 7001305949 Independent Escort Service Nashik
High Class Call Girls Nashik Maya 7001305949 Independent Escort Service NashikHigh Class Call Girls Nashik Maya 7001305949 Independent Escort Service Nashik
High Class Call Girls Nashik Maya 7001305949 Independent Escort Service Nashik
 
High Class Call Girls Nagpur Grishma Call 7001035870 Meet With Nagpur Escorts
High Class Call Girls Nagpur Grishma Call 7001035870 Meet With Nagpur EscortsHigh Class Call Girls Nagpur Grishma Call 7001035870 Meet With Nagpur Escorts
High Class Call Girls Nagpur Grishma Call 7001035870 Meet With Nagpur Escorts
 
The Economic History of the U.S. Lecture 20.pdf
The Economic History of the U.S. Lecture 20.pdfThe Economic History of the U.S. Lecture 20.pdf
The Economic History of the U.S. Lecture 20.pdf
 
Stock Market Brief Deck (Under Pressure).pdf
Stock Market Brief Deck (Under Pressure).pdfStock Market Brief Deck (Under Pressure).pdf
Stock Market Brief Deck (Under Pressure).pdf
 
Call US 📞 9892124323 ✅ Kurla Call Girls In Kurla ( Mumbai ) secure service
Call US 📞 9892124323 ✅ Kurla Call Girls In Kurla ( Mumbai ) secure serviceCall US 📞 9892124323 ✅ Kurla Call Girls In Kurla ( Mumbai ) secure service
Call US 📞 9892124323 ✅ Kurla Call Girls In Kurla ( Mumbai ) secure service
 
Log your LOA pain with Pension Lab's brilliant campaign
Log your LOA pain with Pension Lab's brilliant campaignLog your LOA pain with Pension Lab's brilliant campaign
Log your LOA pain with Pension Lab's brilliant campaign
 
00_Main ppt_MeetupDORA&CyberSecurity.pptx
00_Main ppt_MeetupDORA&CyberSecurity.pptx00_Main ppt_MeetupDORA&CyberSecurity.pptx
00_Main ppt_MeetupDORA&CyberSecurity.pptx
 
Booking open Available Pune Call Girls Shivane 6297143586 Call Hot Indian Gi...
Booking open Available Pune Call Girls Shivane  6297143586 Call Hot Indian Gi...Booking open Available Pune Call Girls Shivane  6297143586 Call Hot Indian Gi...
Booking open Available Pune Call Girls Shivane 6297143586 Call Hot Indian Gi...
 
The Economic History of the U.S. Lecture 30.pdf
The Economic History of the U.S. Lecture 30.pdfThe Economic History of the U.S. Lecture 30.pdf
The Economic History of the U.S. Lecture 30.pdf
 
Instant Issue Debit Cards - School Designs
Instant Issue Debit Cards - School DesignsInstant Issue Debit Cards - School Designs
Instant Issue Debit Cards - School Designs
 
05_Annelore Lenoir_Docbyte_MeetupDora&Cybersecurity.pptx
05_Annelore Lenoir_Docbyte_MeetupDora&Cybersecurity.pptx05_Annelore Lenoir_Docbyte_MeetupDora&Cybersecurity.pptx
05_Annelore Lenoir_Docbyte_MeetupDora&Cybersecurity.pptx
 
The Economic History of the U.S. Lecture 17.pdf
The Economic History of the U.S. Lecture 17.pdfThe Economic History of the U.S. Lecture 17.pdf
The Economic History of the U.S. Lecture 17.pdf
 
Pooja 9892124323 : Call Girl in Juhu Escorts Service Free Home Delivery
Pooja 9892124323 : Call Girl in Juhu Escorts Service Free Home DeliveryPooja 9892124323 : Call Girl in Juhu Escorts Service Free Home Delivery
Pooja 9892124323 : Call Girl in Juhu Escorts Service Free Home Delivery
 
(Vedika) Low Rate Call Girls in Pune Call Now 8250077686 Pune Escorts 24x7
(Vedika) Low Rate Call Girls in Pune Call Now 8250077686 Pune Escorts 24x7(Vedika) Low Rate Call Girls in Pune Call Now 8250077686 Pune Escorts 24x7
(Vedika) Low Rate Call Girls in Pune Call Now 8250077686 Pune Escorts 24x7
 
The Economic History of the U.S. Lecture 19.pdf
The Economic History of the U.S. Lecture 19.pdfThe Economic History of the U.S. Lecture 19.pdf
The Economic History of the U.S. Lecture 19.pdf
 
The Economic History of the U.S. Lecture 21.pdf
The Economic History of the U.S. Lecture 21.pdfThe Economic History of the U.S. Lecture 21.pdf
The Economic History of the U.S. Lecture 21.pdf
 
CALL ON ➥8923113531 🔝Call Girls Gomti Nagar Lucknow best sexual service
CALL ON ➥8923113531 🔝Call Girls Gomti Nagar Lucknow best sexual serviceCALL ON ➥8923113531 🔝Call Girls Gomti Nagar Lucknow best sexual service
CALL ON ➥8923113531 🔝Call Girls Gomti Nagar Lucknow best sexual service
 

December 2016 U.S. employment update and outlook

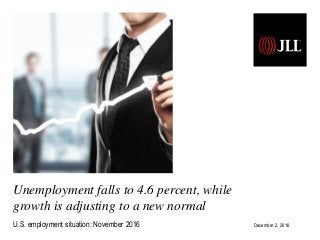
  • 1. U.S. employment situation: September 2013 Release date: October 22, 2013 Unemployment falls to 4.6 percent, while growth is adjusting to a new normal U.S. employment situation: November 2016 December 2, 2016
  • 2. November 2016 employment summary • November job growth was moderate, but consistent with H2 2016 levels - The U.S. labor market added 178,000 net new jobs in November, consistent with monthly additions during the second half of 2016 but below the year-to-date and 2015 averages. With the notable exception of professional and business services (PBS), slower growth affected most sectors during November, keeping the composition of gains similar in both monthly and annual terms. - Unemployment dropped by 30 basis points to a cyclical low of 4.6 percent on the back of consistent job growth and a slight decline in the labor force participation rate to 62.7 percent. Total unemployment mirrored this trend, also declining by 20 basis points to 9.3 percent. At the same time, initial unemployment claims continue to slide and now average roughly 252,000 per week, in line with mid-2000s levels. • The civilian labor force is not expanding fast enough to keep job creation as fast as in 2015 - Labor-market tightening has become very visible at the national level as well as across metropolitan areas. A combination of falling unemployment and job creation exceeding the rate of labor-force expansion will likely lead to a new normal for monthly growth. Annual growth in the labor force totaled 1.3 percent in November compared to 1.6 percent for total non-farm employment, further thinning the remaining slack. - Demand for goods and services remains on the rise, as evidenced by job openings remaining at roughly 5.5 million and maintaining a 3.7- percent opening rate. This will keep upward pressure on wages steady and above inflation, although the consumer price index is beginning to rebound as energy demonstrates initial signs of recovery. • Consistent growth and inflation approaching 2.0-percent target make Fed hike very likely - Although growth figures are not at previous levels, they remain healthy enough for the overall labor market to continue heading in the right direction in terms of demand for workers and wage growth. With inflation now at 1.6 percent and nearing the Federal Reserve’s 2.0-percent target and unemployment at its lowest point since August 2007, the stage has been set for a rate hike by the end of the year. Source: JLL Research, Bureau of Labor Statistics 2
  • 3. November 2016 U.S. labor market at a glance +178,000 (74 consecutive months of growth) 1-month net change +2,253,000 (+1.6% y-o-y) 12-month change +785,000 10-year average annual growth Source: JLL Research, Bureau of Labor Statistics 4.6% Unemployment rate -40bp 12-month change in unemployment 62.7% Labor force participation rate 5,486,000 (3.7% rate) Job openings 5,081,000 (3.5% rate) Hires 3,070,000 (2.1% rate) Quits 3
  • 4. November growth slightly below 2016 average, but gains remain healthy in light of minimal labor-market slack 360,000 226,000 243,000 96,000 110,000 88,000 106,000 122,000 221,000 183,000 164,000 196,000 360,000 226,000 243,000 96,000 110,000 88,000 160,000 150,000 161,000 225,000 203,000 214,000 197,000 280,000 141,000 203,000 199,000 201,000 149,000 202,000 164,000 237,000 274,000 84,000 166,000 188,000 225,000 330,000 236,000 286,000 249,000 213,000 250,000 221,000 423,000 329,000 221,000 265,000 84,000 251,000 273,000 228,000 277,000 150,000 149,000 295,000 280,000 262,000 168,000 233,000 186,000 277,000 24,000 271,000 252,000 176,000 208,000 142,000 178,000 0 50,000 100,000 150,000 200,000 250,000 300,000 350,000 400,000 450,000 2011 2012 2013 2014 2015 2016 1-monthnetchange 4 Source: JLL Research, Bureau of Labor Statistics
  • 5. Consistent growth and a drop in participation pushed unemployment to a cyclical low of 4.6 percent 0.0% 2.0% 4.0% 6.0% 8.0% 10.0% 12.0% -1,000.0 -800.0 -600.0 -400.0 -200.0 0.0 200.0 400.0 600.0 Unemploymentrate(%) 1-monthnetchange(thousands) Monthly employment change Unemployment rate Source: JLL Research, Bureau of Labor Statistics 5
  • 6. Job openings show little change at 5.5 million, but continue to rise faster than employment at 3.7 percent annually Source: JLL Research, Bureau of Labor Statistics 6 0 1,000 2,000 3,000 4,000 5,000 6,000 7,000 Jobopenings(thousands)
  • 7. 2.5% 2.7% 3.2% 3.3% 3.5% 3.9% 4.1% 4.3% 4.5% 4.9% 1.0% 1.5% 2.0% 2.5% 3.0% 3.5% 4.0% 4.5% 5.0% 5.5% Mining and logging Manufacturing Construction Information Trade, transportation and utilities Other services Financial activities Leisure and hospitality Education and health Professional and business services Job openings rate A healthy mix of office-using and non-office-using sectors is seeing the fastest rate of job-opening growth Source: JLL Research, Bureau of Labor Statistics 7
  • 8. 0 1,000 2,000 3,000 4,000 5,000 6,000 2007 2008 2009 2010 2011 2012 2013 2014 2015 2016 Hiresandquits(thousands) Hires Quits Hires levels have become more volatile, but the hiring rate remains stable at 3.5-3.6 percent Source: JLL Research, Bureau of Labor Statistics
  • 9. Hourly wage growth fell back to 2.5 percent in November, while rising inflation is beginning to eat away at gains Source: JLL Research, Bureau of Labor Statistics – CPI data as of March 2016 9 -3.0% -2.0% -1.0% 0.0% 1.0% 2.0% 3.0% 4.0% 5.0% 6.0% 2008 2009 2010 2011 2012 2013 2014 2015 2016 12-month%change Hourly wage growth CPI growth
  • 10. 0.0% 1.5% 1.9% 2.4% 2.4% 2.5% 2.6% 2.7% 4.1% 4.1% 0.0% 0.5% 1.0% 1.5% 2.0% 2.5% 3.0% 3.5% 4.0% 4.5% Mining and logging Education and health Other services Professional and business services Construction Trade, transportation and utilities Manufacturing Financial activities Leisure and hospitality Information 12-month % change in wages Information and leisure back to recent levels of wage growth (4.1 percent); education and mining continue to lag Source: JLL Research, Bureau of Labor Statistics – office-using sectors in red 10
  • 11. A slowdown in labor-force growth will keep employment from reaching the gains seen in 2015 and early 2016 Source: JLL Research, Bureau of Labor Statistics 11 -6.0% -5.0% -4.0% -3.0% -2.0% -1.0% 0.0% 1.0% 2.0% 3.0% 2008 2009 2010 2011 2012 2013 2014 2015 2016 12-month%change Civilian labor force Total non-farm
  • 12. After showing signs of growth, the labor force participation rate declined by 10bp to 62.7 percent Source: JLL Research, Bureau of Labor Statistics 12 60% 61% 62% 63% 64% 65% 66% 67% 2008 2009 2010 2011 2012 2013 2014 2015 2016 Laborforceparticipationrate(%)
  • 13. -10.0 -8.3 -6.0 -4.0 -0.3 1.2 2.0 2.0 2.8 4.0 6.0 8.9 14.3 19.0 22.0 29.0 34.7 44.0 63.0 -20 -10 0 10 20 30 40 50 60 70 Information Retail trade Durable goods Manufacturing Utilities Motor vehicles and parts Nondurable goods Mining and logging Wholesale trade Other services Financial activities Transportation and warehousing Temporary help services Construction Government Leisure and hospitality Health care and social assistance Education and health services Professional and business services 1-month net change (thousands) Countering slow growth or even contractions in key industries, PBS returned to very healthy rates of increase in November 13 Source: JLL Research, Bureau of Labor Statistics
  • 14. -89.0 -77.0 -54.0 2.4 12.1 15.0 23.0 52.2 60.6 63.1 74.0 153.0 155.0 217.0 222.6 293.0 492.1 571.0 581.0 -200 0 200 400 600 800 Mining and logging Durable goods Manufacturing Utilities Motor vehicles and parts Information Nondurable goods Wholesale trade Transportation and warehousing Temporary help services Other services Financial activities Construction Government Retail trade Leisure and hospitality Health care and social assistance Professional and business services Education and health services 12-month net change (thousands) 581.0 571.0 293.0 222.6 153.0 432.4 Education and health PBS Leisure and hospitality Retail trade Financial activities Manufacturing All other jobs With the slowdown in growth affecting most industries, there has been little change in annual composition of gains Source: JLL Research, Bureau of Labor Statistics 14 Core subsectors added 80.8 percent of all jobs over the past 12 months.
  • 15. 0.0% 1.0% 2.0% 3.0% 4.0% 5.0% 6.0% Unemploymentrateforbachelor’sdegreeholders(%) Like the official unemployment rate, bachelor’s degree unemployment fell again to a new cyclical low of 2.3 percent Source: JLL Research, Bureau of Labor Statistics 15
  • 16. A rebound in PBS in recent months is making up for downward revisions to financial activities and information figures -300 -250 -200 -150 -100 -50 0 50 100 150 200 2009 2010 2011 2012 2013 2014 2015 2016 1-monthnetchange(thousands) Information Professional and business services Financial activities Source: JLL Research, Bureau of Labor Statistics 16
  • 17. The tech slowdown continued in November, with year-over-year growth now at 4.3 percent; still 2.7x faster than total non-farm -11.0 -9.0 -7.0 -5.0 -3.0 -1.0 1.0 3.0 5.0 7.0 9.0 2008 2009 2010 2011 2012 2013 2014 2015 2016 High-tech Energy, Mining, and Utilities Office-using industries Total non-farm Source: JLL Research, Moody’s. Note: Due to data lags, high-tech employment only available through September 2016 17 12-month%change(jobs)
  • 18. Initial unemployment claims remain on a slow but steady downward trend and now average ~252,000 per week Source: JLL Research, U.S. Department of Labor 18 200,000 250,000 300,000 350,000 400,000 450,000 500,000 550,000 600,000 650,000 700,000 Claims Initial claims 4-week moving average
  • 19. 0 20 40 60 80 100 120 140 ConsumerconfidenceIndex Consumer confidence rose considerably in November to 107.1 points, mirroring upward revisions to GDP and spending Source: JLL Research, Conference Board 19
  • 20. Florida remains the leader in local employment growth due to cyclical volatility and diversified growth Source: JLL Research, Bureau of Labor Statistics 20 Dallas 3.3% Salt Lake City 3.4% Seattle- Bellevue 3.7% Orlando 4.0% Denver 3.6%
  • 21. As with the official unemployment rate, total unemployment registered a 20-basis-point drop to 9.3 percent 6.0% 8.0% 10.0% 12.0% 14.0% 16.0% 18.0% Totalunemployment(%) Total unemployment U-6 10-year average Source: JLL Research, Bureau of Labor Statistics 21
  • 22. ©2016 Jones Lang LaSalle Research IP, Inc. All rights reserved. All information contained herein is from sources deemed reliable; however, no representation or warranty is made to the accuracy thereof. For more information, please contact: Ben Breslau Managing Director - Americas Research Benjamin.Breslau@am.jll.com Ryan Severino Chief Economist - Americas Research Ryan.Severino@am.jll.com Phil Ryan Senior Research Analyst – Office and Economy Research Phil.Ryan@am.jll.com