U.S. Lodging Sector 2014 Wellness Check
•
1 j'aime•496 vues

The hotel investment sector has a strong outlook for the year ahead. Strengthening fundamentals are leading to increased transaction volume. Check out the top five signs of a healthy investment market for 2014.

Recommandé
Contenu connexe
En vedette
En vedette (7)
Similaire à U.S. Lodging Sector 2014 Wellness Check
Similaire à U.S. Lodging Sector 2014 Wellness Check (20)
Plus de JLL
Plus de JLL (20)
Dernier
Dernier (20)
U.S. Lodging Sector 2014 Wellness Check
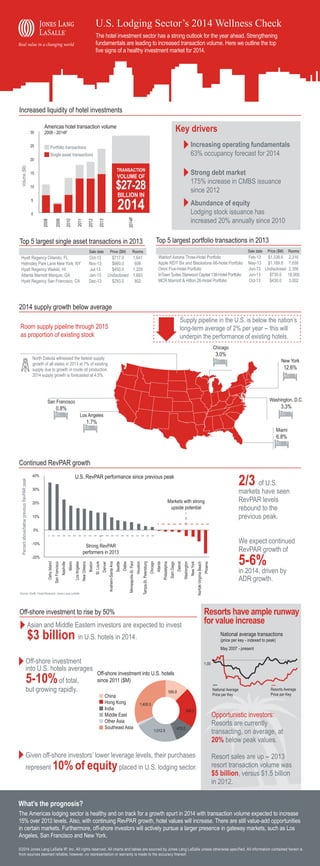
- 1. U.S. Lodging Sector’s 2014 Wellness Check The hotel investment sector has a strong outlook for the year ahead. trengthening S fundamentals are leading to increased transaction volume. ere we outline the top H five signs of a healthy investment market for 2014. Increased liquidity of hotel investments 30 25 Volume ($B) 20 Key drivers Americas hotel transaction volume 2008 - 2014F Increasing operating fundamentals 63% occupancy forecast for 2014 Portfolio transactions Single asset transactions 15 Strong debt market 175% increase in CMBS issuance since 2012 $27-28 10 5 Abundance of equity Lodging stock issuance has increased 20% annually since 2010 0 Top 5 largest single asset transactions in 2013 Sale date Hyatt Regency Orlando, FL Helmsley Park Lane New York, NY Hyatt Regency Waikiki, HI Atlanta Marriott Marquis, GA Hyatt Regency San Francisco, CA Oct-13 Nov-13 Jul-13 Jan-13 Dec-13 Price ($M) Rooms $717.0 1,641 $660.0 606 $450.0 1,229 Undisclosed 1,663 $293.0 802 Top 5 largest portfolio transactions in 2013 Waldorf Astoria Three-Hotel Portfolio Apple REIT Six and Blackstone 66-Hotel Portfolio Omni Five-Hotel Portfolio InTown Suites Starwood Capital 138-Hotel Portfolio MCR Marriott Hilton 26-Hotel Portfolio Sale date Price ($M) Rooms Feb-13 $1,338.6 2,316 May-13 $1,189.8 7,658 Jun-13 Undisclosed 2,356 Jun-13 $735.0 18,000 Oct-13 $430.0 3,002 2014 supply growth below average Supply pipeline in the U.S. is below the nation’s long-term average of 2% per year - this will underpin the performance of existing hotels. Room supply pipeline through 2015 as proportion of existing stock Chicago 3.0% North Dakota witnessed the fastest supply growth of all states in 2013 at 7% of existing supply due to growth in crude oil production. 2014 supply growth is forecasted at 4.5%. New York 12.6% Washington, D.C. San Francisco 3.3% 0.8% Los Angeles 1.7% Miami 6.8% Percent above/below previous RevPAR peak Continued RevPAR growth 40% 2/3 of U.S. U.S. RevPAR performance since previous peak markets have seen RevPAR levels rebound to the previous peak. 30% Markets with strong upside potential 20% 10% 0% -10% We expect continued RevPAR growth of Strong RevPAR performers in 2013 -20% 5-6% in 2014, driven by ADR growth. Source: Smith Travel Research, Jones Lang LaSalle Resorts have ample runway for value increase Off-shore investment to rise by 50% Asian and Middle Eastern investors are expected to invest $3 billion in U.S. hotels in 2014. National average transactions (price per key - indexed to peak) May 2007 - present Off-shore investment into U.S. hotels averages 5-10% of total, but growing rapidly. 1.00 Off-shore investment into U.S. hotels since 2011 ($M) China Hong Kong India Middle East Other Asia Southeast Asia National Average Price per Key 556.8 1,400.5 946.5 1,012.5 470.0 Given off-shore investors’ lower leverage levels, their purchases represent Resorts Average Price per Key 10% of equity placed in U.S. lodging sector. Opportunistic investors: Resorts are currently transacting, on average, at 20% below peak values. Resort sales are up - 2013 resort transaction volume was $5 billion, versus $1.5 billion in 2012. What’s the prognosis? The Americas lodging sector is healthy and on track for a growth spurt in 2014 with transaction volume expected to increase 15% over 2013 levels. Also, with continuing RevPAR growth, hotel values will increase. There are still value-add opportunities in certain markets. Furthermore, off-shore investors will actively pursue a larger presence in gateway markets, such as Los Angeles, San Francisco and New York. ©2014 Jones Lang LaSalle IP, Inc. All rights reserved. All charts and tables are sourced by Jones Lang LaSalle unless otherwise specified. All information contained herein is from sources deemed reliable; however, no representation or warranty is made to the accuracy thereof.