
Recommandé
Recommandé
Contenu connexe
Dernier
Dernier (20)
En vedette
En vedette (20)
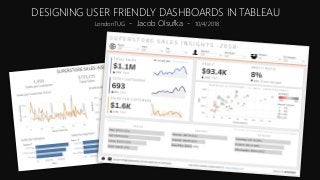
Designing User Friendly Dashboards in Tableau
- 1. DESIGNING USER FRIENDLY DASHBOARDS IN TABLEAU LondonTUG - Jacob Olsufka - 10/4/2018
- 2. Who am I? Been using Tableau for ~4 years Data @ Spotify Tableau Public public.tableau.com/profile/datavizard Iron Viz @j_olsufka
- 3. • ~180 Desktop users • ~3000 views per day • ~800 active users in the last 3 months • No dedicated ‘CoE’, we have passionate Tableau Users across the organization who maintain and manage our Server and Tableau community • Creating Ad Hoc reports • Data exploration tool • Internal Dashboards • many using Tableau • others that are custom built • Data Style Guides TABLEAU USAGE @ SPOTIFY
- 5. DESIGNING USER FRIENDLY DASHBOARDS IN TABLEAU
- 6. COMMON REASONS DASHBOARDS AREN’T WIDELY ADOPTED • Tough to find • Data isn’t up to date • Dashboards are broken • Not useful to business users • Not user friendly
- 8. ADDING CONTEXT to your visualizations
- 9. SPARKLINES
- 10. SPARKLINES --- Context is added by labeling the high and low points along the line --- Credit: Luke Stanke
- 12. SPARKLINES PERCENT CHANGE RAW CHANGE
- 13. SPARKLINES PERCENT CHANGE RAW CHANGE VOLUME
- 14. RATIOS - In 2018, Sales per Customer decreased by 28% compared to 2017 - Why did SPC decrease? A) Sales decreased, while customers remained steady B) Sales increased, but customers increased at an even faster rate C) Sales stayed steady, while customers increased
- 15. RATIOS - In 2018, Sales per Customer decreased by 28% compared to 2017 - Why did SPC decrease? A) Sales decreased, while customers remained steady B) Sales increased, but customers increased at an even faster rate C) Sales stayed steady, while customers increased D) We need more context
- 16. RATIOS
- 17. RATIOS --- To fully understand how a ratio metric is moving, you need to understand what is happening with both the numerator and denominator ---
- 18. ADDING CONTEXT to your Tableau Dashboards
- 19. 1) User instructions and click icon
- 20. 2) Filter navigation details 3) Highlight bars as any color
- 21. 2) Filter navigation details
- 22. 1) User instructions and click icon 2) Filter navigation details 3) Highlight bars as any color 4) Use a parameter to filter & highlight at the same time
- 23. ADDING PROFFESIONALITY to your Tableau Dashboards
- 24. DASHBOARD TEMPLATES • Give a unified design and professional feel to your reporting • Creates a sense of familiarity with users • Provides common functionality across dashboards
- 26. DASHBOARD TEMPLATES Header • Company or team logo • Well organized filters • Show Apply Button • Only relevant values • Hide Show ‘All’ if only to be used for single choices
- 28. DASHBOARD TEMPLATES Footer • Icon for informative text within tooltip • Contact button with mailto: URL action • Hyperlinks • Data up to date as of
- 29. A FEW MORE THOUGHTS… • Utilize whitespace (padding in Tableau) • Stick to simple visualizations (there’s a reason they are the classics) • Use color smartly • Don’t have the same color mean two different things • Use color to spotlight/draw attention
- 30. TABLEAU PET PEEVES… • Cover sheets not meant to be clicked with blanks • Pay attention to what happens to sheets when filtered vs.
- 31. ONE LAST TRICK… • Dynamically change the Display Units
- 32. ONE LAST TRICK… • Dynamically change the Display Units
- 36. https://www.netflix.com/ViewingActivity • Visualize binge statistics of different shows • Compare yourself to others • See if you are the top binger
- 37. https://docs.google.com/forms/d/e/1FAIpQLSdQquBEwvhRoAcSgqe6EljYBL_Zdtyv3yi2b33PNRtayBu0Uw/viewform Fill out the google form if you’d like your data included
Notes de l'éditeur
- What im going to be talking about Decided to make a presentation around common pieces of feedback I give over and over while critiqueing Dashboards Mostly Focus on the concepts rather than technical aspects Dashboard is on tableau public and is downloadable
- Embeded solutions can be useful for this – some sort of dashboard landing page Missed the mark on creating something that will be actionable. Users don’t understand how to get to the answers they are looking for… so they’re like.. Just give me the data and I’ll do it in excel! Don’t need your dashboard
- Sparklines are a good example of the importance of adding context!
- Sparklines are a good example of the importance of adding context!
- ALL of this information is important.. Just providing users with one aspect of the CONTEXT may not be enough.. Some might be more important than others, highlight/show what is important… have the other pieces be AVAILABLE (secondary or in tooltips)
- ALL of this information is important.. Just providing users with one aspect of the CONTEXT may not be enough.. Some might be more important than others, highlight/show what is important… have the other pieces be AVAILABLE (secondary or in tooltips)
- ALL of this information is important.. Just providing users with one aspect of the CONTEXT may not be enough.. Some might be more important than others, highlight/show what is important… have the other pieces be AVAILABLE (secondary or in tooltips)
- Filtered to Central Region and Consumer Segment To fully understand this – you need to see how BOTH the numerator and denominator are changing If ratio is going up… numerator is increasing faster than the denom num is steady.. Denom is decreasing Denom is decreasing faster than num
- Filtered to Central Region and Consumer Segment To fully understand this – you need to see how BOTH the numerator and denominator are changing If ratio is going up… numerator is increasing faster than the denom num is steady.. Denom is decreasing Denom is decreasing faster than num
- Filtered to Central Region and Consumer Segment To fully understand this – you need to see how BOTH the numerator and denominator are changing If ratio is going up… numerator is increasing faster than the denom num is steady.. Denom is decreasing Denom is decreasing faster than num
- Filtered to Central Region and Consumer Segment To fully understand this – you need to see how BOTH the numerator and denominator are changing If ratio is going up… numerator is increasing faster than the denom num is steady.. Denom is decreasing Denom is decreasing faster than num
- This section filters the rest of the dashboard
- This section filters the rest of the dashboard
- This section filters the rest of the dashboard
- This section filters the rest of the dashboard
- Filtered to Central Region and Consumer Segment To fully understand this – you need to see how BOTH the numerator and denominator are changing If ratio is going up… numerator is increasing faster than the denom num is steady.. Denom is decreasing Denom is decreasing faster than num
- Filtered to Central Region and Consumer Segment To fully understand this – you need to see how BOTH the numerator and denominator are changing If ratio is going up… numerator is increasing faster than the denom num is steady.. Denom is decreasing Denom is decreasing faster than num
- Filtered to Central Region and Consumer Segment To fully understand this – you need to see how BOTH the numerator and denominator are changing If ratio is going up… numerator is increasing faster than the denom num is steady.. Denom is decreasing Denom is decreasing faster than num
- Filtered to Central Region and Consumer Segment To fully understand this – you need to see how BOTH the numerator and denominator are changing If ratio is going up… numerator is increasing faster than the denom num is steady.. Denom is decreasing Denom is decreasing faster than num
- Filtered to Central Region and Consumer Segment To fully understand this – you need to see how BOTH the numerator and denominator are changing If ratio is going up… numerator is increasing faster than the denom num is steady.. Denom is decreasing Denom is decreasing faster than num
- Filtered to Central Region and Consumer Segment To fully understand this – you need to see how BOTH the numerator and denominator are changing If ratio is going up… numerator is increasing faster than the denom num is steady.. Denom is decreasing Denom is decreasing faster than num
- Filtered to Central Region and Consumer Segment To fully understand this – you need to see how BOTH the numerator and denominator are changing If ratio is going up… numerator is increasing faster than the denom num is steady.. Denom is decreasing Denom is decreasing faster than num
- Filtered to Central Region and Consumer Segment To fully understand this – you need to see how BOTH the numerator and denominator are changing If ratio is going up… numerator is increasing faster than the denom num is steady.. Denom is decreasing Denom is decreasing faster than num
- Filtered to Central Region and Consumer Segment To fully understand this – you need to see how BOTH the numerator and denominator are changing If ratio is going up… numerator is increasing faster than the denom num is steady.. Denom is decreasing Denom is decreasing faster than num