
Recommandé
Contenu connexe
Tendances
Tendances (20)
Similaire à A study on financial perfomance don for precot meridian limited
Similaire à A study on financial perfomance don for precot meridian limited (20)
Dernier
Dernier (20)
A study on financial perfomance don for precot meridian limited
- 1. P a g e 1 | 57 1. Introduction: Ratio analysis of financial statements stands for the process of determining and presenting relationship of items and group of items in the statements .There are different ratios which an analyst can employ depending on the purpose for which the analysis is made. A creditor, who likes to know the ability to meet its current obligations, may think of current and liquid ratios. Similarly, Managers and Investors who want to know operationally efficiency may think of return on investments, turnover and fixed assets, earnings per share, book value per share and dividend per share. Ratio analysis is a powerful tool of financial analysis. It is a process of identifying the financial strength and weakness of the firm by properly establishing relationship between the items of Balance sheet and Profit and Loss a more meaningful understanding of the financial position and performance of a firm. A Ratio is a mathematical relationship between the two related items expressed in quantitative form. A ratio is used as an index yard stick for evaluating the financial position and performance of a firm. Requisite for Ratio analysis The requisition of Ratio Analysis to come in to being caused by the following facts: Business facts displayed in Balance sheet and Profit and Loss account do not convey any pompous individually. Their significance lies in the fact that they are inter-related. From this time on word, there is need for fixing relationship between various but related items. Ratio Analysis as a tool for the interpretation of financial statements is also important because ratios help the analyst to have a profound cautiously in to the data given statements figure in their peremptory forms shown in financial statements are neither significant nor to enable to the compared. Uses of ratio Analysis The nature of ratio Analysis will differ depending on the purpose of the analyst. Ratio Analysis the starting point for making plans before using any sophisticated fore casting and budgeting procedures . The Ratio analysis is useful for the following reasons.
- 2. P a g e 2 | 57 Share Holders / Investors: Investors or Shareholders, who have invested their money in the firm’s shares, are most concerned about the firm’s earnings. They restore more confidence in those firms that show steady growth in earnings .As such, they concentrate on the analysis of the firm’s present and future profitability. They are also interested in the firm’s financial position to the extent it influences the firm’s earnings ability. Owners or Investors desire primarily a basis for estimating capacity. Creditors: Creditors are concerned primarily with liquidity and ability and to pay interest on redeems loan with a specified period. Long-Term Creditors: The Long term creditors are interested in the long term solvency and survival. They analyze about firm’s solvency and profitability overtime, its ability to generate cash, to be able to pay interest and repay principal and relationship between various sources of funds. Employees: The employees are also interested in the financial position of the concern especially profitability. Their wages increase, the amount of fringe benefits are related to the volume of profits earned by the concern. The employees make use of information available in financial statements. Government: Government is also interested to know the strength and weakness of the firm. Government makes the future policies, plans on the basis of financial information available from various units of the company Management: Finally management of the firm or Executives would be interested in every aspect of the financial analysis. It is their overall responsibilities to see at the resources of the firm are used most effectively, and the firm’s financial condition is sound. Through financial analysis they try to seek answers to the following questions:
- 3. P a g e 3 | 57 Is the firm in a position to meets it current obligations. What sources of Long-term finance are employed by the firm and what is the relationship between them? Is there any danger to the solvency of the firm due to the employment of excessive debt how efficiently does the firm uses its asses are the earnings of the adequate? Do Investors consider the firm profitable and safe for the purpose of investing their money in the shares of the firm? Financial analysis may not provide exact answers to these questions, but it does indicate what can be expected in the future. Standards of comparison A single ratio in itself does not indicate favorable or unfavorable condition. It should be compared with some standards of comparison may consist of ratios calculated from the past financial statements of the same firm. Ratios developed using the projected or proforma financial statements of the same firm. Ratios of some selected firms, especially the most progressive and successful at the same point of time. Ratios of the industry to which the firm belongs The easiest way to evaluate the performance of a firm is to compare its present ratios with the past ratios. When financial ratios over a period of time are compared, it gives an indication of the direction of change and reflects whether the firm’s financial position and performance has improved, deteriorated constant over time. This kind of comparison is valid only when the firm’s accounting policies and procedures have not changed over time. Sometimes, Future ratios are used as the standard comparison. Future ratios can be developed projected or proforma financial statements. The comparison of the past ratios with future ratios shows the firm’s relative strengths and weakness in the past and the future. If the future ratios indicate weak financial position, corrective actions. Another way of comparison is to compare the ratios of one firm with some related firms in the same industry at the same point of time. In most of the cases, it is more useful to compare firm’s ratios with the ratio of a few carefully selected competitors who have similar operations. This kind of comparison indicates the relative financial position and performance of the firm. A firm can easily resort to such a comparison, as it is not difficult to get the published financial statements of the similar firms. To determine the financial condition and performance of a firm, its ratios may be
- 4. P a g e 4 | 57 compared with average ratios of the industry of which the firm is a member. Industry ratios are important standards in view of the fact that each industry as its characteristics which influence the financial operating relationships But there are certain practical difficulties in using industrial ratios. It is difficult to get average ratios in the industry .Even if industry ratios are available they are averages –averages of the ratios of strong and weak firms. Sometimes the spread may be so wide that the average may not be little utility. The averages will be meaningless and the comparison futile, if the firm with in the same industry widely differ in their accounting policies and parties. If it is possible to standardize the accounting data for the companies in the industry and eliminate extremely strong and extremely weak firms, the industry ratios will prove to useful in evaluating the financial condition and performance of a firm. Types of Ratios Several ratios can be calculated from the accounting data contained in the financial statements. These ratios can be grouped in to various classes according to the financial activity or function to be evaluated. As stated earlier, the parties that generally undertake financial analysis are short-term creditors, Long-term creditors, owners and Management. Short-term creditor’s main interest is in the liquidity position of the short -term solvency of the firm. Long-term creditors on the other hand, are more interested in the long –term solvency and profitability of the firm. Similarly, owners concentrate on the firm’s profitability analysis and analysis of the firm‘s financial conditions. Management is interested in evaluating every activity of the firm. They have to protect the interest of all parties and see that the firm grows profitability. In view of the requirements of the user of ratios we may classifythem as follows: Traditional classification Balance sheet Ratios: Balance sheet Ratios deal with the relation between two balance sheet items. Both the items must however pertain to same Balance sheet. Ex. Current Ratio
- 5. P a g e 5 | 57 Profit and Loss Account These ratios deal with the relationship between two profit and loss account items, both the items must belong to the same Profit and Loss Account. Ex. Gross Profit Ratio Composite or Mixed Ratios: These ratios exhibit statement item and a Balance sheet item. Ex. Stock Turnover Ratio Classification Of Ratios: RATIOS may be classified in a number of was keeping in view of the particular purpose. Rations indicating profitability are calculated on the basis of the profit and loss account, those indicating financial position are computed on the basis of the balance sheet and those which show operating efficiency or productivity or effective use or resources are calculated on the basis of figures in the profit and loss account and the balance sheet. This classification is rather crude and unsuitable to determine the profitability and financial position of the business. To achieve this effectively, ratios may be classified as: 1. Liquidity Ratios 2. Leverage Ratios 3. Activity Ratio 4. Profitability Ratios 1. Liquidity Ratios: It is extremely essential for a firm to be able to meet its obligations as they become due. Liquidity Ratios measure the ability of the firm to meets its current obligations. In fact, analysis of liquidity needs the preparation of Cash Budgets and Cash flow statements .But liquidity ratios, by establishing in a relationship between Cash and other Current obligations provide a quick measure of liquidity. Also that it is not too much meets its obligations, due to lack of sufficient liquidity, will result in bad credit rating, loss of creditors’ confidence, or even in lawsuits resulting in the closure of the Company. A very high degree of liquidity is also bad. Therefore, it is necessary to strike a proper balance between Liquidity.
- 6. P a g e 6 | 57 The ratios, which measured and indicate the extent of firm’s liquidity, are known was liquidity ratios or short-term solvency ratios commonly used liquidity ratios included. a. Current Ratio (OR) Working Capital Ratio b. Quick Ratio (OR) Acid Test Ratio c. Cash Position Ratio (OR) Super Quick Ratio 2. Leverage Ratio: The long term creditors like Debentures holders, financial Institutions, etc., are more concerned with the firm’s long -term financial strength. To judge the long-term financial position of the firm, Leverage or capital structure ratios are calculated. These ratios indicate the funds provided by the owners and creditors. As a general, there should be an appropriate mix of the debt and owner’s equity in financing the firm’s assets. Firm with low leverage have less risk of loss, but they also have lower expected returns. Conversely firms high leverage ratios have risk of large losses .But also have a chance of earning huge profits. Therefore, before deciding whether a firm should have debt, must balance with higher expected returns against increased risks. The most commonly examined leverage ratios are: i) Debt Equity Ratio ii) Fixed Assets Ratio iii) Current Assets To Fixed Assets Ratio 3. Activity Ratios The funds of creditors and owners are interested in various kinds of Assets to generate sales and profit. The better the management of Assets, the larger will be the amount of sales. Activity ratios are employed to evaluate the efficiency with which the firm manages and utilizes its assets. These ratios are also called Turn over ratios because they indicate the speed with which assets are being converted or turn over in to sales. Activity ratios thus involve a relationship between sales and the various assets .A proper balance between Sales and Assets generally reflects that assets are managed well. Following are some of the important activity ratios. i) Total assets turnover ratio ii) Fixed assets turnover ratio iii) Current assets turnover ratio
- 7. P a g e 7 | 57 iv) Stock turnover ratio v) Debtors turnover ratio vi) Creditors turnover ratio 4. Profitability Ratios: A company should earn profits to survive and grow over a long period of time. Profits are essential, but it would be wrong to assume that every action initiated by management of the company should be aimed at maximizing profits, irrespective of social consequences. Profit is the difference between total Revenues and total Expenses over a period of time. Profits are the ultimate output of a company and it will have no future if it fails to make sufficient profits. Therefore, the Financial Manager should continuously evaluate the efficiency of the company. Besides management of the company, creditors and owners are also interested in the profitability of the firm. Generally, two major types of profitability ratios are calculated. 1. Profitability in relation to sales. 2. Profitability in relation to Investment i) Gross profit ratio ii) Operating ratio iii) Operating profit ratio iv) Net profit ratio Significance of Ratio Analysis The ratio Analysis is the most powerful tool of the financial analysis. The many diverse groups of people are interested in analyzing the financial information to indicate the operating efficiency and the various aspects of the firm’s financial position. These people use ratios to determine a particular financial characteristic of the firm in which they are interested. With the help of ratios one can determine. 1. The ability of the firm to meet its current obligations. 2. The extent to which the firm is utilizing its long-term solvency by borrowing funds. 3. The efficiency with which the firm is utilizing its various assets in generating sales Revenue.
- 8. P a g e 8 | 57 4. The overall operating efficiency and performance of the firm. A short-term creditor will be interested in current financial position of the firm, while a long-term creditor will pay more attention to the solvency of the firm and also be interested in profitability of the firm. The equity shareholders are generally concerned with their return and many bother about the firm’s financial condition only when their earnings are depressed. In fact, it has to be realized that the short-term and the long-term financial position and the profitability of the firm are based on every kind of financial analysis, the emphasis would differ. In credit Analysis, the analyst will usually select a few important ratios. He may use the Current Ratio or Quick- Asset Ratio to judge the firm’s liquidity or Debt-paying ability. The ratio Analysis is also useful in security analysis. The major focus on security analysis is on the long-term profitability. From time to time, Management uses ratio Analysis to determine the firm’s financial strength and weakness and accordingly takes action to improve the firm’s position. The ratio of a firm in itself does not reveal anything. For meaningful interpretation, the ratios of the firm should be compared with the ratios of similar firms and industry. This comparison will reveal whether the firm is significantly out have like. The firm should undertake a detailed analysis to spot out the trouble areas. The Ratio Analysis will reveal the financial condition of the firm more reliably when trends in ratios over time are analyzed. The significance of trend analysis of ratios lies in the fact the analyst can know the direction of movement, i.e., whether the movement is favorable or unfavorable. 1.1 Objectives of the study The main objective of the present study is to obtain a true in sight in to financial position of Precot Meridian Ltd, Kodigenahali. The Ratio Analysis is a tool which helps to study the changes that take place over a given period of time .It helps to 0judge the profitability, liquidity, stability and turnover with the comparison of present ratios with the past ratios. 1.2 Scope of Study It helps in evaluating the firm’s performance: With the help of ratio analysis conclusion can be drawn regarding several aspects such as financial health, profitability and operational efficiency of the undertaking. Ratio points out the operating efficiency of the firm i.e. whether the management has utilized the firm’s assets correctly, to
- 9. P a g e 9 | 57 increase the investor’s wealth. It ensures a fair return to its owners and secures optimum utilization of firms assets It helps inter-firm in comparison: Ratio analysis helps in inter-firm comparison by providing necessary data. An interfere comparison indicates relative position .It provides the relevant data for the comparison of the performance of different departments. If comparison shows a variance, the possible reasons of variations may be identified and if results are negative, the action may be initiated immediately to bring them in line. It simplifies financial statement: The information given in the basic financial statements serves no useful Purpose unless it’s interrupted and analyzed in some comparable terms. The ratio analysis is one of the tools in the hands of those who want to know something more from the financial statements in the simplified manner Advantages 1. To work out the profitability: Accounting ratio help to measure the profitability of the business by calculating the various profitability ratios. It helps the management to know about the earning capacity of the business concern. In this way profitability ratios show the actual performance of the business. 2. To work out the solvency: With the help of solvency ratios, solvency of the company can be measured. These ratios show the relationship between the liabilities and assets. In case external liabilities are more than that of the assets of the company, it shows the unsound position of the business. In this case the business has to make it possible to repay its loans. 3. Helpful in analysis of financial statement: Ratio analysis help the outsiders just like creditors, shareholders, debenture-holders, bankers to know about the profitability and ability of the company to pay them interest and dividend etc. 4. Helpful in comparative analysis of the performance: With the help of ratio analysis a company may have comparative study of its performance to the previous years. In this way company comes to know about its weak point and be able to improve them. 5. To simplify the accounting information: Accounting ratios are very useful as they briefly summarize the result of detailed and complicated computations.
- 10. P a g e 10 | 57 6. To work out the operating efficiency: Ratio analysis helps to work out the operating efficiency of the company with the help of various turnover ratios. All turnover ratios are worked out to evaluate the performance of the business in utilizing the resources. 7. To workout short-term financial position: Ratio analysis helps to work out the short-term financial position of the company with the help of liquidity ratios. In case short- term financial position is not healthy efforts are made to improve it. 8. Helpful for forecasting purposes: Accounting ratios indicate the trend of the business. The trend is useful for estimating future. With the help of previous years’ ratios, estimates for future can be made. In this way these ratios provide the basis for preparing budgets and also determine future line of action 1.3 Limitations The Ratio Analysis is a widely used technique to evaluate the financial position and performance of a business. But there are certain problems in using ratios. The following are the limitations of the Ratio Analysis. It is difficult to decide on proper basis for comparison: The comparison is rendered difficult because of differences in situations of two companies or one company over years. The price level changes make the interpretations of ratios invalid. The differences in definitions of items of Balance sheet and income statements make the interpretation of ratios difficult. The ratios calculated at a point of time are less informative and defective as they suffer from short-term changes. The ratios are generally calculated from past financial statements and thus are no indications of the future. Ratio Analysis is merely a tool of financial statements. Hence, ratios become useless if separated from the statements from which they are computed. Ratios are only means of financial analysis and not an end in itself. Ratios have to be interpreted and different people may interpret the same ratio in different
- 11. P a g e 11 | 57 Company Profile Precot meridian is one of the oldest groups which started its mill in 1958, promoted by N.Damodaran. Precot Meridian limited (PML) was incorporated in 1962 in Palakkad, Kerala, to produce cotton yarns with an initial capacity of 12096 spindles. Precot Meridian limited made its maiden issue in 1962. Production of cotton yarns commenced during 1964.The Precot has symbolized Quality and Trust in the textile industry. With four decades of spinning experience and a diverse range of products that include cotton yarns, sewing threads, fabrics and garments; Precot is one of the few totally integrated textile players with a total turnover of 90 million US Dollars. The Group has state of the art infrastructure facilities and skilled personnel to rise up to customer expectations. The group has been accorded the status of „Export House‟ by The Cotton Textile Export Promotion Council of India (TEXPROCIL).Precot exporting its products to Belgium, China, Italy, Japan, Malaysia, Portugal, South Korea, Turkey and U.K. Key mile stones From an initial capacity of 12,096 Spindles at Kanjikode, Kerala (A-Unit) in 1964, now the capacity of the unit is 57,600 spindles. In 1983, the second unit (B-Unit) was set up at Hindupur, Andhra Pradesh with an initial capacity of 28,800 Spindles and the current capacity is 69,120 spindles. In 1992, the third unit (C-Unit) was set up at Walayar, Kerala as a 100% Export Oriented Unit with a capacity of 12,096 Spindles and the current capacity is 25,344 spindles. In 1995, an OE Unit (D Unit) was set up at Walayar adjacent to its third Unit with a capacity of 1344 Rotors. In 1998, a yarn dyeing Unit (K Unit) was set up at Kolar, Karnataka to manufacture polyester sewing threads and its capacity is 7 tons per day. In 2001, a modern weaving plant at Sethumadai near Pollachi was set up to manufacture yarn- dyed fabrics. In January 2004, yarn dyeing operations were started at Perundurai, which caters to the needs of the Sethumadai unit. In 2006, Meridian Industries merged with Precot Mills and the name was changed to Precot Meridian Ltd., and the current capacity is 66,154 spindles. Precot Meridian is looking towards green power generation and has invested in 17 Windmills. These windmills cater 50% of the power requirements of units located in Tamil Nadu. Quality Systems Precot Meridian being an ISO 9001 certified company is focused on providing the
- 12. P a g e 12 | 57 finest quality y yarns and fabrics. In order to meet customer requirements and to ensure their satisfaction, Precot Meridian implemented TQM in all the units for executing „5S‟ m methods of housekeeping and 3M methods to control wastage of resources. Quality y S system is achieved through total employee involvement, technical Innovation and continual improvement Meridian Industries Limited merges with Precot Meridian Industries Limited has been merged with Precot Mills Limited with effect from 01st April, 2006. Meridian Industries Ltd (MIL) which was incorporated in the year 1993 was promoted by Precot Mills Limited and around 70% of the shares of MIL were held by the shareholders of Precot. To have larger capacity in a single company, instead of the capacities being spread over in two companies having common shareholders, the merger was proposed. This has been approved by the High Court of Madras vide its order dated 30th August and 1st Sept, 06. As per the scheme of Merger, the shareholders of MIL are entitled for one share of Precot for every two shares of MIL. Accordingly the share certificates of Precot were dispatched in Dec, 06 to those shareholders who have surrendered the certificates of MIL. Shareholders of MIL, who are yet to claim the certificates of Precot can, do so by sending the MIL certificates along with the following application duly filled in to the register. Product Profile Precot Meridian B-Unit manufactures and markets high quality yarns like Slub Yarn, Organic Yarn, Compact Yarn, Elitwist Yarn, etc. to domestic and international clients. Slub Yarn Slub yarn is manufactured with the technical support of CAIPO, Italy and LAKSHMI, India. Precot Meridian manufactures all types of slub yarn - short, medium long, extra-long and reverse slub yarn. Slub yarn comes under the fancy yarn domain as it creates certain visual effects in the resulting fabric. Slub yarn fabric is characterized by an uneven surface; simple colors seem appealing because of the regular change in texture right through the fabric. Organic Yarn Producing yarn that is certified as being organic involves a long procedure committed to eco- friendly practices at various levels. The cotton used to produce organic yarn is grown on farms that adhere to farming practices wherein chemical herbicides, growth-stimulants and pesticides
- 13. P a g e 13 | 57 are not used. Sustainable agricultural practices are put into use to ensure that the cotton used is 100% organic. Precot Meridian sources this organic cotton at premium prices in order to ensure that the yarn manufactured is also organic. This is certified by Control Union, Netherlands. This certificate is renewed each year under the guidance of Control Union Netherlands after a strict audit process. Apart from the measures taken to ensure the organic quality of the yarn, due care is taken to comply with safety, labor and other mandatory issues, while producing organic yarn. CompactYarn Precot Meridian has introduced a novel way of reducing the extra hairiness that characterizes conventional yarn. Conventional yarn spinning techniques result in low strength and irregular appearance. This is overcome by the world class suessan Compact which uses the compact spinning technique. This ensures that the yarn produced has quality characteristics such as evenness, tensile strength and lowered hairiness. Elitwist / CompactYarn Elitwist / Compact yarn is used in specialist applications. The technology used has the tendency to reduce the twisting triangle in the spinning machine. Elitwist yarn can withstand heavy loads because of its increased strength and elongation. It maintains a good luster as the hairiness is fairly low. The enhanced strength of Elitwist yarn makes it a favored product with customers. Warping breaks are reduced a great deal and sizes can be changed without too many cost implications. It also lends itself to extensive dyeing possibilities. Precot Meridian as one of the most well-known manufacturers of polyester sewing thread, produces a wide range that suit the varied needs of end users. Both two ply and three ply yarns that range from Ne 20 to Ne 60 are manufactured. Polyesters CottonBlend Precot Meridian manufactures a wide range of polyester cotton blends ranging from Ne 30 to 40. Two different cotton blends manufactured include 40/60 and 50/50 poly cotton. These products are well known for their quality and the ultimate fabric appearance is an important factor for PC blends. Cotton is grown in more than 60 countries and utilizes nearly 5% of total cultivatable land. More than 25% of the worldwide pesticides production is used in cultivating cotton. As cotton is not a food product, the pesticides used are more toxic. Indiscriminate use of such pesticides cause Depletion of nature insect population in cotton growing countries
- 14. P a g e 14 | 57 Pesticides going into river and affect drinking water seriously. High level of pesticides in the soil affect food products if grown in that soil. Cattle feed from these cotton leaves and seeds get affected/even poisoned some times. Promoters of the organic movement A) Food and agricultural organization of United Nation (1963) b) International Federation of organic Agricultural movement (1972) Global and Indian statistics: 18 counties produce organic cotton. India's organic cotton production is 11,500 tons in 2006. GOTS:(Global Organic Textile Standard) The standards are developed by international working group on the global textile standards as part of the International textile conference. GOTS is intended to allow organic textile manufacturer to export their product using this one certificate that will be well accepted in all countries. Inspection at site by certifying agency Control Union is an organization with their base in Netherland's, carry out inspection at manufacturer's sites for compliance to GOTS.
- 15. P a g e 15 | 57 Product Range Combed Cotton Yarn 100% Organic combed cotton yarn for Knitting and Weaving Ne 30/1 to 40/1 100% Organic combed cotton slub yarn for Knitting and Weaving Ne 30/1 t40/1 Elitwist yarn for knitting and Weaving Knitting Yarn Ne 30/1 to Ne 60/1 includes both domestic and international cotton Weaving Yarn Ne 40/1 to Ne 80/1 Doubled Yarn on TFO Ne. 50/2, 56/2, 66/2, 74/2 and 80/2 Gassed Yarn Ne.40/2 to 80/2 Compact spun yarn for Weaving Ne 40/1 to Ne. 60/1 Fancy yarn, Normal Slub yarn, Reverse Slub yarn Ne 24/1 to Ne 60/1 for Knitting and Weaving Open End Spun Yarn Ne 2 to Ne 10 PolyesterSewing Thread Bulk cones in raw white and optic white as per shade card Around 600 shades have been manufactured with the help of shade card leaf lot Polyester sewing yarn ranges from Ne 20/2, 20/3, 48/2, 55/2, 55/3 and 60/3
- 16. P a g e 16 | 57 Corporate / Central office Corporate office is situated at “Suprem” P.B No: 7161737, Pulikulam Road, Coimbatore-641 045.Corporate office deals with raw material purchase, testing, approval and allotment to group mills. In addition to that finalization of sales contract, approval of production- planning, policy decisions etc. are also taken at corporate office. A-Unit Unit A is located at Kanjikode west, Palghat, Kerala and was established in the year 1964.the area used is 2 Hectors surrounded by 15 Hectors of its own land. Present Spendlage of the Factory is 57600,working 24 hours in a day and 7 days in a week and Spinning Hosiery yarns, warp and weft yarns and doubled yarns counts ranging from 30s to 100s combed and cradle varieties. All are ring spun yarns only. B-Unit B unit is at Kodigerahalli, H.S.Mandir, Hindupur (post), and Andhra Pradesh and won established in the year 1983.Mill is located in an area of around 5 Hectars. Present installed capacity of the mill is 72000 spindles engaged in manufacturing of ring spun yarn and working 24 hours a day and 7 days a week continuously. Precot“B” at Glance Precot Meridian Limited ‘B’ unit was established near Kodigenahalli, Hindupur, as ‘Precot Mills Limited’ on 26th March 1983, with an installation capacity of 28,800 spindles which was expanded to 51,840 spindles in 1991. It is nearly 5-kms from Hindupur. The founder of Precot Meridian was late Sri. N.Damodaran Garu. Meridian Industries Limited has been merged with Precot Mills Limited with effect from 01st April, 2006. Today the company covered in 50 acres area. Around the company a lush green was developed so as to make the environment free from pollution. The total number of employees working in the Precot meridian are 1400 out of which 60 are staff, 641 are permanent, 525 casual workers and 174 are scheme workers. The Precot has symbolized Quality and Trust in the textile industry with four decades of spinning experience and a diverse range of products that includes cotton yarns, sewing threads, fabrics and garments; Precot is the one of the few totally integrated textile players with a total turnover of 90 million US dollars Company is recently awarded with “Parivathan Sustainability Awards 2011” For “Water conservation through leadership” from textile and apparel sector. C-Unit
- 17. P a g e 17 | 57 C-Unit is at Chandrapuram, Walayar Dam (post), Palghat (Dist), Kerala. Unit was established in the year 1992.Factory is build up in an area of 9600 square meter. Present spindlage of the unit is 24720 company produces yarn ranging between 20s Ne to 40s Ne in both 100% Cotton Combed varieties to suit different end uses. At present the yarn produced from the mil is being widely used for knitting (Banians and Knitwear). D-Unit D-Unit is situated at Chandrapuram, Walayar Dam (post), Palghat (Dist), Kerala and was established in the year 1995. This is located in an area of around 5.3 Hectors. Present capacity of the factory is 1344 rollers, manufacturing yarn ranging between 60s Ne in both 100% Cotton and Processed wastes in carded and combed varieties to suit different end uses. At present the yarn produced from the mill is being widely used for Industrial fabrics and bed sheets. About Precot C 1. Founder of the Group: Sri.V.N Ramachandran (Late) Sri.N.Damodaran 2. Chairman &Managing Director: Sri.D.Sarath Chandran 3. Starting of the Mill: January 92 4. Total Spindles Installed: 24288 Spindles (23*1056) 5. Raw-material: Cotton and Polyster staple fiber 6. Count of yarn processed: 20s to 40s cotton combed knitting yarn 7. End use of products: Sportswear, Casual wears 8. Raw-material used: Raw cotton, Polysters staples 9. Exporting countries: U.K, Germany, Isreil ,Mauritius, Singapore, Malaysia and Portugal 10. Number of workers in the mill: 126 permanent workers About Precot D 1. Mill started on: October 95 2. Total rolors installed: 1344 (7*192) 3. Count of yarn manufactured: 10s OE,16s OE, 20s OE 4. End use of products: Weaving, knitting 5. Raw-material used: Raw cotton and Noils/Flat strips 6. Yarn sold in Local: 30% Export: 70%
- 18. P a g e 18 | 57 Board of Directors The company has a very balanced structure of the board of directors, which primarily takes care of the business needs and stakeholders' interest. The composition of the board also complies with the provisions of section 149 of the Act, and regulation 17 of the listing regulation. The board comprises of eleven directors which includes three executives and eight non- executive directors as on 31-Mar-2016. During the year 2015-16, the board of directors met five times at the registered office of the company on 15-May-2015, 07-Aug-2015, 06-Nov-2015, 09-Feb-2016 and 18-Mar-2016. The last annual general meeting (AGM) was held on 28-Aug-2015.
- 19. P a g e 19 | 57 Composition of directors and their attendance Name of the director Category Attendance No. of director ships in other compani es* No. of committees** Boar d Meeti ngs Las t AG M Mem ber Chair man D Sarath Chandran (DIN : 00001885) Chairman - Executive – Promoter 5 Yes 6 3 - Vijay Mohan (DIN : 00001843) Non-Executive – Promoter 4 No 6 2 - Sumanth Ramamurthi (DIN : 00002773) Non-Executive – Independent 5 No 7 1 - A Ramkrishna (DIN : 00001886) Non-Executive – Independent 5 Yes 4 - 2 Jairam Varadaraj (DIN : 00058056) Non-Executive – Independent 4 No 8 3 1 Ashwin Chandran (DIN : 00001884) Vice Chairman and Managing Director - Executive - Promoter 5 Yes 4 1 - Vijay Venkatasamy (DIN : 00002906) Non-Executive – Independent 5 No 4 1 1 C N Srivatsan (DIN : 00002194) Non-Executive – Independent 5 No 1 2 - Suresh Jagannathan (DIN : 00011326) Non-Executive – Independent 3 No 3 2 - Prashanth Chandran (DIN : 01909559) Joint Managing Director - Executive – Promoter 4 Yes 1 - -
- 20. P a g e 20 | 57 Organization Structure Managing Director Executive Director Financial Purchase Production Marketing Public Manager Manager Manager Manager Relation Officer Production Machine Quality Supervisor Technician Control Officer Foreman Machine Operator Lab Technician
- 21. P a g e 21 | 57 Research Methodology Objectives of the study This study is mainly focused to examine to the overall financial variability of Precot Meridian. Ltd has started below To analyze the change in the financial position over a span of five years. To evaluate the financial position of the company in terms of solvency, profitability, turnover and earnings ratios. To suggest effective measures in the existing system of the company. Scope of the Study The study has great significance and provide benefits to various parties who directly or in directly interact the company. It is benefits to the top management of the company by providing crystal clear picture regarding to the important financial aspects of the Precot Meridian .Ltd 1. The study mainly attempts to analyse the financial performance of the company selected for the study. The financial authorities can use this for evaluating their performance in future, which will help to analyse financial statements and help to apply the resources of the company properly for the development of the company and IT employees to bring overall growth. Need For the Study • The study mainly attempts to analyse the financial performance of the company selected for the study. The financial authorities can use this for evaluating their performance in future, which will help to analyse financial statements and help to apply the resources of the company properly for the development of the company and IT employees to bring overall growth Research Design In view of the objective of the study listed above an exploratory research design has been adopted. Exploratory research is one which is largely interprets already available
- 22. P a g e 22 | 57 information and it lays particular emphasis on analysis and interpretation of the existing and interpretation of the existing and available information it makes use of secondary data. Sources of Data The data collected related to the study was divided into two parts. 1. Primary data 2. Secondary data Primary data The primary data was collected mainly with the interactions and discussions with the company’s executives. Secondary data Secondary data refers to data that was collected by someone other than the users. Common sources of secondary data for social science include censuses, information collected by government departments, organisational records and data that was originally collected for other research purposes. Company’s annual report Company’s website Manual Limitations of the study The research is confined with the time limitation for one month the study is one for academic purpose and cannot be generalized to the entire industry. The research is confined with the time limitation for one month the study is one for academic purpose and cannot be generalized to the entire industry. All statement is prepared by financial accounted any analysis done and conclusion reached is influence by personal judgment.
- 23. P a g e 23 | 57 1. Liquidity Ratios: a. Current Ratio: This is the most widely used ratio. It is the ratio of current assets and current liabilities. It shows a firm’s ability to cover its current liabilities with its current assets. Generally 2: 1 is considered ideal for a concern Le. Current assets should be twice of the current liabilities. If the current assets are two times of the current liabilities, there will be no adverse effect on business operations when the payment of current liabilities is made. If the ratio is less than 2, difficulty may be experienced in the payment of current liabilities and day to day operation of the business may suffer if the ratio higher then to it is very comfortable for the creditor but, for the business concern, it is indicator of the idle funds a lack of enthusiasm for work. It is calculated as follows: Current Ratio = 𝐂𝐮𝐫𝐫𝐞𝐧𝐭 𝐀𝐬𝐬𝐞𝐭𝐬 𝒄𝒖𝒓𝒓𝒆𝒏𝒕 𝒍𝒊𝒂𝒃𝒊𝒍𝒊𝒕𝒊𝒆𝒔 Current Assets: Inventories Sundry Debtors Cash & Bank Balances Loans & Advances Current liabilities: Creditors Bank Overdraft Other Current Liabilities and Provisions
- 24. P a g e 24 | 57 Table: 4.1.1 Current Ratio Years Current assets Current liabilities Current ratio 2012-13 247.28 106.81 2.31 2013-14 297.17 130.12 2.28 2014-15 219.86 99.12 2.21 2015-16 216.1 116.65 1.85 2016-17 237.41 142.95 1.66 Graph: 4.1.1 Current Ratio Interpretation The firm’s current ratio refers that the company’s short-term solvency. The standard current ratio is 2:1; the current ratio is not equal to standard ratio in the entire study period from 2012-13 to 2016-2017.the ratio is too low then the standard ratio 2:1.the above chart indicates that the current ratio of the PRECOT MERIDIAAN LIMITED is decreased year by year except in the year 2014-15 because of high current liabilities. 0 0.5 1 1.5 2 2.5 2012-13 2013-14 2014-15 2015-16 2016-17 2.31 2.28 2.21 1.85 1.66 YEARS Current ratio
- 25. P a g e 25 | 57 b. Quick ratio (or) Acid test ratio: This is the ratio of liquid assets to liquid liabilities. It shows a firm’s ability to meet current liabilities with its most liquid or quick assets. The standard ratio 1: 1 is considered ideal ratio for a concern. Liquid assets are those, which can be easily converted into cash within a short period of time without loss of value. This ratio can be calculated by using the formula. Quick Ratio = 𝒒𝒖𝒊𝒄𝒌 𝑨𝒔𝒆𝒕𝒔−𝑰𝒗𝒗𝒆𝒏𝒕𝒓𝒊𝒆𝒔 𝒒𝒖𝒊𝒄𝒌 𝑳𝒊𝒂𝒃𝒊𝒍𝒊𝒕𝒊𝒆𝒔 Quick assets I: Sundry Debtors, Cash & Bank Balance Loans & Advances Table: 4.1.2 Quick Ratio years QUICK ASSETS QUICK LIABILITIES QUICK RATIO 2012-13 98.61 102.61 0.68 2013-14 110.64 124.8 0.76 2014-15 122.39 96.22 1.27 2015-16 87.68 114.09 0.88 2016-17 89.67 131.86 0.96
- 26. P a g e 26 | 57 Graph: 4.1.2 Quick Ratio Interpretation: From the above table, we see that the quick ratio was standard during the study period. The ratio was 0.68 1 in 2013, which increased to 1.27 in 2015. The highest liquid ratio was recorded as 1.27 during the year 2014-15, which is also higher than the standard ratio that is 1: 1. 0 0.2 0.4 0.6 0.8 1 1.2 1.4 2012-13 2013-14 2014-15 2015-16 2016-17 0.68 0.76 1.27 0.88 0.96 YEARS Quick Ratio
- 27. P a g e 27 | 57 Cash Ratio The cash ratio is the ratio of a company's total cash and cash equivalents to its current liabilities. The metric calculates a company's ability to repay its short-term debt; this information is useful to creditors when deciding how much debt, if any, they would be willing to extend to the asking party. The cash ratio is generally a more conservative look at a company's ability to cover its liabilities than many other liquidity ratios because other assets, including accounts receivable, are left out of the equation Cash ratio= 𝐶𝑎𝑠ℎ 𝑜𝑟 𝐵𝑎𝑛𝑘 𝑏𝑎𝑙𝑎𝑛𝑐𝑒 𝐶𝑢𝑟𝑟𝑒𝑛𝑡 𝑙𝑖𝑎𝑏𝑖𝑙𝑖𝑡𝑖𝑒𝑠 Table: 4.1.3 Cash Ratio Years Cash Current liabilities Cash ratio 2012-13 10.36 106.81 0.09 2013-14 3.66 130.12 0.02 2014-15 3.09 99.12 0.03 2015-16 2.66 116.65 0.02 2016-17 4.83 142.95 0.03
- 28. P a g e 28 | 57 Graph: 4.1.3 Cash Ratio Interpretation High cash ratio indicates the ideal cash resaves in the company but lo cash ratio is not favorable to company by studying the above data The Company has in sufficient cash reserves with it. In the study period company’s average cash ratio is 2012-13 year is 0.09 only. It has to maintain the fluctuation of cash ratio. 0 0.01 0.02 0.03 0.04 0.05 0.06 0.07 0.08 0.09 2012-13 2013-14 2014-15 2015-16 2016-17 0.09 0.02 0.03 0.02 0.03 AxisTitle Axis Title Cash ratio
- 29. P a g e 29 | 57 Debt- Equity Ratio: The Debt-Equity measures the long term financial solvency of a business concern. The ratio is Also popularly known as external internal equity ratio. This ratio relates the owner’s stake in the Business vis-à-vis that of outsides. Alternatively it reflects the relative claims of creditors and share Holders against the asset of the unit. This ratio can also be viewed as indicating the relative proportion Of debt amends equity in financing the assets of the business unit. Debt-equity (DE) ratio is directly computed by dividing total debt by net worth: Debt equity= 𝐷𝑒𝑏𝑡 𝐸𝑞𝑢𝑖𝑡𝑦(𝑁𝑒𝑡 𝑤𝑜𝑟𝑡ℎ) Table: 4.2.1 Debt Equity Ratio: 4.2.1 Years Debt Equity Debt equity ratio 2012-13 399.4 139.75 2.85 2013-14 403.29 160.01 2.52 2014-15 339.75 134.65 2.52 2015-16 351.93 79.14 4.44 2016-17 315.59 79.46 3.97
- 30. P a g e 30 | 57 Graph: 4.2.1 Debt Equity Ratio Interpretation: Debt-Equity ratio of the company is fluctuating year by year. It various from 2015-16 ratio is High i.e.…, 4.44 and remaining years 2012-13-2.85, 2013-14-2.52, 2014-15-2.52, 2016-17-3.97 this years are fluctuated the ratio 0 0.5 1 1.5 2 2.5 3 3.5 4 4.5 2012-13 2013-14 2014-15 2015-16 2016-17 2.85 2.52 2.52 4.44 3.97 YEARS Debt equity ratio
- 31. P a g e 31 | 57 Proprietary Ratio The proprietary ratio (also known as net worth ratio or equity ratio) is used to evaluate the soundness of the capital structure of a company. It is computed by dividing the stockholders’ equity by total assets. Proprietary ratio = 𝑺𝒉𝒂𝒓𝒆 𝒉𝒐𝒍𝒅𝒆𝒓𝒔 𝒇𝒖𝒏𝒅𝒔 𝑻𝒐𝒕𝒂𝒍 𝑨𝒔𝒔𝒆𝒕𝒔 Table: 4.2.2 Proprietary Ratio Years Shareholders fund or Net worth Total Assets Proprietary Ratio 2012-13 139.75 539.18 0.25 2013-14 160.01 563.28 0.28 2014-15 134.65 474.39 0.28 2015-16 79.14 431.08 0.18 2016-17 79.46 395.05 0.2
- 32. P a g e 32 | 57 Graph: 4.2.2 Proprietary Ratio Interpretation: Proprietary ratio is in the year of 2013-14, 2014-15 are equal in the ratio of 0.28, and remaining years are fluctuating. A low Proprietary include greater risk for the company. 0 0.1 0.2 0.3 2012-13 2013-14 2014-15 2015-16 2016-17 0.25 0.28 0.28 0.18 0.2 AxisTitle Years ProprietaryRatio
- 33. P a g e 33 | 57 Debt Ratio The debt ratio compares a company's total debt to its total assets. This provides creditors and investors with a general idea as to the amount of leverage being used by a company. The lower the percentage, the less leverage a company is using and the stronger its equity position. In general, the higher the ratio, the more risk that company is considered to have taken on. Debt Ratio= 𝑇𝑜𝑡𝑎𝑙 𝐷𝑒𝑏𝑡 𝐶𝑎𝑝𝑖𝑡𝑎𝑙 𝑒𝑚𝑝𝑙𝑜𝑦𝑒𝑑 Table: 4.2.3 Total Debt Years Total debt Capital employed Total debt Ratio 2012-13 399.4 432.37 0.92 2013-14 403.29 433.16 0.93 2014-15 339.75 375.27 0.9 2015-16 351.93 314.43 1.11 2016-17 315.59 252.1 1.25
- 34. P a g e 34 | 57 Graph: 4.2.3 Total Debt Ratio Interpretation: The average debt ratio from the study period 2016-17 is 1.25, it means the owners have provide remaining finance of 44.7% which is lower than the standard ratio. 0 0.2 0.4 0.6 0.8 1 1.2 1.4 2012-13 2013-14 2014-15 2015-16 2016-17 0.92 0.93 0.9 1.11 1.25 AxisTitle YEARS Total debt Ratio
- 35. P a g e 35 | 57 Fixed Assets Turnover Ratio 1. The firm may wish to know its efficiency of utilizing fixed assets and current assets separately Fixed assets turnover Ratio= 𝑆𝑎𝑙𝑒𝑠 𝐹𝑖𝑥𝑒𝑑 𝑎𝑠𝑠𝑒𝑡𝑠 Table: 4.3.1 Fixed Assets Turnover Ratio Years Sales Net fixed assets or net block Fixed assets turnover ratio 2012-13 667.17 208.33 3.2 2013-14 738.19 363.65 2.02 2014-15 731.61 335.22 2.18 2015-16 683.69 313.23 2.18 2016-17 679.3 279.02 2.43
- 36. P a g e 36 | 57 Graph: 4.3.1 Fixed Assets Turn Over Ratio INTERPRETATION: The above table shows the Fixed Asset Ratio during the study period. The Lowest Ratio was recorded as 2.02 in 2013-14 and the highest ratio was recorded as 3.2 in 2012-13. It means the firm does not raised adequate long-term funds to meet its Fixed Asset requirements. 0 1 2 3 4 2012-13 2013-14 2014-15 2015-16 2016-17 3.2 2.02 2.18 2.18 2.43 AxisTitle Years Fixed assets turn over ratio
- 37. P a g e 37 | 57 TotalAssets Turnover Ratio Asset turnover ratio measures the value of a company’s sales or revenues generated relative to the value of its assets. The Asset Turnover ratio can often be used as an indicator of the efficiency with which a company is deploying its assets in generating revenue. Asset Turnover = 𝑆𝑎𝑙𝑒𝑠 𝑇𝑜𝑡𝑎𝑙 𝑎𝑠𝑠𝑒𝑡𝑠 Table: 4.3.2 Total Assets Turnover Ratio Years Sales Total assets Total Assets turnover ratio 2012-13 667.17 539.18 1.24 2013-14 738.19 563.28 1.31 2014-15 731.61 474.39 1.54 2015-16 683.69 431.08 1.59 2016-17 679.3 395.05 1.72
- 38. P a g e 38 | 57 Graph: 4.3.2 Total Assets Turnover Ratio Interpretation The high turnover ratio tells the efficiency of the management and utilization of assets. The low turnover ratios are indicative of underutilizing of available resources and presence of idle capacity. The total asset turnover ratio is gradually increasing from 2012- 13 to 2016-17 it shows the firm maximum utilization of its assets. 0 0.5 1 1.5 2 2012-13 2013-14 2014-15 2015-16 2016-17 1.24 1.31 1.54 1.59 1.72 AxisTitle Years TotalAssets turnover ratio
- 39. P a g e 39 | 57 Net Working Capital Turnover Ratio: Working capital turnover is a measurement comparing the depletion of working capital used to fund operations and purchase inventory, which is then converted into sales revenue for the company. The working capital turnover ratio is used to analyze the relationship between the money that funds operations and the sales generated from these operations. For example, a company with current assets of $10 million and current liabilities of $9 million has $1 million in working capital, which may be used in fundamental analysis Net Working Capital Turnover Ratio= 𝑆𝑎𝑙𝑒𝑠 𝑁𝑒𝑡 𝑤𝑜𝑟𝑘𝑖𝑛𝑔 𝑐𝑎𝑝𝑖𝑡𝑎𝑙 Table: 4.3.3 Net Working Capital Turnover Ratio Years Net sales net working capital Working capital turnover ratio 2012-13 667.17 140.47 4.74 2013-14 738.19 167.05 4.41 2014-15 731.61 120.74 6.05 2015-16 683.69 99.45 6.87 2016-17 679.3 94.46 7.19
- 40. P a g e 40 | 57 Graph: 4.3.3 Net Working Capital Turnover Ratio Interpretation: The net working capital turnover ratio shows the amount of sales generated with the investments in the Net working capital. The net working capital turnover ratio of the company is increasing which signifies that the company is able to utilize its net working capital effectively in generated the sales. The working capital turnover ratio is highly increased in 2016-17 so the company has to maintain the stability. 0 1 2 3 4 5 6 7 8 2012-13 2013-14 2014-15 2015-16 2016-17 4.74 4.41 6.05 6.87 7.19 AxisTitle Axis Title Net Working capital turn over ratio
- 41. P a g e 41 | 57 Debtors Turn Over Ratio: The receivables turnover ratio is an accounting measure used to quantify a firm's effectiveness in extending credit and in collecting debts on that credit. The receivables turnover ratio is an activity ratio measuring how efficiently a firm uses its assets. Receivables turnover ratio can be calculated by dividing the net value of credit sales during a given period by the average accounts receivable during the same period. Average accounts receivable can be calculated by adding the value of accounts receivable at the beginning of the desired period to their value at the end of the period and dividing the sum by two. Debtors Turn Over Ratio= 𝑵𝒆𝒕 𝒄𝒓𝒆𝒅𝒊𝒕 𝒔𝒂𝒍𝒆𝒔 𝑨𝒗𝒆𝒓𝒂𝒈𝒆 𝑫𝒆𝒃𝒕𝒐𝒓𝒔 Table: 4.3.4 Debtors Turnover Ratio Years Total sales Closing stock or Inventory Debtors turnover ratio 2012-13 667.17 148.67 4.48 2013-14 738.19 186.53 3.95 2014-15 731.61 97.47 7.5 2015-16 683.69 128.42 5.32 2016-17 679.3 147.74 4.59
- 42. P a g e 42 | 57 Graph: 4.3.4 Debtors Turnover Ratio Interpretation Debtor’s turnover ratio indicates the number of times sales to its debtors each year the higher the value of debtors turnover the more efficient is the management of credit. The Debtors turnover ratio of the company is decreasing which signifies that the company is not able to manage its debtor’s efficiency. From the above table and chart it can be known that the year 2012-13 and 2013-14 will be decreased then 2014-15 again will be increased. 0 2 4 6 8 2012-13 2013-14 2014-15 2015-16 2016-17 4.48 3.95 7.5 5.32 4.59 AxisTitle Years Debtors turn over ratio
- 43. P a g e 43 | 57 Inventory Turnover Ratio Inventory turnover is a ratio showing how many times a company's inventory is sold and replaced over a period of time. The days in the period can then be divided by the inventory turnover formula to calculate the days it takes to sell the inventory on hand. It is calculated as sales divided by average inventory. Inventory Turnover Ratio= 𝑪𝒐𝒔𝒕 𝒐𝒇 𝒈𝒐𝒐𝒅𝒔 𝒔𝒐𝒍𝒅 𝑨𝒗𝒆𝒓𝒂𝒈𝒆 𝒊𝒏𝒗𝒆𝒏𝒕𝒐𝒓𝒚 Table: 4.3.5 Inventory Turnover Ratio Years Cost of goods sold Average inventory or Average stock Inventory turnover ratio 2012-13 574.99 140.42 4.09 2013-14 699.03 167.6 4.7 2014-15 674.68 142 4.75 2015-16 672.14 112.94 5.95 2016-17 649.86 138.08 4.7 .
- 44. P a g e 44 | 57 Graph: 4.3.5 Inventory Turnover Ratio Interpretation: Usually a high inventory turnover ratio indicates efficient management of inventory because more frequently the stock are sold, the lesser amount of money is required to finance the inventory. The inventory ratio in the financial year 2013-14 is 4.7 & 2014-15 is 4.75 & 2015-16 is 5.95 they increased year by year. In 2016-17 the ratio will be decreased at 4.7. 0 1 2 3 4 5 6 2012-13 2013-14 2014-15 2015-16 2016-17 4.09 4.7 4.75 5.95 4.7 AxisTitle Years Inventary turn over ratio
- 45. P a g e 45 | 57 Net Profit Ratio The net profit percentage is the ratio of after-tax profits to net sales. It reveals the remaining profit after all costs of production, administration, and financing have been deducted from sales, and income taxes recognized. As such, it is one of the best measures of the overall results of a firm, especially when combined with an evaluation of how well it is using its working capital. The measure is commonly reported on a trend line, to judge performance over time. It is also used to compare the results of a business with its competitors. Net profit is not an indicator of cash flows, since net profit incorporates a number of non- cash expenses, such as accrued expenses, amortization, and depreciation. The formula for the net profit ratio is to divide net profit by net sales, and then multiply by 100. The formula is: Net Profit Ratio= 𝑷𝒓𝒐𝒇𝒊𝒕 𝒂𝒇𝒕𝒆𝒓 𝒕𝒂𝒙 𝑵𝒆𝒕 𝒔𝒂𝒍𝒆𝒔 Table: 4.4.1 Net Profit Ratio Years Net profit Net sales Net profit Ratio 2012-13 76.06 667.17 11.4 2013-14 80.82 738.19 10.94 2014-15 20.89 731.61 2.85 2015-16 28.59 683.69 4.81 2016-17 28 679.3 4.12
- 46. P a g e 46 | 57 Graph: 4.4.1 Net Profit Ratio Interpretation The above table shows the net profit percentage. 2012-13 the net profit is high in the year 2013-14 decrease few percentage. And 2014-15 net profit decreased compare to previous year. The company maintaining the smooth growth percentage in net profit. 0 2 4 6 8 10 12 2012-13 2013-14 2014-15 2015-16 2016-17 11.4 10.94 2.85 4.81 4.12 AxisTitle Years Net profitRatio
- 47. P a g e 47 | 57 Gross Profit Ratio Gross profit margin is a financial metric used to assess a company's financial health and business model by revealing the proportion of money left over from revenues after accounting for the cost of goods sold (COGS). Gross profit margin, also known as gross margin, is calculated by dividing gross profit by revenues. Also known as "gross margin." Gross Profit Ratio= 𝑮𝒓𝒐𝒔𝒔 𝒑𝒓𝒐𝒇𝒊𝒕 𝑵𝒆𝒕 𝒔𝒂𝒍𝒆𝒔 Table: 4.4.2 Gross Profit Ratio Years Gross profit Net sales Gross profit ratio 2012-13 92.18 667.17 13.81 2013-14 39.16 738.19 5.3 2014-15 56.93 731.61 7.78 2015-16 11.55 683.69 1.68 2016-17 29.44 679.3 4.33
- 48. P a g e 48 | 57 Graph: 4.4.2 Gross Profit Ratio Interpretations The above table shows the Gross Profit Ratios. The Highest Gross Profit Ratio was recorded as 13.81 in 2012-13 and the Lowest Gross Profit Ratio was recorded as 1.68 in 2015-16 by seeing this ratio, we can say that the Gross Profit of the Firm is bad because the cost of goods sold is fluctuating every year. 0 2 4 6 8 10 12 14 2012-13 2013-14 2014-15 2015-16 2016-17 13.81 5.3 7.78 1.68 4.33 AxisTitle Years Gross profit ratio
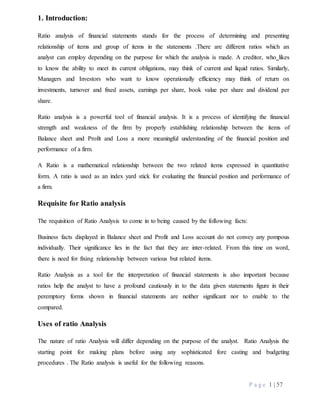
- 49. P a g e 49 | 57 Operating Profit Ratio Operating Profit margin measures how much profit a company makes on a dollar of sales, after paying for variable costs of production such as wages and raw materials, but before paying interest or tax. It is calculated by dividing a company’s operating profit by its net sales. Operating Profit Ratio= 𝑶𝒑𝒆𝒓𝒂𝒕𝒊𝒏𝒈 𝒑𝒓𝒐𝒇𝒊𝒕 𝑵𝒆𝒕 𝒔𝒂𝒍𝒆𝒔 Table: 4.4.3 Operating Profit Ratio Years Operating cost Net sales Operating profit Ratio 2012-13 76.06 667.17 0.11 2013-14 80.82 738.19 0.1 2014-15 20.89 731.61 0.02 2015-16 28.59 683.69 0.04 2016-17 28 679.3 0.04
- 50. P a g e 50 | 57 Graph: 4.4.3 Operating Profit Ratio Interpretation: Higher operating profit ratio indicates better performance and lower operating profit ratio is unfavorable. By seeing the graph it is clear that the company’s performance is high in the year 2012-13 – 0.11 and it decreased year by year. 0 0.05 0.1 0.15 2012-13 2013-14 2014-15 2015-16 2016-17 0.11 0.1 0.02 0.04 0.04 AxisTitle Years Operatingprofit ratio
- 51. P a g e 51 | 57 Return on Equity Capital Return on equity (ROE) is the amount of net income returned as a percentage of shareholders equity. Return on equity measures a corporation's profitability by revealing how much profit a company generates with the money shareholders have invested. ROE is expressed as a percentage and calculated as: Net income is for the full fiscal year (before dividends paid to common stock holders but after dividends to preferred stock.) Shareholder's equity does not include preferred shares. Return on Equity Capital= 𝑷𝒓𝒐𝒇𝒊𝒕 𝒂𝒇𝒕𝒆𝒓 𝒕𝒂𝒙 𝑵𝒆𝒕 𝒘𝒐𝒓𝒕𝒉 𝑿𝟏𝟎𝟎 Table: 4.5.1 Return on Equity Capital Years Profit after tax Net worth Return on equity 2012-13 20.69 139.75 14.8 2013-14 30.45 160.01 19.03 2014-15 -32.64 134.65 -24.24 2015-16 -55.51 79.14 -70.14 2016-17 0.32 79.46 0.4
- 52. P a g e 52 | 57 Graph: 4.5.1 Return on Equity Capital Interpretation: The return on equity shows the amount of return earned for the equity shareholders. If the return on equity is constant it indicates that the investments in the company is unfavorable and if the return is low it is not favorable to invest the return on equity of the company is fluctuating from year to year. -80 -60 -40 -20 0 20 2012-13 2013-14 2014-15 2015-16 2016-17 14.8 19.03 -24.24 -70.14 0.4 AxisTitle Years Return on equity Capital
- 53. P a g e 53 | 57 Return on Investment Return on Investment (ROI) is a performance measure, used to evaluate the efficiency of an investment or compare the efficiency of a number of different investments. ROI measures the amount of return on an investment, relative to the investment’s cost. To calculate ROI, the benefit (or return) of an investment is divided by the cost of the investment. The result is expressed as a percentage or a ratio. The return on investment formula: ROI = (Gain from Investment - Cost of Investment) / Cost of Investment In the above formula, "Gain from Investment” refers to the proceeds obtained from the sale of the investment of interest. Because ROI is measured as a percentage, it can be easily compared with returns from other investments, allowing one to measure a variety of types of investments against one another. Return on Investment= 𝑷𝑩𝑰𝑫𝑻 𝑻𝒐𝒕𝒂𝒍 𝒂𝒔𝒔𝒆𝒕𝒔 𝒐𝒓 𝑵𝒆𝒕 𝒂𝒔𝒔𝒆𝒕𝒔 X100 Table: 4.5.2 Return on Investment Years PBDIT Net Assets or Net Block Return on investment 2012-13 89.38 208.33 42.9 2013-14 92.38 363.65 25.4 2014-15 38.1 335.22 11.36 2015-16 20.14 33.23 6.42 2016-17 73.11 279.02 20.26
- 54. P a g e 54 | 57 Graph: 4.5.2 Return on Investment Interpretation: Low return on investment implies efficient use of assets, the companies return on investment is decreasing year by year. 0 10 20 30 40 50 2012-13 2013-14 2014-15 2015-16 2016-17 42.9 25.4 11.36 6.42 20.26 Years Return on investment
- 55. P a g e 55 | 57 Findings The firm’s Current ratio refers that the company’s short-term solvency. The standard current ratio is 2:1; the current ratio is not equal to standard ratio in the entire study period from 2012-13 to 2016-2017.the ratio is too low then the standard ratio 2:1.the above chart indicates that the current ratio of the decreased year by year except in the year 2014-15 because of high current liabilities. The Quick ratio indicates the ability of the company to meet its current liabilities in time. The company’s quick ratio standard ratio is 1:1 in the year 2014-15 is equal to ideal ratio But Before and previous year are fluctuated and is not equal to ideal ratio. The company’s performance is high in the year 2012-13 and 2015-16. The Gross profit ratio is more than the 100% of normal profit. Here the company is maintaining good gross profits for all years. The net profit ratio shows the portion of net profit earned by the company out of its sales. The company profitability position is not satisfactory but strictly fluctuating from 11.4 to 10.94 and again 2014-15 to 2015-16 2.85 to 4.81 like this. But the net profit ratio is fluctuating. The higher gross profit ratio is increased better performance in 2012-13 is 13.81 and the remaining years it will be decreased low gross profit ratio un favorable. The company gross profit position are fluctuating gross profit ratio. Usually a high inventory turnover ratio indicates efficient management of inventory because more frequently the stock are sold, the lesser amount of money is required to finance the inventory. The inventory ratio in the financial year 2013-14 is 4.7 & 2014-15 is 4.75 & 2015-16 is 5.95 they increased year by year. In 2016-17 the ratio will be decreased at 4.7.
- 56. P a g e 56 | 57 Suggestions The current ratio is decreased in the year 2016-17 of the company. Here the company should not pay the company obligations. The company cannot maintain the standard ratio. The company must be decrease the short term loans then only the company can increase the standard norms. The quick ratio indicates the ability of the company to meet its current liabilities in time. The company’s quick ratio standard ratio is 1:1 in the year 2014-15 is equal to ideal ratio The company’s performance is high in the year 2012-13 to 2016-17 and. The gross profit ratio is more than the 100% of p. Here the company is maintaining good gross profits for all years. The company’s revenue was more than the company’s expenses. Here the company revenue is increased in the present financial year. Debt ratio indicates the proportion of a company's debt to its total assets. It shows the company relies on debt to finance assets. From the period of the study the debt ratio shows the decreasing trend.
- 57. P a g e 57 | 57 Conclusion I am very glad to get my project in the company which is one of the leading company in Coton-Textail industry. I have learnt a lot in this one month period about the company strategies and its objectives, which are going to fulfill all its requirements of the company. I have given my best in this one month span to improve the company’s standards to my best and I really very happy to hear about their customer satisfactory that they were providing good service to the customers. Bibliography WWW.google.com WWW.moneycontrol.com