SlideShare une entreprise Scribd logo
1  sur  24
1
File Operator Report
Jason Lu (jasonlu6@bu.edu)
Supervisor: Jeff Horneback (jeff@drg.com)
Date: July 6th – 24th 2016
Due: July 28th 2016 (extension)
Digital Results Group
Novetta Industries
A) Abstract:
This report summarizes the findings of the file operator project and analyzes the
performance of each selected algorithm. In detail, report lists the following: the average of the
operations / second of each command (‘mkdir’,’rmdir’…’Total_files’), the performance
downgrade and upgrade of each command (in terms of percentage). Finally, the report concludes
with a summary of the observations, and have two Python graphics files to show the aggregate
amount of operations per command and the performance complexity change in comparison to the
baseline file.
The project is split into several distinctive parts:
fileop.py – this file is the main file of the project. It is used to handle all pre-
processing operations and the output of the averages and complexities (in float type form). It also
outputs a very clear template of the output vim table from the Linux fileop directory.
backup.py – this file is a backup of the main output table. In case of a data loss or other
unforeseen circumstance, this file will be able to allow the user to re-use the original values of
the commands, as well as change the values as the user sees fit.
input.py – this file is the starter file of the entire project. It is where the first draft of
the pre-processing files happens. Also, it is where the averages of the commands were first
computed.
graph.py – this file is the first graphics file of the conclusion: it denotes each of the
commands’ file operation (in files / second) average in ROYGBIV color scheme.
graph2.py – this file is the second graphics file of the conclusion: it denotes each of the
commands’ change in performance complexity, by means of both upgrade and downgrade. Note:
Red color denotes downgrade and blue color denotes upgrade in the Graphics window in Python.
graphics.py – this file is the import file that is required to use Zelle Python 3.0
graphics library. The graphs were mainly built through Zelle’s library functions of color,
Text, object, numbers.
To explain in more detail of the parameters of the file operator, here are the general
definitions of each command in the fileop.py output:
mkdir – make a directory from Linux that will create memory storage for the file
rmdir – remove the directory from Linux in which the file was stored (deep copy)
create – create a new sub-directory to store the file
read – read the file selected from the directory
write – write the file selected to the directory
2
close – how many times the file has been closed in the directory
stat – Unix system call to determine how many times the files are rooted to a particular
directory
access – how many times the file has been accessed by the client
chmod – changes the access permissions to the file system objects
readdir – read the directory under a threading stream
link – how many times a file has been linked to a directory or sub-directory
unlink – how many times a file has been un-linked to a directory or sub-directory
Total_files – the total number of files found in the directory
B) Building of the fileop starter and main programs: input, backup, and fileop.py
I) input.py build:
Step 1: Obtain the input and create a value dictionary to hold values
To begin the project completely, I first imported the system import (import sys) to get
data from the Mac Terminal system. Then, I built a value dictionary, that used a for loop
structure that can hold up to 20 values. I initialized my value variable to 0 in the starter
steps, and added an accumulator counter variable to 1.
Step 2: Print out the input table first
Next, I made a print statement of print(“Input table: “). Next, I used a file I/O
command of open the categorized output (cat command in Linux) with the file path of
/Users/jasonlu/fileop/input with the reading of the file denoted as the ‘r’ char in
Python.
I then used a for loop construct to read each line in the file. For each of the line, I
incorporated the Python function of .split() to split each line into a comma-separated
index of a list. Then I printed the lines by stripping the newline of each file with the Python
function of.strip() to get the command averages in proper form.
Lastly, to skip the title part of the file, I used the line data = f.readline().
Step 3: Pre-process the data into float values and calculate the average of the files /
second operations of each command
After adding some white space (for user output legibility), I decided to tackle the task of
computing the command averages. With the Python with construct, I managed to keep
another instance of the file open. Also, since I am computing the average with float data, I
chose the variable fd to mean the file data.
For the command line, I used yet another .readline() function. Next, I split up the
command lines into the name of the command and their values, with the variable second to
designate the location of the second line in the file.
3
I decided to add a for loop structure in the length of the second line in the file. To
calculate the average, I split that task recursively into three distinct steps:
1) Get a deep copy of the value dictionary index in conjunction with a temporary array
index: value[i] = float(temp[i]).
2) Add a for loop and then split the temporary array into separate indexes. After,
accumulate each temporary value to the total value array while updating the counter
variable by 1.
3) Finally, I divided arithmetically (to avoid the hassle of modulus division and
remainder side cases) each index value from the total, thus obtaining each average of
the command file operations in files / second in the float type.
The last step was to print the values of the averages of the command file operations in float form,
with the code print(float(value[i])).
II) backup.py build:
Step 1: Obtain the output and read first line of the output file
I first imported the system import (import sys) to get the data from the Mac Terminal
system. Then, I did an f-open of the pathfile of the fileop output, entitled
‘/Users/jasonlu/fileop/output’,’r’.
Then, I was able to read the first line of the file using the f.readline() method, and
printed out the data. Satisfied with the output of the data, I proceeded to the next step of parsing
the file into a multi-dimensional array.
Step 2: Parse files into a Python list, and replace the comma-separated values of the
list into a readable line of output
Next, I decided to parse the input file into various commands. To read the command, I
used once again the f.readline() method. To split the values in the method, I then added a
new variable called value, whose output displayed a list of comma-separated values, such as
the following:
Output 1.1:
[‘mdkir’, ‘rmdir’, ‘create’, ‘read’, ‘write’, ‘close’, ‘stat’, ‘access’,
‘chmod’, ‘readdir’, ‘link’, ‘unlink’, ‘delete’, ‘Total_files’]
To change the formatting of the string, I then decided to use the.split() method to split
each part of the list into sub-lists. In order to put the list together, I then decided to use Python
String library’s .replace() method, replacing each instance of a comma with a space. I then
used a print statement to print the output in the new comma-delimited format:
Output 1.2:
4
Fileop: File size is 1024, Output is in Ops/sec. (A=Avg, B=Best, W=Worst)
. mkdir rmdir create read write close stat access chmod readdir
link unlink delete Total_files
The next task would be to use for loops to print out the values, and then discarding the
newline within the values.
Step 3: Loop line by line the output and display its results in a multi-dimensional
array
To begin looping the output, I first decided to read each part of the output line by line,
and then strip each part of the newline within the values with the Python I/O library’s .strip()
method.
I repeated the process for all of the lines within the file until the end, using a for loop of
each line in the f.readlines() function. Then I added a print statement casted over the
.strip() method. Now, the output looks like this:
Fileop: File size is 1024, Output is in Ops/sec. (A=Avg, B=Best, W=Worst)
. mkdir rmdir create read write close stat access chmod readdir
link unlink delete Total_files
A 10 795 771 1381 22915 1147 2282 1128 312914 1697 742
579 825 809 1000
A 11 795 771 1381 22915 1147 2282 1128 312914 1697 742
579 825 809 1000
A 12 795 771 1381 22915 1147 2282 1128 312914 1697 742
579 825 809 1000
A 13 795 771 1381 22915 1147 2282 1128 312914 1697 742
579 825 809 1000
A 14 795 771 1381 22915 1147 2282 1128 312914 1697 742
579 825 809 1000
A 15 795 771 1381 22915 1147 2282 1128 312914 1697 742
579 825 809 1000
A 16 795 771 1381 22915 1147 2282 1128 312914 1697 742
579 825 809 1000
A 17 795 771 1381 22915 1147 2282 1128 312914 1697 742
579 825 809 1000
A 18 795 771 1381 22915 1147 2282 1128 312914 1697 742
579 825 809 1000
A 19 795 771 1381 22915 1147 2282 1128 312914 1697 742
579 825 809 1000
Step 4: Get the values of the file output into comma-separated form (for backup file
purposes)
To simplify this task, I decided to break down the steps via procedural decomposition:
5
- Remove first two columns of the output array: to complete this part of the task, I used
the .remove(index of object) method function. The new output, temporarily is:
mkdir rmdir create read write close stat access chmod readdir link
unlink delete Total_files
795 771 1381 22915 1147 2282 1128 312914 1697 742 579
825 809 1000
795 771 1381 22915 1147 2282 1128 312914 1697 742 579
825 809 1000
795 771 1381 22915 1147 2282 1128 312914 1697 742 579
825 809 1000
795 771 1381 22915 1147 2282 1128 312914 1697 742 579
825 809 1000
795 771 1381 22915 1147 2282 1128 312914 1697 742 579
825 809 1000
795 771 1381 22915 1147 2282 1128 312914 1697 742 579
825 809 1000
795 771 1381 22915 1147 2282 1128 312914 1697 742 579
825 809 1000
795 771 1381 22915 1147 2282 1128 312914 1697 742 579
825 809 1000
795 771 1381 22915 1147 2282 1128 312914 1697 742 579
825 809 1000
795 771 1381 22915 1147 2282 1128 312914 1697 742 579
825 809 1000
Next, I focused only on the first row of the output, and decided to solve the problem
using mathematical induction, where the first row and first columns are the base cases. Then,
after seeing the correct outputs from the first row and columns, I expanded the code with double
for loops to traverse the rest of the truncated output array.
In general, via pseudo code and math induction, here is my approach:
Induction strategy to traversing the arrays (using mathematical induction):
Base case: 1 row only, find the average
Base case 2: 1 column only, find the average
Induction Hypothesis: Let P(r,c): “The arbitrary multi-dimensional array of the output
with row r and column c.”
Induction Step: P(r,c)  P(r+1,c+1):  r,c  fileop.py:
For every row in fileop.py:
For every column in fileop.py
Find the index
Encapsulate the value (example: command mkdir has value ‘795’)
Print out the value
6
I began with a test case in my Python console of just having only 1 line of code with
simple counting numbers: row = [1,2,3,4,5,6,7,8,9,10]. Then, I tested out the result by
using the sum(row) / len(row) casted into float form, and got the appropriate average value
of 5.5. Next, I did the same with the columns, and got the same number. Satisfied with the
preliminary results, I applied the console testing to the backup.py file.
I first initialized all of the values of the commands into a list. Then, with a with
statement construct, I managed to read the file with the code fd.readline(), with fd denoting
file directory. For each line in fd, I decided to append each value of the commands onto the
command itself, and then split the line with increased index values. Finally, I used the Python
zip() function to encapsulate all of the values in the 14 columns (mkdir … total_files), and
printed out all of the values of the commands. To avoid an ArrayOutOfBounds Error, I
commented the last two columns of the backup.py output file.
III) fileop.py build
Step 1: Re-format the averages to string form
With both my starter code and backup code complete, I finally began the long task of
building my main file for all pre-processing and calculation of averages and performance
complexity in the fileop.py file.
I started off by basically copying my input.py starter code. Then after adding a white
space, I decided to format the table so that it can be used in terms of a tuple relation. To build the
tuple relation, I first decided to cast the average values into a string form, as the Python
console would throw an TypeError if a float and string were concatenated. Then, with the
original open construct, I first read the line in the file directory with the variable cmd, an
abbreviation of the command line. Next, I split the command line with the command name
variable. Finally, I built a for loop construct that is the range of the length of the temporary
array (initialized in input.py).
The tuple concatenation was printed, in terms of the formatted averages, with this line of
code:
tuple = (name[i] + “ has average of “ + str(float(value[i]) + “ files /
second”).
Lastly, to finish this primary step, I accumulated the counter variable by 1 for each run
of the loop.
Step 2: Determine the baseline averages of each command
To begin the procedure of calculating the baseline average from the baseline.vim file
from the supervisor, I used a with construct to open the file, with the file path in Linux of
/Users/jasonlu/fileop/baseline in the read ‘r’ form under the variable fo to denote file
output.
7
Similar to that in the previous steps, I managed to read the lines in fo.readlines() and
then split the lines and printed them with no whitespaces.
Step 3: Pre-process the averages of each data in the baseline
In order to complete the baseline file operation, I needed to pre-process some data in the
vim baseline file. With yet another with construct, this time under the variable fp to denote the
file pre-processor, I managed to read the first line of the file with the code first =
fp.readline(). To split the first line of the file, I then used a next pointer variable to split the
first line. In order to add to the value array as initialized previous, I looped the variable for the
length of the second line in the baseline file, and then casted the second line index value as the
float. This method allowed me to finally get each baseline value command average as its own,
without the hassle of more file operation functions and time costs.
Step 4: Calculate the performance upgrade / downgrade of the files
Before coding this step, I first did some quick mental math, and came up with a general
piecewise function of how to tell when a performance upgrade or a performance downgrade has
occurred between the initial command average and the baseline file:
Performance =
{
𝑢𝑝𝑔𝑟𝑎𝑑𝑒 𝑖𝑓𝑓
𝑛𝑢𝑚𝑏𝑒𝑟 𝑜𝑓 𝑏𝑎𝑠𝑒𝑙𝑖𝑛𝑒 𝑎𝑣𝑒𝑟𝑎𝑔𝑒 − 𝑣𝑎𝑙𝑢𝑒 𝑜𝑓 𝑐𝑜𝑚𝑎𝑚𝑛𝑑
𝑛𝑢𝑚𝑏𝑒𝑟 𝑜𝑓 𝑏𝑎𝑠𝑒𝑙𝑖𝑛𝑒 𝑎𝑣𝑒𝑟𝑎𝑔𝑒
, 𝑤ℎ𝑒𝑟𝑒 𝑣𝑎𝑙𝑠 < 𝑛𝑢𝑚
𝑑𝑜𝑤𝑛𝑔𝑟𝑎𝑑𝑒 𝑖𝑓𝑓
𝑣𝑎𝑙𝑢𝑒 𝑜𝑓 𝑐𝑜𝑚𝑚𝑎𝑛𝑑 − 𝑛𝑢𝑚𝑏𝑒𝑟 𝑜𝑓 𝑏𝑎𝑠𝑒𝑙𝑖𝑛𝑒 𝑎𝑣𝑒𝑟𝑎𝑔𝑒
𝑣𝑎𝑙𝑢𝑒 𝑜𝑓 𝑐𝑜𝑚𝑚𝑎𝑛𝑑
, 𝑤ℎ𝑒𝑟𝑒 𝑛𝑢𝑚 < 𝑣𝑎𝑙𝑠
To simplify the math, I essentially viewed the performance downgrade as a percent
decrease from the original, and performance upgrade as a percent increase from the original. I
finally converted the fraction to the percent performance by multiplying the int(100).
Step 5: Format the performance upgrades / downgrades and add initializing code
The code fitted nicely with my mathematical piecewise function, and after testing the
values, I decided to simplify the variables, replacing the originally convoluted float cast of the
baseline number index with a simple variable num and likewise the float cast of the value of
command index with the simple variable vals. Finally, on top of the performance piecewise
function, I skipped the first line of the baseline file, and split the second with a number indicator
variable.
To finish off the fileop.py file, I added three print statements: if a command has
performance upgrade, the program will print out “Performance upgrade of : +
str(up_percent) + “%”. Likewise, it will print out “Performance downgrade of : +
str(down_percent) + “%” for performance downgrades. If on the rare case no change occurs,
the program prints out “No change in command complexity.”
8
C) Build of the graphics files to graph out averages and performance complexities
Part I: The build and diagram output of graph.py
After completing the mathematical part of fileop.py, I brushed up on some Zelle Python
graphics during the time off and then decided to display my results of the project in a simple 2-
dimensional Python graphics bar graph.
In order to use Zelle’s graphics functions, I first imported the entire graphics class with
the code from graphics import *.
I built a Python graphics window named “Command Averages”, and to the
specifications of the project, made it a square of 800 pixels on each side. I then set the
background color to white , for clarity purposes.
In order to allow the user to interact with the graph with the mouse, I added a mouser
pointer with the function win.getMouse(). I then decided to build the labels of the graph,
starting from the point (20,50) and increased each increment of 50 pixels to be an additional
50,000 files / second operations added, thus creating my 1000:1 ratio of files /s to pixel, which
would be vital to determining the bar graph heights.
To make sure Python actually drew the labels, I called the win.getMouse() function
again.
Here is the general skeleton for what I used to draw the bar graphs (14 of them total, each
one representing the average commands of each command in the fileop):
height = (# of files / second / 500,000) * 1000
command = Rectangle(Point(x+40,450), Point(y+40,450-height)
// red, orange, yellow, green, blue, blue2, purple, in that order
command.setFill(‘ROYGBIV’ color)
command.setWidth(2) // default width
command.draw(win)
Then, after each command has its own bar graph drawn out accurately, I finalized the
graph.py with the following skeleton for the text interface:
Label = Text(Point(x+40), “command”)
Label.draw(win)
The program is wrapped up with a final win.getMouse() and the user can click once
more, to activate the .close() function and end interaction with the program. I concluded the
coding of graph.py with a main() declaration decreased indent call.
Diagram output: (via screensaver from my Mac):
9
Note: The Diagram is not drawn to absolute scale, and that some of the commands’ coloring
scheme may be lacking in detail.
Part II: The build and diagram output of graph2.py
I decided to then tackle the final part of the project, which is the graphing of performance
upgrade and downgrades of each file command in comparison to the baseline averages (or
essentially, the file operation average vs. baseline average).
10
Similar to before, I imported the graphics library with the from graphics import * in order
to use the graphics interface objects. Next, I printed a general description of all graph, which
states “This graph will show the performance upgrades and performance downgrades
of each command between fileop and baseline.”
Afterwards, I made a new graphics window, entitled “Performance Complexity”, and gave it a
dimension of 800 * 800 pixels. Then, for clarity purposes, much like the the first graphics Python
file, I set the background to white.
To build the labels, I then decided to start by drawing a Text object at the point (20,50), and
increasing each label by 50 pixels, to represent a linear of 10%, all the up to a possible 100%
performance upgrade or performance downgrade.
To denote the coloring, I decided to make two lines of code to create a Text object of both
performance upgrade and downgrade:
upgrade = Text(Point(100,540), "Blue denotes performance upgrade")
downgrade = Text(Point(110,560), "Red denotes performance downgrade")
I put up a.getMouse() function to get a mouse pointer.
Similar to that of graph.py, I built a skeleton of the code for each command in terms of
performance upgrade and performance downgrade (out of 100%):
height = performance upgrade / downgrade * 100
command = Rectangle(Point(x+40,500), Point(y+40,500-height)
// red = downgrade, blue = upgrade
command.setFill(‘blue2’ or ‘red2’)
command.setWidth(3) // default width
In addition, I added some code to draw some Text labels right under the bar graph, and
added a line of code to draw out the performance upgrade and downgrade of the command fully.
label = Text(Point(x+40,520), “command”)
label.draw(win)
command.draw(win)
I wrap up the file with a secondary .getMouse() function, and then close the performance
complexity window with a win.close(). I then declare a main() function to run the whole
program, with a decreased indent call.
Diagram output: (via screensaver from my Mac):
11
D) Conclusions
In conclusion, at the termination of this project, I have noticed several significant changes
of data:
In graph.py:
- The commands overall are used very infrequently, with the exception of the read
and access commands. This type of trend allows us to deduce that the algorithms
which have given the user the permission to read files and access them via
the file operator server are the best performing ones. It implies that the user
12
here is pretty strict about security, and that they must have done a lot of protection to
prevent malicious activity of wrongly using files and phishing.
- Also, there is a noticeable lack of total files and directories being created, which leads
to the conclusion that the original server did not have many files and directories to
begin with. This could mean both an advantage for the maintenance of the server and
a disadvantage for those whom are trying to connect the server to other servers.
- Finally, minus the obvious outliers of read and access commands, the data is
generally uniformly distributed, with a standard deviation at about 1 file / second.
In graph2.py:
- The performance complexity shows a different story: in this file, read and access
performance upgrades and downgrades are relatively low, which means that the
algorithm is actually weak for improving readability and access of files in terms of
complexity.
- However, on the contrary, the rmdir has the highest downgrade at nearly 19%, while
total_files skyrockets at nearly 80% upgrade! This type of outlying trend means
that the user in the algorithm, for complexity, must have removed a lot of deprecated
files and then forgot to remove the instances of the files, leading to a spike in total
files made. Security in this case, is noticeably weaker in terms of performance
upgrade and downgrade.
So, the algorithm that is best to use for the user would absolutely be the last command, at total
files, as it dwarfs the upgrade compared to other command complexities. Yet, when given a new
set of baseline command averages and file operation averages, the figures would change
significantly. For a more nuanced conclusion, the project would need to require at least two more
baseline command averages and file operation averages from a different server. Thus, the
conclusion is: the algorithm in general is efficient but it could be improved by increasing
the security of files upon removal in Linux.
E) Sourcing and Write Up of Code
Sources used:
http://linux.cloudibee.com/2009/12/fileop-filesystem-io-benchmarking-tool/ (for original file
operation average numbers)
http://stackoverflow.com/questions/13704860/zip-lists-in-python (for help with the zip() function
in Python while building the backup.py file)
http://www.cyberciti.biz/tips/linux-filesystem-benchmarking-with-iozone.html (in determining
performance upgrade vs. downgrade for the graphics files in Python)
http://www.iozone.org/src/current/fileop.c (Don Capp’s skeleton code in C that supervisor gave
me to model my fileop.py on, without pointer manipulations)
13
http://stackoverflow.com/questions/15435751/installing-32-bit-libraries-glibc-on-64-bit-rhel-
without-using-yum (in order to import the baseline average files, and install yum and sudo into
my Mac to process the file operations)
https://access.redhat.com/discussions/1404363#comment-904623 (more help on installing the
iozone to begin pre-processing the file operation data in Linux)
Write-up of all of the code (by Xcode editor without compile errors):
Input.py:
# input.py
# Date: 7/05/2016 - 7/24/2016
# Author: Jason Lu (jasonlu6@bu.edu)
# Supervisor: Jeff Horneback(jeff@drg.org)
# Novetta Quality Assurance Intern Project #2
# Starter file for pre-processing the data, given a unit test of equal operations
# Instructions:
# Create a set of Python files that w illevaluate the performance ratings of the algorithms,
# and then compare each other based on performance rating. For loops and various Python functions
# are allow ed, but use of outside libraries besides import sys (import of the systemfile reader from Terminal)
# is expressly forbidden.
# Main functions of input.py:
# 1) Print the input (unit) test table
# 2) Format the average of each command in float type
# import data from Mac Terminal file system, provided by supervisor
import sys
value = {}
for i in range(20):
value[i] = 0
counter = 1
#1 ) Print input table
print("Input table: ")
f = open('/Users/jasonlu/fileop/input', 'r')
for line in f.readlines():
line.split()
print(line.strip())
# w hite space
print(" ")
# 2) Print the averages:
print("Averages")
w ith open('/Users/jasonlu/fileop/input', 'r') as fd:
first =fd.readline()
next = first.split()
for i in range(len(next)):
value[i] = int(next[i])
for line in fd:
temp = line.split()
b = len(temp)
for iin range(b):
value[i] += int(temp[i])
counter += 1
14
for i in range(b):
value[i] = value[i] / counter
print(float(value[i]))
Backup.py:
# backup.py
# Date: 7/05/2016 - 7/24/2016
# Author: Jason Lu (jasonlu6@bu.edu)
# Backup file that w illpre-processthe originaldata into sliced index form
# Instructions:
# Create a set of Python files that w illevaluate the performance ratings of the algorithms,
# and then compare each other based on performance rating. For loops and various Python functions
# are allow ed, but use of outside libraries besides import sys (import of the systemfile reader from Terminal)
# is expressly forbidden.
# backup.py should be able to do the follow ing:
# 1) Print the entire table in its generalform as fromthe Terminal
# 2) Print the table in spliced index form
import sys
f = open('/Users/jasonlu/fileop/output', 'r')
# open the file onto the Python console
# remove title row
title = f.readline()
# read the file line by line, split into components, and
# then concatenate themw hile stripping the new line
for line in f.readlines():
# split line into parts
line.split()
print(line.strip())
# remove the first row , using the readline() to skip over the row
data = f.readline()
# Directory column selection of all the commands: to pre-process the values
# get the values of the first column encapsulated w ith the average
# fd = file designated
# Source used for the column extraction: zip() function
# http://stackoverflow.com/questions/15795306/read-selected-columns-from-text-file-into-a-list-in-python
# initialize all values of the commands in a list
mkdir = []
rmdir = []
create = []
read = []
w rite =[]
close = []
stat = []
access =[]
chmod = []
readdir = []
link = []
unlink = []
delete = []
total_files = []
# keep file open w hile pre-processing the values
w ith open('/Users/jasonlu/fileop/output', 'r') as fd:
15
fd.readline()
# get the columns indexed in the file
for line in fd:
# get the values of mkdir
mkdir.append(line.split()[2])
rmdir.append(line.split()[3])
create.append(line.split()[4])
read.append(line.split()[5])
w rite.append(line.split()[6])
close.append(line.split()[7])
stat.append(line.split()[8])
access.append(line.split()[9])
chmod.append(line.split()[10])
readdir.append(line.split()[11])
link.append(line.split()[12])
unlink.append(line.split()[13])
# delete.append(line.split()[14])
# total_files.append(line.split()[15])
# print out the column content in commands (ordered fromfirst to last)
# zip() function: returns a list of tuples that are contained w ithin the column, main
# purpose is to encapsulate values of the commands, and abstract themin Python list form
# a-j: indexers for the zip function (as column placeholders)
col1 = [a for a in zip(mkdir)]
col2 = [b for b in zip(rmdir)]
col3 = [c for c in zip(create)]
col4 = [d for d in zip(read)]
col5 = [e for e in zip(w rite)]
col6 = [f for f in zip(close)]
col7 = [g for g in zip(stat)]
col8 = [h for h in zip(access)]
col9 = [i for i in zip(chmod)]
col10 = [j for j in zip(readdir)]
col11 = [k for k in zip(link)]
col12 = [l for l in zip(unlink)]
# col13 = [m for m in zip(delete)]
# col14 = [n for n in zip(total_files)]
# print out the values of the commands
print(col1)
print(col2)
print(col3)
print(col4)
print(col5)
print(col6)
print(col7)
print(col8)
print(col9)
print(col10)
print(col11)
print(col12)
# print(col13)
# print(col14)
fileop.py:
# fileop.py
# Date: 7/05/2016 - 7/24/2016
# Author: Jason Lu (jasonlu6@bu.edu)
# Supervisor: Jeff Horneback(jeff@drg.org)
# Novetta Quality Assurance Intern Project #2
# Main testing file for various iozone and RPM algorithm tests
# Instructions:
# Create a set of Python files that w illevaluate the performance ratings of the algorithms,
# and then compare each other based on performance rating. For loops and various Python functions
# are allow ed, but use of outside libraries besides import sys (import of the systemfile reader from Terminal)
# is expressly forbidden.
16
# fileop.py should be able to do the follow ing: (as a file operator / optimizer program)
# 1) Replicate the data of all 12 commands fromthe Terminal file given (frompackage imports),
# w hile having the title removed
# 2) Average out the values of the performances (with only values and commands encapsulated)
# 3) Compare the performance values together
# 4) Figure out the performance upgrade / dow ngrade of the files compared to given baseline averages
# at /Users/jasonlu/fileop/baseline path directory
# Hint: performance downgrade/ upgrade = (old - new ) / new * 100%
# 5) Give a final report of all attributes and determine w hich is the best
# command to use for the client (in a separate file called graph.py, using
# Python graphics 3.0 to make a graph of the observations)
import sys
value = {}
for i in range(20):
value[i] = 0
counter = 1
# 1) Print the table out first
# get the input in terms of a tuple:
# (command: [value] op/sec)
print("Table of output: ")
f = open('/Users/jasonlu/fileop/title', 'r')
for line in f.readlines():
line.split()
print(line.strip())
data = f.readline()
# w hite space
print (" ")
# 2) Pre-process the data into float values (unformatted)
print("Averages: ")
w ith open('/Users/jasonlu/fileop/title', 'r') as fd:
fd.readline()
first =fd.readline()
second =first.split()
for i in range(len(second)):
value[i] = float(second[i])
for line in fd:
temp = line.split()
for iin range(len(temp)):
value[i] += float(temp[i])
counter += 1
for i in range(len(temp)):
value[i] = value[i] / counter # calculating the average of each command
# w hite space:
print(" ")
print("Formated averages in files / second of each command: ")
# 3) Format the averge into tuples
w ith open('/Users/jasonlu/fileop/title', 'r') as fd:
cmd = fd.readline()
name = cmd.split()
for i in range(len(temp)):
tuple = (name[i] + " has average of " + str(float(value[i])) + " files / second")
print(tuple)
counter += 1
17
# w hite space
print(" ")
print("Baseline averages in files / second of each command: ")
# read from the baseline file (given by Supervisor)
# fo: file output
w ith open('/Users/jasonlu/fileop/baseline' , 'r') as fo:
for line in fo.readlines():
line.split()
print(line.strip())
# pre-processthe averages of each data value in baseline:
# fp: file pre-processor
w ith open ('/Users/jasonlu/fileop/baseline', 'r') as fp:
first =fp.readline()
next = first.split()
for i in range(len(second)):
value[i] = float(second[i])
# 4) Performance Dow ngrade (determine if the percentage has increased or decreased
# Increase: fileop > baseline
# Decrease: fileop < baseline
# No change: fileop = baseline
# begin the process of performance upgrade and downgrades
w ith open ('/Users/jasonlu/fileop/baseline', 'r') as fb:
fb.readline() # skip the command line
val= fb.readline()
number = val.split()
for i in range(len(temp)):
num = float(number[i])
vals = float(value[i])
if vals < num:
dow ngrade =((num- vals) / num)
dow n_percent =downgrade * 100
print("Performance downgrade of : " + str(down_percent)+ "%.")
elif vals > num:
upgrade = ((vals - num) / vals)
up_percent =upgrade * 100
print("Performance upgrade of: " + str(up_percent) + "%")
else:
print("No change in command complexity. ")
graph.py:
# graph.py
# Date: 7/16/2016 - 7/24/2016
# Author: Jason Lu (jasonlu6@bu.edu)
# Supervisor: Jeff Horneback(jeff@drg.org)
# Novetta Quality Assurance Intern Project #2
# This file uses Python graphics to create a bar graph that w illbe the basis of the experimental results
# diagrams in the fileop report
# This file requires Zelle's graphics.py concurrentlyopen to be executable
# Instructions:
# Create a set of Python files that w illevaluate the performance ratings of the algorithms,
# and then compare each other based on performance rating. For loops and various Python functions
# are allow ed, but use of outside libraries besides import sys (import of the systemfile reader from Terminal)
# is expressly forbidden. The graph.py and graph2.py files have different instructions.
# Graph components:
# 0) The graphics are imported fromZelle's graphics library
# 1) Title should be named "Command Averages", window size at MAXIMUM is 1000 * 1000 pixels
# 2) X-axis: command names
18
# 3) Y-axis: file operations / second
# 4) Colored of your ow n choosing
# 5) Uniform w idth and w hite-space between each command
# Statistics fromfileop.py (out of a total 500,000 files/s possible):
# mkdir: 795 files/s close: 2282 files/s link: 579 files/s
# rmdir: 771 files/s stat: 1128 files/s unlink: 825 files/s
# create: 1381 files/s access: 312914 files/s delete: 809 files/s
# read: 22915 files/s chmod: 1697 files/s total_files: 1000 files/s
# w rite: 1147 files/s readdir: 742 files/s
# import graphics library
fromgraphics import *
# main function to draw the graph
def main():
# General description
print("This graph w illshow the file operations averages for each of the Linux commands")
# Create a graphics w indow to build
w in =GraphWin("Command Averages", 800, 800)
# w hite background for clarity
w in.setBackground("white")
# get a mouse pointer
w in.getMouse()
# Build the labels
Text(Point(20, 50), '500,000').draw (win)
Text(Point(20, 100), '450,000').draw(win)
Text(Point(20, 150), '400,000').draw(win)
Text(Point(20, 200), '350,000').draw(win)
Text(Point(20, 250), '300,000').draw(win)
Text(Point(20, 300), '250,000').draw(win)
Text(Point(20, 350), '200,000').draw(win)
Text(Point(20, 400), '150,000').draw(win)
Text(Point(20, 450), '100,000').draw(win)
w in.getMouse()
#Bar w idth: 20 pixels long, 450-height in height
# Scale: 500:500,000 ratio given the scaling of the Graphics canvas)
# Draw a bar for mkdir command
height1 = 0.00159 * 1000 # 795 / 500,000 files/s
mkdir = Rectangle(Point(60,450), Point(80,450-height1))
mkdir.setFill('red')
mkdir.setWidth(2)
mkdir.draw (win)
# Draw a bar for rmdir command
height2 = 0.001542 * 1000 # 771 / 500,000 files/s
rmdir = Rectangle(Point(100,450), Point(120, 450-height2))
rmdir.setFill('orange')
rmdir.setWidth(2)
rmdir.draw (win)
# Draw a bar for create command
height3 = 0.002762 * 1000 # 1381 / 500,000 files/s
create = Rectangle(Point(140, 450), Point(160, 450-height3))
create.setFill('yellow ')
create.setWidth(2)
create.draw(win)
# Draw a bar for read command
height4 = 0.04583 * 1000 # 22915 / 500,000 files/s
read = Rectangle(Point(180, 450), Point(200, 450-height4))
read.setFill('green2')
read.setWidth(2)
read.draw(win)
19
# Draw a bar for w rite command
height5 = 0.002294 * 1000 # 1147 / 500,000 files/s
w rite =Rectangle(Point(220, 450), Point(240, 450-height5))
w rite.setFill('blue')
w rite.setWidth(2)
w rite.draw(win)
# Draw a bar for close command
height6 = 0.004564 * 1000 # 2282 / 500,000 files /s
close = Rectangle(Point(260,450), Point(280, 450-height6))
close.setFill('blue2')
close.setWidth(2)
close.draw(win)
# Draw a bar for stat command
height7 = 0.00256 * 1000 # 1128 / 500,000 files /s
stat = Rectangle(Point(300,450), Point(320, 450-height7))
stat.setFill('purple')
stat.setWidth(2)
stat.draw(win)
# Draw a bar for access command
height8 = 0.625828 * 500 # figure out the exact scale later
access =Rectangle(Point(340,450), Point(360,450 - height8))
access.setFill('red')
access.setWidth(2)
access.draw(win)
# Draw a bar for chmod command
height9 = 0.003394 * 1000 # 1697 / 500,000 files /s
chmod = Rectangle(Point(380,450), Point(400,450-height9))
chmod.setFill('orange')
chmod.setWidth(2)
chmod.draw (win)
# Draw a bar for the readdir command
height10 = 0.001484 * 1000 # 742 / 500,000 files /s
readdir = Rectangle(Point(420,450), Point(440,450-height10))
readdir.setFill('yellow ')
readdir.setWidth(2)
readdir.draw(win)
# Draw a bar for the link command
height11 = 0.001158 * 1000 # 579 / 500,000 files /s
link = Rectangle(Point(460,450), Point(480,450-height11))
link.setFill('green2')
link.setWidth(2)
link.draw (win)
# Draw a bar for the unlink command
height12 = 0.00165 * 1000 # 825 / 500,000 files /s
unlink = Rectangle(Point(500,450), Point(520,450-height12))
unlink.setFill('blue')
unlink.setWidth(2)
unlink.draw (win)
# Draw a bar for the delete command
height13 = 0.001618 * 1000 # 809 / 500,000 file /s
delete = Rectangle(Point(540,450), Point(560,450-height13))
delete.setFill('blue2')
delete.setWidth(2)
delete.draw (win)
# Draw a bar for the total_files command
height14 = 0.002 * 1000 # 1000 / 500,000 files /s
total_files = Rectangle(Point(580,450), Point(600,450-height14))
total_files.setFill('purple')
total_files.setWidth(2)
total_files.draw(win)
20
# Setting the text interfaces
# 470: deflaut y-value of the text (for legibility reasons)
# x-value: midpoint betw een the w hite-spaces of the rectangles' widths)
label1 = Text(Point(70,470), " mkdir ")
label1.draw (win)
label2 = Text(Point(110,470), "rmdir")
label2.draw (win)
label3 = Text(Point(150,470), "create")
label3.draw (win)
label4 = Text(Point(190,470), "read")
label4.draw (win)
label5 = Text(Point(230,470), "w rite")
label5.draw (win)
label6 = Text(Point(270,470), "close")
label6.draw (win)
label7 = Text(Point(310,470), "stat")
label7.draw (win)
label8 = Text(Point(350,470), "access")
label8.draw (win)
label9 = Text(Point(390,470), "chmod")
label9.draw (win)
label10 = Text(Point(430,470), "readdir")
label10.draw (win)
label11 = Text(Point(470,470), "link")
label11.draw (win)
label12 = Text(Point(510,470), "unlink")
label12.draw (win)
label13 = Text(Point(550,470), "delete")
label13.draw (win)
label14 = Text(Point(590,470), "total_files")
label14.draw (win)
# draw each bar graph simultaneously (proportionate to the scaling provided)
w in.getMouse()
# close the w indow (to avoid an exception)
# w ait for click, and then quit
w in.close()
main()
graph2.py:
# graph2.py
# Date: 7/16/2016 - 7/24/2016
# Author: Jason Lu (jasonlu6@bu.edu)
# Supervisor: Jeff Horneback(jeff@drg.org)
# Novetta Quality Assurance Intern Project #2
# This file uses Python graphics to create a bar graph that summarizes the performance
# upgrades and dow ngradesof each Linux command
# This file requires Zelle's graphics.py concurrentlyopen to be executable
# Instructions:
21
# Create a set of Python files that w illevaluate the performance ratings of the algorithms,
# and then compare each other based on performance rating. For loops and various Python functions
# are allow ed, but use of outside libraries besides import sys (import of the systemfile reader from Terminal)
# is expressly forbidden. The graph.py and graph2.py files have different instructions.
# Graph components:
# 0) The graphics are imported fromZelle's graphics library
# 1) Title should be named "Performance Complexity", w indow size at MAXIMUM is 1000 * 1000 pixels
# 2) X-axis: command names
# 3) Y-axis: % upgrade / dow ngrade (out of 100)
# 4) Blue: upgrade, Red: dow ngrade
# 5) Uniform w idth and w hite-space between each command
# Statistics fromfileop.py (out of a total 100% upgrade or dow ngrade):
# mkdir: 795 files/s close: 2282 files/s link: 579 files/s
# rmdir: 771 files/s stat: 1128 files/s unlink: 825 files/s
# create: 1381 files/s access: 312914 files/s delete: 809 files/s
# read: 22915 files/s chmod: 1697 files/s total_files: 1000 files/s
# w rite: 1147 files/s readdir: 742 files/s
# import graphics library
fromgraphics import *
# main function to draw the graph
def main():
# General description
print("This graph w illshow the performance upgradesand downgradesof each command betw een fileop and baseline")
# Create a graphics w indow to build
w in =GraphWin("Performance Complexity", 800, 800)
# w hite background for clarity
w in.setBackground("white")
# get a mouse pointer
w in.getMouse()
# Build the labels
Text(Point(20, 50), '100%').draw(win)
Text(Point(20, 100), '90%').draw(win)
Text(Point(20, 150), '80%').draw(win)
Text(Point(20, 200), '70%').draw(win)
Text(Point(20, 250), '60%').draw(win)
Text(Point(20, 300), '50%').draw(win)
Text(Point(20, 350), '40%').draw(win)
Text(Point(20, 400), '30%').draw(win)
Text(Point(20, 450), '20%').draw(win)
Text(Point(20, 500), '10%').draw(win)
# Denote the colorings
upgrade = Text(Point(100,540), "Blue denotes performance upgrade")
dow ngrade =Text(Point(110,560), "Red denotes performance dow ngrade")
upgrade.draw(win)
dow ngrade.draw(win)
w in.getMouse()
# Draw a label for the mkdir performance upgrade
height1 = 0.0185 * 100
mkdir = Rectangle(Point(40,500), Point(60, 500-height1))
mkdir.setFill('blue2')
mkdir.setWidth(3)
label1 = Text(Point(50,520), " mkdir ")
label1.draw (win)
mkdir.draw (win)
# Draw a label for the rmdir performance downgrade
height2 = 0.1958 * 450
22
rmdir = Rectangle(Point(80,500), Point(100,500-height2))
rmdir.setFill('red2')
rmdir.setWidth(3)
label2 = Text(Point(90,520), "rmdir")
label2.draw (win)
rmdir.draw (win)
# Draw a label for the create performance upgrade
height3 = 0.0136 * 100
create = Rectangle(Point(120,500), Point(140,500-height3))
create.setFill('blue2')
create.setWidth(3)
label3 = Text(Point(130,520), "create")
label3.draw (win)
create.draw(win)
# Draw a label for the read performance upgrade
height4 = 0.0249 * 100
read = Rectangle(Point(160, 500), Point(180,500-height4))
read.setFill('blue2')
read.setWidth(3)
label4 = Text(Point(170,520), "read")
label4.draw (win)
read.draw(win)
# Draw a label for the w rite performance upgrade
height5 = 0.0675 * 100
w rite =Rectangle(Point(200,500), Point(220,500-height5))
w rite.setFill('blue2')
w rite.setWidth(3)
label5 = Text(Point(210, 520), "w rite")
label5.draw (win)
w rite.draw(win)
# Draw a label for the close performance upgrade
height6 = 0.1453 * 100
close = Rectangle(Point(240, 500), Point(260, 500-height6))
close.setFill('blue2')
close.setWidth(3)
label6 = Text(Point(250, 520), "close")
label6.draw (win)
close.draw(win)
# Draw a label for the stat performance dow ngrade
height7 = 0.07780 * 100
stat = Rectangle(Point(280, 500), Point(300, 500-height7))
stat.setFill('red2')
stat.setWidth(3)
label7 = Text(Point(290, 520), "stat")
label7.draw (win)
stat.draw(win)
# Draw a label for the access performance downgrade
height8 = 0.0404 * 100
23
access =Rectangle(Point(320, 500), Point(340,500 - height8))
access.setFill('red2')
access.setWidth(3)
label8 = Text(Point(330,520), "access")
label8.draw (win)
access.draw(win)
# Draw a label for the chmod performance dow ngrade
height9 = 0.0807 * 100
chmod = Rectangle(Point(360, 500), Point(380, 500-height9))
chmod.setFill('red2')
chmod.setWidth(3)
label9 = Text(Point(370, 520), "chmod")
label9.draw (win)
chmod.draw (win)
# Draw a label for the readdir performance upgrade
height10 = 0.0725 * 100
readdir = Rectangle(Point(400,500), Point(420, 500-height10))
readdir.setFill('blue2')
readdir.setWidth(3)
label10 = Text(Point(410, 520), "readdir")
label10.draw (win)
readdir.draw(win)
# Draw a label for link performance upgrade
height11 = 0.035 * 100
link = Rectangle(Point(440,500), Point(460, 500-height11))
link.setFill('blue2')
link.setWidth(3)
label11 = Text(Point(450, 520), "link")
label11.draw (win)
link.draw (win)
# Draw a label for unlink performance dow ngrade
height12 = 0.0182 * 100
unlink = Rectangle(Point(480,500), Point(500, 500-height12))
unlink.setFill('red2')
unlink.setWidth(3)
label12 = Text(Point(490, 520), "unlink")
label12.draw (win)
unlink.draw (win)
# Draw a label for delete performance downgrade
height13 = 0.0729 * 100
delete = Rectangle(Point(520,500), Point(540, 500-height13))
delete.setFill('red2')
delete.setWidth(3)
label13 = Text(Point(530, 520), "delete")
label13.draw (win)
delete.draw (win)
# Draw a label for total_files performance upgrade
24
height14 = 0.80 * 437.5
total_files = Rectangle(Point(560,500), Point(580, 500-height14))
total_files.setFill('blue2')
total_files.setWidth(3)
label14 = Text(Point(570, 520), "total files")
label14.draw (win)
total_files.draw(win)
w in.getMouse()
w in.close()
main()

Contenu connexe

Tendances

Implementation of Pipe in Linux
Implementation of Pipe in LinuxImplementation of Pipe in Linux
Implementation of Pipe in LinuxTushar B Kute
 
Csc1100 lecture15 ch09
Csc1100 lecture15 ch09Csc1100 lecture15 ch09
Csc1100 lecture15 ch09IIUM
 
23 priority queue
23 priority queue23 priority queue
23 priority queueGodo Dodo
 
Python File Handling | File Operations in Python | Learn python programming |...
Python File Handling | File Operations in Python | Learn python programming |...Python File Handling | File Operations in Python | Learn python programming |...
Python File Handling | File Operations in Python | Learn python programming |...Edureka!
 
File Commands Of Linux Ii
File Commands Of Linux  IiFile Commands Of Linux  Ii
File Commands Of Linux Iimutharam
 
Unix system programming
Unix system programmingUnix system programming
Unix system programmingSyed Mustafa
 
File handling in Python
File handling in PythonFile handling in Python
File handling in PythonMegha V
 
(Julien le dem) parquet
(Julien le dem)   parquet(Julien le dem)   parquet
(Julien le dem) parquetNAVER D2
 
Linux commands part -2
Linux commands part -2Linux commands part -2
Linux commands part -2bhatvijetha
 
Data Structures used in Linux kernel
Data Structures used in Linux kernel Data Structures used in Linux kernel
Data Structures used in Linux kernel assinha
 
LD_PRELOAD Exploitation - DC9723
LD_PRELOAD Exploitation - DC9723LD_PRELOAD Exploitation - DC9723
LD_PRELOAD Exploitation - DC9723Iftach Ian Amit
 

Tendances (20)

Implementation of Pipe in Linux
Implementation of Pipe in LinuxImplementation of Pipe in Linux
Implementation of Pipe in Linux
 
Csc1100 lecture15 ch09
Csc1100 lecture15 ch09Csc1100 lecture15 ch09
Csc1100 lecture15 ch09
 
23 priority queue
23 priority queue23 priority queue
23 priority queue
 
Python File Handling | File Operations in Python | Learn python programming |...
Python File Handling | File Operations in Python | Learn python programming |...Python File Handling | File Operations in Python | Learn python programming |...
Python File Handling | File Operations in Python | Learn python programming |...
 
Basic unix commands_1
Basic unix commands_1Basic unix commands_1
Basic unix commands_1
 
Chapter 08 data file handling
Chapter 08 data file handlingChapter 08 data file handling
Chapter 08 data file handling
 
CPP17 - File IO
CPP17 - File IOCPP17 - File IO
CPP17 - File IO
 
File Commands Of Linux Ii
File Commands Of Linux  IiFile Commands Of Linux  Ii
File Commands Of Linux Ii
 
Unix system programming
Unix system programmingUnix system programming
Unix system programming
 
Linux commands
Linux commandsLinux commands
Linux commands
 
File handling in Python
File handling in PythonFile handling in Python
File handling in Python
 
Python-files
Python-filesPython-files
Python-files
 
(Julien le dem) parquet
(Julien le dem)   parquet(Julien le dem)   parquet
(Julien le dem) parquet
 
Python programming : Files
Python programming : FilesPython programming : Files
Python programming : Files
 
Linux commands part -2
Linux commands part -2Linux commands part -2
Linux commands part -2
 
Linux
LinuxLinux
Linux
 
Data Structures used in Linux kernel
Data Structures used in Linux kernel Data Structures used in Linux kernel
Data Structures used in Linux kernel
 
LD_PRELOAD Exploitation - DC9723
LD_PRELOAD Exploitation - DC9723LD_PRELOAD Exploitation - DC9723
LD_PRELOAD Exploitation - DC9723
 
2
22
2
 
Unix Basics For Testers
Unix Basics For TestersUnix Basics For Testers
Unix Basics For Testers
 

Similaire à fileop report

Educational Objectives After successfully completing this assignmen.pdf
Educational Objectives After successfully completing this assignmen.pdfEducational Objectives After successfully completing this assignmen.pdf
Educational Objectives After successfully completing this assignmen.pdfrajeshjangid1865
 
Reaction StatisticsBackgroundWhen collecting experimental data f.pdf
Reaction StatisticsBackgroundWhen collecting experimental data f.pdfReaction StatisticsBackgroundWhen collecting experimental data f.pdf
Reaction StatisticsBackgroundWhen collecting experimental data f.pdffashionbigchennai
 
r,rstats,r language,r packages
r,rstats,r language,r packagesr,rstats,r language,r packages
r,rstats,r language,r packagesAjay Ohri
 
File management in C++
File management in C++File management in C++
File management in C++apoorvaverma33
 
Linux file commands and shell scripts
Linux file commands and shell scriptsLinux file commands and shell scripts
Linux file commands and shell scriptsPrashantTechment
 
The program reads data from two files, itemsList-0x.txt and .docx
The program reads data from two files, itemsList-0x.txt and .docxThe program reads data from two files, itemsList-0x.txt and .docx
The program reads data from two files, itemsList-0x.txt and .docxoscars29
 
Python reading and writing files
Python reading and writing filesPython reading and writing files
Python reading and writing filesMukesh Tekwani
 
Linux practicals T.Y.B.ScIT
Linux practicals T.Y.B.ScITLinux practicals T.Y.B.ScIT
Linux practicals T.Y.B.ScITvignesh0009
 
Bozorgmeh os lab
Bozorgmeh os labBozorgmeh os lab
Bozorgmeh os labFS Karimi
 
pythonlibrariesandmodules-210530042906.docx
pythonlibrariesandmodules-210530042906.docxpythonlibrariesandmodules-210530042906.docx
pythonlibrariesandmodules-210530042906.docxRameshMishra84
 

Similaire à fileop report (20)

Unix_QT.ppsx
Unix_QT.ppsxUnix_QT.ppsx
Unix_QT.ppsx
 
Unix_QT.ppsx
Unix_QT.ppsxUnix_QT.ppsx
Unix_QT.ppsx
 
Project report
Project reportProject report
Project report
 
Lab 1 Essay
Lab 1 EssayLab 1 Essay
Lab 1 Essay
 
Educational Objectives After successfully completing this assignmen.pdf
Educational Objectives After successfully completing this assignmen.pdfEducational Objectives After successfully completing this assignmen.pdf
Educational Objectives After successfully completing this assignmen.pdf
 
Reaction StatisticsBackgroundWhen collecting experimental data f.pdf
Reaction StatisticsBackgroundWhen collecting experimental data f.pdfReaction StatisticsBackgroundWhen collecting experimental data f.pdf
Reaction StatisticsBackgroundWhen collecting experimental data f.pdf
 
r,rstats,r language,r packages
r,rstats,r language,r packagesr,rstats,r language,r packages
r,rstats,r language,r packages
 
File management in C++
File management in C++File management in C++
File management in C++
 
Linux file commands and shell scripts
Linux file commands and shell scriptsLinux file commands and shell scripts
Linux file commands and shell scripts
 
The program reads data from two files, itemsList-0x.txt and .docx
The program reads data from two files, itemsList-0x.txt and .docxThe program reads data from two files, itemsList-0x.txt and .docx
The program reads data from two files, itemsList-0x.txt and .docx
 
Python reading and writing files
Python reading and writing filesPython reading and writing files
Python reading and writing files
 
Linux practicals T.Y.B.ScIT
Linux practicals T.Y.B.ScITLinux practicals T.Y.B.ScIT
Linux practicals T.Y.B.ScIT
 
File_Management_in_C
File_Management_in_CFile_Management_in_C
File_Management_in_C
 
Module2-Files.pdf
Module2-Files.pdfModule2-Files.pdf
Module2-Files.pdf
 
Linuxppt
LinuxpptLinuxppt
Linuxppt
 
User defined functions in matlab
User defined functions in  matlabUser defined functions in  matlab
User defined functions in matlab
 
Mc7404 np final
Mc7404 np finalMc7404 np final
Mc7404 np final
 
File management
File managementFile management
File management
 
Bozorgmeh os lab
Bozorgmeh os labBozorgmeh os lab
Bozorgmeh os lab
 
pythonlibrariesandmodules-210530042906.docx
pythonlibrariesandmodules-210530042906.docxpythonlibrariesandmodules-210530042906.docx
pythonlibrariesandmodules-210530042906.docx
 

fileop report

  • 1. 1 File Operator Report Jason Lu (jasonlu6@bu.edu) Supervisor: Jeff Horneback (jeff@drg.com) Date: July 6th – 24th 2016 Due: July 28th 2016 (extension) Digital Results Group Novetta Industries A) Abstract: This report summarizes the findings of the file operator project and analyzes the performance of each selected algorithm. In detail, report lists the following: the average of the operations / second of each command (‘mkdir’,’rmdir’…’Total_files’), the performance downgrade and upgrade of each command (in terms of percentage). Finally, the report concludes with a summary of the observations, and have two Python graphics files to show the aggregate amount of operations per command and the performance complexity change in comparison to the baseline file. The project is split into several distinctive parts: fileop.py – this file is the main file of the project. It is used to handle all pre- processing operations and the output of the averages and complexities (in float type form). It also outputs a very clear template of the output vim table from the Linux fileop directory. backup.py – this file is a backup of the main output table. In case of a data loss or other unforeseen circumstance, this file will be able to allow the user to re-use the original values of the commands, as well as change the values as the user sees fit. input.py – this file is the starter file of the entire project. It is where the first draft of the pre-processing files happens. Also, it is where the averages of the commands were first computed. graph.py – this file is the first graphics file of the conclusion: it denotes each of the commands’ file operation (in files / second) average in ROYGBIV color scheme. graph2.py – this file is the second graphics file of the conclusion: it denotes each of the commands’ change in performance complexity, by means of both upgrade and downgrade. Note: Red color denotes downgrade and blue color denotes upgrade in the Graphics window in Python. graphics.py – this file is the import file that is required to use Zelle Python 3.0 graphics library. The graphs were mainly built through Zelle’s library functions of color, Text, object, numbers. To explain in more detail of the parameters of the file operator, here are the general definitions of each command in the fileop.py output: mkdir – make a directory from Linux that will create memory storage for the file rmdir – remove the directory from Linux in which the file was stored (deep copy) create – create a new sub-directory to store the file read – read the file selected from the directory write – write the file selected to the directory
  • 2. 2 close – how many times the file has been closed in the directory stat – Unix system call to determine how many times the files are rooted to a particular directory access – how many times the file has been accessed by the client chmod – changes the access permissions to the file system objects readdir – read the directory under a threading stream link – how many times a file has been linked to a directory or sub-directory unlink – how many times a file has been un-linked to a directory or sub-directory Total_files – the total number of files found in the directory B) Building of the fileop starter and main programs: input, backup, and fileop.py I) input.py build: Step 1: Obtain the input and create a value dictionary to hold values To begin the project completely, I first imported the system import (import sys) to get data from the Mac Terminal system. Then, I built a value dictionary, that used a for loop structure that can hold up to 20 values. I initialized my value variable to 0 in the starter steps, and added an accumulator counter variable to 1. Step 2: Print out the input table first Next, I made a print statement of print(“Input table: “). Next, I used a file I/O command of open the categorized output (cat command in Linux) with the file path of /Users/jasonlu/fileop/input with the reading of the file denoted as the ‘r’ char in Python. I then used a for loop construct to read each line in the file. For each of the line, I incorporated the Python function of .split() to split each line into a comma-separated index of a list. Then I printed the lines by stripping the newline of each file with the Python function of.strip() to get the command averages in proper form. Lastly, to skip the title part of the file, I used the line data = f.readline(). Step 3: Pre-process the data into float values and calculate the average of the files / second operations of each command After adding some white space (for user output legibility), I decided to tackle the task of computing the command averages. With the Python with construct, I managed to keep another instance of the file open. Also, since I am computing the average with float data, I chose the variable fd to mean the file data. For the command line, I used yet another .readline() function. Next, I split up the command lines into the name of the command and their values, with the variable second to designate the location of the second line in the file.
  • 3. 3 I decided to add a for loop structure in the length of the second line in the file. To calculate the average, I split that task recursively into three distinct steps: 1) Get a deep copy of the value dictionary index in conjunction with a temporary array index: value[i] = float(temp[i]). 2) Add a for loop and then split the temporary array into separate indexes. After, accumulate each temporary value to the total value array while updating the counter variable by 1. 3) Finally, I divided arithmetically (to avoid the hassle of modulus division and remainder side cases) each index value from the total, thus obtaining each average of the command file operations in files / second in the float type. The last step was to print the values of the averages of the command file operations in float form, with the code print(float(value[i])). II) backup.py build: Step 1: Obtain the output and read first line of the output file I first imported the system import (import sys) to get the data from the Mac Terminal system. Then, I did an f-open of the pathfile of the fileop output, entitled ‘/Users/jasonlu/fileop/output’,’r’. Then, I was able to read the first line of the file using the f.readline() method, and printed out the data. Satisfied with the output of the data, I proceeded to the next step of parsing the file into a multi-dimensional array. Step 2: Parse files into a Python list, and replace the comma-separated values of the list into a readable line of output Next, I decided to parse the input file into various commands. To read the command, I used once again the f.readline() method. To split the values in the method, I then added a new variable called value, whose output displayed a list of comma-separated values, such as the following: Output 1.1: [‘mdkir’, ‘rmdir’, ‘create’, ‘read’, ‘write’, ‘close’, ‘stat’, ‘access’, ‘chmod’, ‘readdir’, ‘link’, ‘unlink’, ‘delete’, ‘Total_files’] To change the formatting of the string, I then decided to use the.split() method to split each part of the list into sub-lists. In order to put the list together, I then decided to use Python String library’s .replace() method, replacing each instance of a comma with a space. I then used a print statement to print the output in the new comma-delimited format: Output 1.2:
  • 4. 4 Fileop: File size is 1024, Output is in Ops/sec. (A=Avg, B=Best, W=Worst) . mkdir rmdir create read write close stat access chmod readdir link unlink delete Total_files The next task would be to use for loops to print out the values, and then discarding the newline within the values. Step 3: Loop line by line the output and display its results in a multi-dimensional array To begin looping the output, I first decided to read each part of the output line by line, and then strip each part of the newline within the values with the Python I/O library’s .strip() method. I repeated the process for all of the lines within the file until the end, using a for loop of each line in the f.readlines() function. Then I added a print statement casted over the .strip() method. Now, the output looks like this: Fileop: File size is 1024, Output is in Ops/sec. (A=Avg, B=Best, W=Worst) . mkdir rmdir create read write close stat access chmod readdir link unlink delete Total_files A 10 795 771 1381 22915 1147 2282 1128 312914 1697 742 579 825 809 1000 A 11 795 771 1381 22915 1147 2282 1128 312914 1697 742 579 825 809 1000 A 12 795 771 1381 22915 1147 2282 1128 312914 1697 742 579 825 809 1000 A 13 795 771 1381 22915 1147 2282 1128 312914 1697 742 579 825 809 1000 A 14 795 771 1381 22915 1147 2282 1128 312914 1697 742 579 825 809 1000 A 15 795 771 1381 22915 1147 2282 1128 312914 1697 742 579 825 809 1000 A 16 795 771 1381 22915 1147 2282 1128 312914 1697 742 579 825 809 1000 A 17 795 771 1381 22915 1147 2282 1128 312914 1697 742 579 825 809 1000 A 18 795 771 1381 22915 1147 2282 1128 312914 1697 742 579 825 809 1000 A 19 795 771 1381 22915 1147 2282 1128 312914 1697 742 579 825 809 1000 Step 4: Get the values of the file output into comma-separated form (for backup file purposes) To simplify this task, I decided to break down the steps via procedural decomposition:
  • 5. 5 - Remove first two columns of the output array: to complete this part of the task, I used the .remove(index of object) method function. The new output, temporarily is: mkdir rmdir create read write close stat access chmod readdir link unlink delete Total_files 795 771 1381 22915 1147 2282 1128 312914 1697 742 579 825 809 1000 795 771 1381 22915 1147 2282 1128 312914 1697 742 579 825 809 1000 795 771 1381 22915 1147 2282 1128 312914 1697 742 579 825 809 1000 795 771 1381 22915 1147 2282 1128 312914 1697 742 579 825 809 1000 795 771 1381 22915 1147 2282 1128 312914 1697 742 579 825 809 1000 795 771 1381 22915 1147 2282 1128 312914 1697 742 579 825 809 1000 795 771 1381 22915 1147 2282 1128 312914 1697 742 579 825 809 1000 795 771 1381 22915 1147 2282 1128 312914 1697 742 579 825 809 1000 795 771 1381 22915 1147 2282 1128 312914 1697 742 579 825 809 1000 795 771 1381 22915 1147 2282 1128 312914 1697 742 579 825 809 1000 Next, I focused only on the first row of the output, and decided to solve the problem using mathematical induction, where the first row and first columns are the base cases. Then, after seeing the correct outputs from the first row and columns, I expanded the code with double for loops to traverse the rest of the truncated output array. In general, via pseudo code and math induction, here is my approach: Induction strategy to traversing the arrays (using mathematical induction): Base case: 1 row only, find the average Base case 2: 1 column only, find the average Induction Hypothesis: Let P(r,c): “The arbitrary multi-dimensional array of the output with row r and column c.” Induction Step: P(r,c)  P(r+1,c+1):  r,c  fileop.py: For every row in fileop.py: For every column in fileop.py Find the index Encapsulate the value (example: command mkdir has value ‘795’) Print out the value
  • 6. 6 I began with a test case in my Python console of just having only 1 line of code with simple counting numbers: row = [1,2,3,4,5,6,7,8,9,10]. Then, I tested out the result by using the sum(row) / len(row) casted into float form, and got the appropriate average value of 5.5. Next, I did the same with the columns, and got the same number. Satisfied with the preliminary results, I applied the console testing to the backup.py file. I first initialized all of the values of the commands into a list. Then, with a with statement construct, I managed to read the file with the code fd.readline(), with fd denoting file directory. For each line in fd, I decided to append each value of the commands onto the command itself, and then split the line with increased index values. Finally, I used the Python zip() function to encapsulate all of the values in the 14 columns (mkdir … total_files), and printed out all of the values of the commands. To avoid an ArrayOutOfBounds Error, I commented the last two columns of the backup.py output file. III) fileop.py build Step 1: Re-format the averages to string form With both my starter code and backup code complete, I finally began the long task of building my main file for all pre-processing and calculation of averages and performance complexity in the fileop.py file. I started off by basically copying my input.py starter code. Then after adding a white space, I decided to format the table so that it can be used in terms of a tuple relation. To build the tuple relation, I first decided to cast the average values into a string form, as the Python console would throw an TypeError if a float and string were concatenated. Then, with the original open construct, I first read the line in the file directory with the variable cmd, an abbreviation of the command line. Next, I split the command line with the command name variable. Finally, I built a for loop construct that is the range of the length of the temporary array (initialized in input.py). The tuple concatenation was printed, in terms of the formatted averages, with this line of code: tuple = (name[i] + “ has average of “ + str(float(value[i]) + “ files / second”). Lastly, to finish this primary step, I accumulated the counter variable by 1 for each run of the loop. Step 2: Determine the baseline averages of each command To begin the procedure of calculating the baseline average from the baseline.vim file from the supervisor, I used a with construct to open the file, with the file path in Linux of /Users/jasonlu/fileop/baseline in the read ‘r’ form under the variable fo to denote file output.
  • 7. 7 Similar to that in the previous steps, I managed to read the lines in fo.readlines() and then split the lines and printed them with no whitespaces. Step 3: Pre-process the averages of each data in the baseline In order to complete the baseline file operation, I needed to pre-process some data in the vim baseline file. With yet another with construct, this time under the variable fp to denote the file pre-processor, I managed to read the first line of the file with the code first = fp.readline(). To split the first line of the file, I then used a next pointer variable to split the first line. In order to add to the value array as initialized previous, I looped the variable for the length of the second line in the baseline file, and then casted the second line index value as the float. This method allowed me to finally get each baseline value command average as its own, without the hassle of more file operation functions and time costs. Step 4: Calculate the performance upgrade / downgrade of the files Before coding this step, I first did some quick mental math, and came up with a general piecewise function of how to tell when a performance upgrade or a performance downgrade has occurred between the initial command average and the baseline file: Performance = { 𝑢𝑝𝑔𝑟𝑎𝑑𝑒 𝑖𝑓𝑓 𝑛𝑢𝑚𝑏𝑒𝑟 𝑜𝑓 𝑏𝑎𝑠𝑒𝑙𝑖𝑛𝑒 𝑎𝑣𝑒𝑟𝑎𝑔𝑒 − 𝑣𝑎𝑙𝑢𝑒 𝑜𝑓 𝑐𝑜𝑚𝑎𝑚𝑛𝑑 𝑛𝑢𝑚𝑏𝑒𝑟 𝑜𝑓 𝑏𝑎𝑠𝑒𝑙𝑖𝑛𝑒 𝑎𝑣𝑒𝑟𝑎𝑔𝑒 , 𝑤ℎ𝑒𝑟𝑒 𝑣𝑎𝑙𝑠 < 𝑛𝑢𝑚 𝑑𝑜𝑤𝑛𝑔𝑟𝑎𝑑𝑒 𝑖𝑓𝑓 𝑣𝑎𝑙𝑢𝑒 𝑜𝑓 𝑐𝑜𝑚𝑚𝑎𝑛𝑑 − 𝑛𝑢𝑚𝑏𝑒𝑟 𝑜𝑓 𝑏𝑎𝑠𝑒𝑙𝑖𝑛𝑒 𝑎𝑣𝑒𝑟𝑎𝑔𝑒 𝑣𝑎𝑙𝑢𝑒 𝑜𝑓 𝑐𝑜𝑚𝑚𝑎𝑛𝑑 , 𝑤ℎ𝑒𝑟𝑒 𝑛𝑢𝑚 < 𝑣𝑎𝑙𝑠 To simplify the math, I essentially viewed the performance downgrade as a percent decrease from the original, and performance upgrade as a percent increase from the original. I finally converted the fraction to the percent performance by multiplying the int(100). Step 5: Format the performance upgrades / downgrades and add initializing code The code fitted nicely with my mathematical piecewise function, and after testing the values, I decided to simplify the variables, replacing the originally convoluted float cast of the baseline number index with a simple variable num and likewise the float cast of the value of command index with the simple variable vals. Finally, on top of the performance piecewise function, I skipped the first line of the baseline file, and split the second with a number indicator variable. To finish off the fileop.py file, I added three print statements: if a command has performance upgrade, the program will print out “Performance upgrade of : + str(up_percent) + “%”. Likewise, it will print out “Performance downgrade of : + str(down_percent) + “%” for performance downgrades. If on the rare case no change occurs, the program prints out “No change in command complexity.”
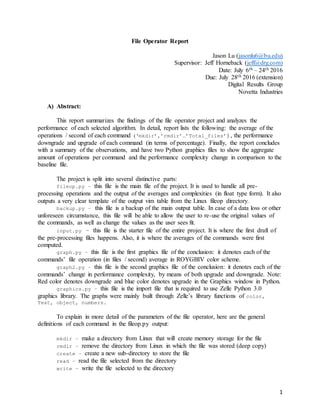
  • 8. 8 C) Build of the graphics files to graph out averages and performance complexities Part I: The build and diagram output of graph.py After completing the mathematical part of fileop.py, I brushed up on some Zelle Python graphics during the time off and then decided to display my results of the project in a simple 2- dimensional Python graphics bar graph. In order to use Zelle’s graphics functions, I first imported the entire graphics class with the code from graphics import *. I built a Python graphics window named “Command Averages”, and to the specifications of the project, made it a square of 800 pixels on each side. I then set the background color to white , for clarity purposes. In order to allow the user to interact with the graph with the mouse, I added a mouser pointer with the function win.getMouse(). I then decided to build the labels of the graph, starting from the point (20,50) and increased each increment of 50 pixels to be an additional 50,000 files / second operations added, thus creating my 1000:1 ratio of files /s to pixel, which would be vital to determining the bar graph heights. To make sure Python actually drew the labels, I called the win.getMouse() function again. Here is the general skeleton for what I used to draw the bar graphs (14 of them total, each one representing the average commands of each command in the fileop): height = (# of files / second / 500,000) * 1000 command = Rectangle(Point(x+40,450), Point(y+40,450-height) // red, orange, yellow, green, blue, blue2, purple, in that order command.setFill(‘ROYGBIV’ color) command.setWidth(2) // default width command.draw(win) Then, after each command has its own bar graph drawn out accurately, I finalized the graph.py with the following skeleton for the text interface: Label = Text(Point(x+40), “command”) Label.draw(win) The program is wrapped up with a final win.getMouse() and the user can click once more, to activate the .close() function and end interaction with the program. I concluded the coding of graph.py with a main() declaration decreased indent call. Diagram output: (via screensaver from my Mac):
  • 9. 9 Note: The Diagram is not drawn to absolute scale, and that some of the commands’ coloring scheme may be lacking in detail. Part II: The build and diagram output of graph2.py I decided to then tackle the final part of the project, which is the graphing of performance upgrade and downgrades of each file command in comparison to the baseline averages (or essentially, the file operation average vs. baseline average).
  • 10. 10 Similar to before, I imported the graphics library with the from graphics import * in order to use the graphics interface objects. Next, I printed a general description of all graph, which states “This graph will show the performance upgrades and performance downgrades of each command between fileop and baseline.” Afterwards, I made a new graphics window, entitled “Performance Complexity”, and gave it a dimension of 800 * 800 pixels. Then, for clarity purposes, much like the the first graphics Python file, I set the background to white. To build the labels, I then decided to start by drawing a Text object at the point (20,50), and increasing each label by 50 pixels, to represent a linear of 10%, all the up to a possible 100% performance upgrade or performance downgrade. To denote the coloring, I decided to make two lines of code to create a Text object of both performance upgrade and downgrade: upgrade = Text(Point(100,540), "Blue denotes performance upgrade") downgrade = Text(Point(110,560), "Red denotes performance downgrade") I put up a.getMouse() function to get a mouse pointer. Similar to that of graph.py, I built a skeleton of the code for each command in terms of performance upgrade and performance downgrade (out of 100%): height = performance upgrade / downgrade * 100 command = Rectangle(Point(x+40,500), Point(y+40,500-height) // red = downgrade, blue = upgrade command.setFill(‘blue2’ or ‘red2’) command.setWidth(3) // default width In addition, I added some code to draw some Text labels right under the bar graph, and added a line of code to draw out the performance upgrade and downgrade of the command fully. label = Text(Point(x+40,520), “command”) label.draw(win) command.draw(win) I wrap up the file with a secondary .getMouse() function, and then close the performance complexity window with a win.close(). I then declare a main() function to run the whole program, with a decreased indent call. Diagram output: (via screensaver from my Mac):
  • 11. 11 D) Conclusions In conclusion, at the termination of this project, I have noticed several significant changes of data: In graph.py: - The commands overall are used very infrequently, with the exception of the read and access commands. This type of trend allows us to deduce that the algorithms which have given the user the permission to read files and access them via the file operator server are the best performing ones. It implies that the user
  • 12. 12 here is pretty strict about security, and that they must have done a lot of protection to prevent malicious activity of wrongly using files and phishing. - Also, there is a noticeable lack of total files and directories being created, which leads to the conclusion that the original server did not have many files and directories to begin with. This could mean both an advantage for the maintenance of the server and a disadvantage for those whom are trying to connect the server to other servers. - Finally, minus the obvious outliers of read and access commands, the data is generally uniformly distributed, with a standard deviation at about 1 file / second. In graph2.py: - The performance complexity shows a different story: in this file, read and access performance upgrades and downgrades are relatively low, which means that the algorithm is actually weak for improving readability and access of files in terms of complexity. - However, on the contrary, the rmdir has the highest downgrade at nearly 19%, while total_files skyrockets at nearly 80% upgrade! This type of outlying trend means that the user in the algorithm, for complexity, must have removed a lot of deprecated files and then forgot to remove the instances of the files, leading to a spike in total files made. Security in this case, is noticeably weaker in terms of performance upgrade and downgrade. So, the algorithm that is best to use for the user would absolutely be the last command, at total files, as it dwarfs the upgrade compared to other command complexities. Yet, when given a new set of baseline command averages and file operation averages, the figures would change significantly. For a more nuanced conclusion, the project would need to require at least two more baseline command averages and file operation averages from a different server. Thus, the conclusion is: the algorithm in general is efficient but it could be improved by increasing the security of files upon removal in Linux. E) Sourcing and Write Up of Code Sources used: http://linux.cloudibee.com/2009/12/fileop-filesystem-io-benchmarking-tool/ (for original file operation average numbers) http://stackoverflow.com/questions/13704860/zip-lists-in-python (for help with the zip() function in Python while building the backup.py file) http://www.cyberciti.biz/tips/linux-filesystem-benchmarking-with-iozone.html (in determining performance upgrade vs. downgrade for the graphics files in Python) http://www.iozone.org/src/current/fileop.c (Don Capp’s skeleton code in C that supervisor gave me to model my fileop.py on, without pointer manipulations)
  • 13. 13 http://stackoverflow.com/questions/15435751/installing-32-bit-libraries-glibc-on-64-bit-rhel- without-using-yum (in order to import the baseline average files, and install yum and sudo into my Mac to process the file operations) https://access.redhat.com/discussions/1404363#comment-904623 (more help on installing the iozone to begin pre-processing the file operation data in Linux) Write-up of all of the code (by Xcode editor without compile errors): Input.py: # input.py # Date: 7/05/2016 - 7/24/2016 # Author: Jason Lu (jasonlu6@bu.edu) # Supervisor: Jeff Horneback(jeff@drg.org) # Novetta Quality Assurance Intern Project #2 # Starter file for pre-processing the data, given a unit test of equal operations # Instructions: # Create a set of Python files that w illevaluate the performance ratings of the algorithms, # and then compare each other based on performance rating. For loops and various Python functions # are allow ed, but use of outside libraries besides import sys (import of the systemfile reader from Terminal) # is expressly forbidden. # Main functions of input.py: # 1) Print the input (unit) test table # 2) Format the average of each command in float type # import data from Mac Terminal file system, provided by supervisor import sys value = {} for i in range(20): value[i] = 0 counter = 1 #1 ) Print input table print("Input table: ") f = open('/Users/jasonlu/fileop/input', 'r') for line in f.readlines(): line.split() print(line.strip()) # w hite space print(" ") # 2) Print the averages: print("Averages") w ith open('/Users/jasonlu/fileop/input', 'r') as fd: first =fd.readline() next = first.split() for i in range(len(next)): value[i] = int(next[i]) for line in fd: temp = line.split() b = len(temp) for iin range(b): value[i] += int(temp[i]) counter += 1
  • 14. 14 for i in range(b): value[i] = value[i] / counter print(float(value[i])) Backup.py: # backup.py # Date: 7/05/2016 - 7/24/2016 # Author: Jason Lu (jasonlu6@bu.edu) # Backup file that w illpre-processthe originaldata into sliced index form # Instructions: # Create a set of Python files that w illevaluate the performance ratings of the algorithms, # and then compare each other based on performance rating. For loops and various Python functions # are allow ed, but use of outside libraries besides import sys (import of the systemfile reader from Terminal) # is expressly forbidden. # backup.py should be able to do the follow ing: # 1) Print the entire table in its generalform as fromthe Terminal # 2) Print the table in spliced index form import sys f = open('/Users/jasonlu/fileop/output', 'r') # open the file onto the Python console # remove title row title = f.readline() # read the file line by line, split into components, and # then concatenate themw hile stripping the new line for line in f.readlines(): # split line into parts line.split() print(line.strip()) # remove the first row , using the readline() to skip over the row data = f.readline() # Directory column selection of all the commands: to pre-process the values # get the values of the first column encapsulated w ith the average # fd = file designated # Source used for the column extraction: zip() function # http://stackoverflow.com/questions/15795306/read-selected-columns-from-text-file-into-a-list-in-python # initialize all values of the commands in a list mkdir = [] rmdir = [] create = [] read = [] w rite =[] close = [] stat = [] access =[] chmod = [] readdir = [] link = [] unlink = [] delete = [] total_files = [] # keep file open w hile pre-processing the values w ith open('/Users/jasonlu/fileop/output', 'r') as fd:
  • 15. 15 fd.readline() # get the columns indexed in the file for line in fd: # get the values of mkdir mkdir.append(line.split()[2]) rmdir.append(line.split()[3]) create.append(line.split()[4]) read.append(line.split()[5]) w rite.append(line.split()[6]) close.append(line.split()[7]) stat.append(line.split()[8]) access.append(line.split()[9]) chmod.append(line.split()[10]) readdir.append(line.split()[11]) link.append(line.split()[12]) unlink.append(line.split()[13]) # delete.append(line.split()[14]) # total_files.append(line.split()[15]) # print out the column content in commands (ordered fromfirst to last) # zip() function: returns a list of tuples that are contained w ithin the column, main # purpose is to encapsulate values of the commands, and abstract themin Python list form # a-j: indexers for the zip function (as column placeholders) col1 = [a for a in zip(mkdir)] col2 = [b for b in zip(rmdir)] col3 = [c for c in zip(create)] col4 = [d for d in zip(read)] col5 = [e for e in zip(w rite)] col6 = [f for f in zip(close)] col7 = [g for g in zip(stat)] col8 = [h for h in zip(access)] col9 = [i for i in zip(chmod)] col10 = [j for j in zip(readdir)] col11 = [k for k in zip(link)] col12 = [l for l in zip(unlink)] # col13 = [m for m in zip(delete)] # col14 = [n for n in zip(total_files)] # print out the values of the commands print(col1) print(col2) print(col3) print(col4) print(col5) print(col6) print(col7) print(col8) print(col9) print(col10) print(col11) print(col12) # print(col13) # print(col14) fileop.py: # fileop.py # Date: 7/05/2016 - 7/24/2016 # Author: Jason Lu (jasonlu6@bu.edu) # Supervisor: Jeff Horneback(jeff@drg.org) # Novetta Quality Assurance Intern Project #2 # Main testing file for various iozone and RPM algorithm tests # Instructions: # Create a set of Python files that w illevaluate the performance ratings of the algorithms, # and then compare each other based on performance rating. For loops and various Python functions # are allow ed, but use of outside libraries besides import sys (import of the systemfile reader from Terminal) # is expressly forbidden.
  • 16. 16 # fileop.py should be able to do the follow ing: (as a file operator / optimizer program) # 1) Replicate the data of all 12 commands fromthe Terminal file given (frompackage imports), # w hile having the title removed # 2) Average out the values of the performances (with only values and commands encapsulated) # 3) Compare the performance values together # 4) Figure out the performance upgrade / dow ngrade of the files compared to given baseline averages # at /Users/jasonlu/fileop/baseline path directory # Hint: performance downgrade/ upgrade = (old - new ) / new * 100% # 5) Give a final report of all attributes and determine w hich is the best # command to use for the client (in a separate file called graph.py, using # Python graphics 3.0 to make a graph of the observations) import sys value = {} for i in range(20): value[i] = 0 counter = 1 # 1) Print the table out first # get the input in terms of a tuple: # (command: [value] op/sec) print("Table of output: ") f = open('/Users/jasonlu/fileop/title', 'r') for line in f.readlines(): line.split() print(line.strip()) data = f.readline() # w hite space print (" ") # 2) Pre-process the data into float values (unformatted) print("Averages: ") w ith open('/Users/jasonlu/fileop/title', 'r') as fd: fd.readline() first =fd.readline() second =first.split() for i in range(len(second)): value[i] = float(second[i]) for line in fd: temp = line.split() for iin range(len(temp)): value[i] += float(temp[i]) counter += 1 for i in range(len(temp)): value[i] = value[i] / counter # calculating the average of each command # w hite space: print(" ") print("Formated averages in files / second of each command: ") # 3) Format the averge into tuples w ith open('/Users/jasonlu/fileop/title', 'r') as fd: cmd = fd.readline() name = cmd.split() for i in range(len(temp)): tuple = (name[i] + " has average of " + str(float(value[i])) + " files / second") print(tuple) counter += 1
  • 17. 17 # w hite space print(" ") print("Baseline averages in files / second of each command: ") # read from the baseline file (given by Supervisor) # fo: file output w ith open('/Users/jasonlu/fileop/baseline' , 'r') as fo: for line in fo.readlines(): line.split() print(line.strip()) # pre-processthe averages of each data value in baseline: # fp: file pre-processor w ith open ('/Users/jasonlu/fileop/baseline', 'r') as fp: first =fp.readline() next = first.split() for i in range(len(second)): value[i] = float(second[i]) # 4) Performance Dow ngrade (determine if the percentage has increased or decreased # Increase: fileop > baseline # Decrease: fileop < baseline # No change: fileop = baseline # begin the process of performance upgrade and downgrades w ith open ('/Users/jasonlu/fileop/baseline', 'r') as fb: fb.readline() # skip the command line val= fb.readline() number = val.split() for i in range(len(temp)): num = float(number[i]) vals = float(value[i]) if vals < num: dow ngrade =((num- vals) / num) dow n_percent =downgrade * 100 print("Performance downgrade of : " + str(down_percent)+ "%.") elif vals > num: upgrade = ((vals - num) / vals) up_percent =upgrade * 100 print("Performance upgrade of: " + str(up_percent) + "%") else: print("No change in command complexity. ") graph.py: # graph.py # Date: 7/16/2016 - 7/24/2016 # Author: Jason Lu (jasonlu6@bu.edu) # Supervisor: Jeff Horneback(jeff@drg.org) # Novetta Quality Assurance Intern Project #2 # This file uses Python graphics to create a bar graph that w illbe the basis of the experimental results # diagrams in the fileop report # This file requires Zelle's graphics.py concurrentlyopen to be executable # Instructions: # Create a set of Python files that w illevaluate the performance ratings of the algorithms, # and then compare each other based on performance rating. For loops and various Python functions # are allow ed, but use of outside libraries besides import sys (import of the systemfile reader from Terminal) # is expressly forbidden. The graph.py and graph2.py files have different instructions. # Graph components: # 0) The graphics are imported fromZelle's graphics library # 1) Title should be named "Command Averages", window size at MAXIMUM is 1000 * 1000 pixels # 2) X-axis: command names
  • 18. 18 # 3) Y-axis: file operations / second # 4) Colored of your ow n choosing # 5) Uniform w idth and w hite-space between each command # Statistics fromfileop.py (out of a total 500,000 files/s possible): # mkdir: 795 files/s close: 2282 files/s link: 579 files/s # rmdir: 771 files/s stat: 1128 files/s unlink: 825 files/s # create: 1381 files/s access: 312914 files/s delete: 809 files/s # read: 22915 files/s chmod: 1697 files/s total_files: 1000 files/s # w rite: 1147 files/s readdir: 742 files/s # import graphics library fromgraphics import * # main function to draw the graph def main(): # General description print("This graph w illshow the file operations averages for each of the Linux commands") # Create a graphics w indow to build w in =GraphWin("Command Averages", 800, 800) # w hite background for clarity w in.setBackground("white") # get a mouse pointer w in.getMouse() # Build the labels Text(Point(20, 50), '500,000').draw (win) Text(Point(20, 100), '450,000').draw(win) Text(Point(20, 150), '400,000').draw(win) Text(Point(20, 200), '350,000').draw(win) Text(Point(20, 250), '300,000').draw(win) Text(Point(20, 300), '250,000').draw(win) Text(Point(20, 350), '200,000').draw(win) Text(Point(20, 400), '150,000').draw(win) Text(Point(20, 450), '100,000').draw(win) w in.getMouse() #Bar w idth: 20 pixels long, 450-height in height # Scale: 500:500,000 ratio given the scaling of the Graphics canvas) # Draw a bar for mkdir command height1 = 0.00159 * 1000 # 795 / 500,000 files/s mkdir = Rectangle(Point(60,450), Point(80,450-height1)) mkdir.setFill('red') mkdir.setWidth(2) mkdir.draw (win) # Draw a bar for rmdir command height2 = 0.001542 * 1000 # 771 / 500,000 files/s rmdir = Rectangle(Point(100,450), Point(120, 450-height2)) rmdir.setFill('orange') rmdir.setWidth(2) rmdir.draw (win) # Draw a bar for create command height3 = 0.002762 * 1000 # 1381 / 500,000 files/s create = Rectangle(Point(140, 450), Point(160, 450-height3)) create.setFill('yellow ') create.setWidth(2) create.draw(win) # Draw a bar for read command height4 = 0.04583 * 1000 # 22915 / 500,000 files/s read = Rectangle(Point(180, 450), Point(200, 450-height4)) read.setFill('green2') read.setWidth(2) read.draw(win)
  • 19. 19 # Draw a bar for w rite command height5 = 0.002294 * 1000 # 1147 / 500,000 files/s w rite =Rectangle(Point(220, 450), Point(240, 450-height5)) w rite.setFill('blue') w rite.setWidth(2) w rite.draw(win) # Draw a bar for close command height6 = 0.004564 * 1000 # 2282 / 500,000 files /s close = Rectangle(Point(260,450), Point(280, 450-height6)) close.setFill('blue2') close.setWidth(2) close.draw(win) # Draw a bar for stat command height7 = 0.00256 * 1000 # 1128 / 500,000 files /s stat = Rectangle(Point(300,450), Point(320, 450-height7)) stat.setFill('purple') stat.setWidth(2) stat.draw(win) # Draw a bar for access command height8 = 0.625828 * 500 # figure out the exact scale later access =Rectangle(Point(340,450), Point(360,450 - height8)) access.setFill('red') access.setWidth(2) access.draw(win) # Draw a bar for chmod command height9 = 0.003394 * 1000 # 1697 / 500,000 files /s chmod = Rectangle(Point(380,450), Point(400,450-height9)) chmod.setFill('orange') chmod.setWidth(2) chmod.draw (win) # Draw a bar for the readdir command height10 = 0.001484 * 1000 # 742 / 500,000 files /s readdir = Rectangle(Point(420,450), Point(440,450-height10)) readdir.setFill('yellow ') readdir.setWidth(2) readdir.draw(win) # Draw a bar for the link command height11 = 0.001158 * 1000 # 579 / 500,000 files /s link = Rectangle(Point(460,450), Point(480,450-height11)) link.setFill('green2') link.setWidth(2) link.draw (win) # Draw a bar for the unlink command height12 = 0.00165 * 1000 # 825 / 500,000 files /s unlink = Rectangle(Point(500,450), Point(520,450-height12)) unlink.setFill('blue') unlink.setWidth(2) unlink.draw (win) # Draw a bar for the delete command height13 = 0.001618 * 1000 # 809 / 500,000 file /s delete = Rectangle(Point(540,450), Point(560,450-height13)) delete.setFill('blue2') delete.setWidth(2) delete.draw (win) # Draw a bar for the total_files command height14 = 0.002 * 1000 # 1000 / 500,000 files /s total_files = Rectangle(Point(580,450), Point(600,450-height14)) total_files.setFill('purple') total_files.setWidth(2) total_files.draw(win)
  • 20. 20 # Setting the text interfaces # 470: deflaut y-value of the text (for legibility reasons) # x-value: midpoint betw een the w hite-spaces of the rectangles' widths) label1 = Text(Point(70,470), " mkdir ") label1.draw (win) label2 = Text(Point(110,470), "rmdir") label2.draw (win) label3 = Text(Point(150,470), "create") label3.draw (win) label4 = Text(Point(190,470), "read") label4.draw (win) label5 = Text(Point(230,470), "w rite") label5.draw (win) label6 = Text(Point(270,470), "close") label6.draw (win) label7 = Text(Point(310,470), "stat") label7.draw (win) label8 = Text(Point(350,470), "access") label8.draw (win) label9 = Text(Point(390,470), "chmod") label9.draw (win) label10 = Text(Point(430,470), "readdir") label10.draw (win) label11 = Text(Point(470,470), "link") label11.draw (win) label12 = Text(Point(510,470), "unlink") label12.draw (win) label13 = Text(Point(550,470), "delete") label13.draw (win) label14 = Text(Point(590,470), "total_files") label14.draw (win) # draw each bar graph simultaneously (proportionate to the scaling provided) w in.getMouse() # close the w indow (to avoid an exception) # w ait for click, and then quit w in.close() main() graph2.py: # graph2.py # Date: 7/16/2016 - 7/24/2016 # Author: Jason Lu (jasonlu6@bu.edu) # Supervisor: Jeff Horneback(jeff@drg.org) # Novetta Quality Assurance Intern Project #2 # This file uses Python graphics to create a bar graph that summarizes the performance # upgrades and dow ngradesof each Linux command # This file requires Zelle's graphics.py concurrentlyopen to be executable # Instructions:
  • 21. 21 # Create a set of Python files that w illevaluate the performance ratings of the algorithms, # and then compare each other based on performance rating. For loops and various Python functions # are allow ed, but use of outside libraries besides import sys (import of the systemfile reader from Terminal) # is expressly forbidden. The graph.py and graph2.py files have different instructions. # Graph components: # 0) The graphics are imported fromZelle's graphics library # 1) Title should be named "Performance Complexity", w indow size at MAXIMUM is 1000 * 1000 pixels # 2) X-axis: command names # 3) Y-axis: % upgrade / dow ngrade (out of 100) # 4) Blue: upgrade, Red: dow ngrade # 5) Uniform w idth and w hite-space between each command # Statistics fromfileop.py (out of a total 100% upgrade or dow ngrade): # mkdir: 795 files/s close: 2282 files/s link: 579 files/s # rmdir: 771 files/s stat: 1128 files/s unlink: 825 files/s # create: 1381 files/s access: 312914 files/s delete: 809 files/s # read: 22915 files/s chmod: 1697 files/s total_files: 1000 files/s # w rite: 1147 files/s readdir: 742 files/s # import graphics library fromgraphics import * # main function to draw the graph def main(): # General description print("This graph w illshow the performance upgradesand downgradesof each command betw een fileop and baseline") # Create a graphics w indow to build w in =GraphWin("Performance Complexity", 800, 800) # w hite background for clarity w in.setBackground("white") # get a mouse pointer w in.getMouse() # Build the labels Text(Point(20, 50), '100%').draw(win) Text(Point(20, 100), '90%').draw(win) Text(Point(20, 150), '80%').draw(win) Text(Point(20, 200), '70%').draw(win) Text(Point(20, 250), '60%').draw(win) Text(Point(20, 300), '50%').draw(win) Text(Point(20, 350), '40%').draw(win) Text(Point(20, 400), '30%').draw(win) Text(Point(20, 450), '20%').draw(win) Text(Point(20, 500), '10%').draw(win) # Denote the colorings upgrade = Text(Point(100,540), "Blue denotes performance upgrade") dow ngrade =Text(Point(110,560), "Red denotes performance dow ngrade") upgrade.draw(win) dow ngrade.draw(win) w in.getMouse() # Draw a label for the mkdir performance upgrade height1 = 0.0185 * 100 mkdir = Rectangle(Point(40,500), Point(60, 500-height1)) mkdir.setFill('blue2') mkdir.setWidth(3) label1 = Text(Point(50,520), " mkdir ") label1.draw (win) mkdir.draw (win) # Draw a label for the rmdir performance downgrade height2 = 0.1958 * 450
  • 22. 22 rmdir = Rectangle(Point(80,500), Point(100,500-height2)) rmdir.setFill('red2') rmdir.setWidth(3) label2 = Text(Point(90,520), "rmdir") label2.draw (win) rmdir.draw (win) # Draw a label for the create performance upgrade height3 = 0.0136 * 100 create = Rectangle(Point(120,500), Point(140,500-height3)) create.setFill('blue2') create.setWidth(3) label3 = Text(Point(130,520), "create") label3.draw (win) create.draw(win) # Draw a label for the read performance upgrade height4 = 0.0249 * 100 read = Rectangle(Point(160, 500), Point(180,500-height4)) read.setFill('blue2') read.setWidth(3) label4 = Text(Point(170,520), "read") label4.draw (win) read.draw(win) # Draw a label for the w rite performance upgrade height5 = 0.0675 * 100 w rite =Rectangle(Point(200,500), Point(220,500-height5)) w rite.setFill('blue2') w rite.setWidth(3) label5 = Text(Point(210, 520), "w rite") label5.draw (win) w rite.draw(win) # Draw a label for the close performance upgrade height6 = 0.1453 * 100 close = Rectangle(Point(240, 500), Point(260, 500-height6)) close.setFill('blue2') close.setWidth(3) label6 = Text(Point(250, 520), "close") label6.draw (win) close.draw(win) # Draw a label for the stat performance dow ngrade height7 = 0.07780 * 100 stat = Rectangle(Point(280, 500), Point(300, 500-height7)) stat.setFill('red2') stat.setWidth(3) label7 = Text(Point(290, 520), "stat") label7.draw (win) stat.draw(win) # Draw a label for the access performance downgrade height8 = 0.0404 * 100
  • 23. 23 access =Rectangle(Point(320, 500), Point(340,500 - height8)) access.setFill('red2') access.setWidth(3) label8 = Text(Point(330,520), "access") label8.draw (win) access.draw(win) # Draw a label for the chmod performance dow ngrade height9 = 0.0807 * 100 chmod = Rectangle(Point(360, 500), Point(380, 500-height9)) chmod.setFill('red2') chmod.setWidth(3) label9 = Text(Point(370, 520), "chmod") label9.draw (win) chmod.draw (win) # Draw a label for the readdir performance upgrade height10 = 0.0725 * 100 readdir = Rectangle(Point(400,500), Point(420, 500-height10)) readdir.setFill('blue2') readdir.setWidth(3) label10 = Text(Point(410, 520), "readdir") label10.draw (win) readdir.draw(win) # Draw a label for link performance upgrade height11 = 0.035 * 100 link = Rectangle(Point(440,500), Point(460, 500-height11)) link.setFill('blue2') link.setWidth(3) label11 = Text(Point(450, 520), "link") label11.draw (win) link.draw (win) # Draw a label for unlink performance dow ngrade height12 = 0.0182 * 100 unlink = Rectangle(Point(480,500), Point(500, 500-height12)) unlink.setFill('red2') unlink.setWidth(3) label12 = Text(Point(490, 520), "unlink") label12.draw (win) unlink.draw (win) # Draw a label for delete performance downgrade height13 = 0.0729 * 100 delete = Rectangle(Point(520,500), Point(540, 500-height13)) delete.setFill('red2') delete.setWidth(3) label13 = Text(Point(530, 520), "delete") label13.draw (win) delete.draw (win) # Draw a label for total_files performance upgrade
  • 24. 24 height14 = 0.80 * 437.5 total_files = Rectangle(Point(560,500), Point(580, 500-height14)) total_files.setFill('blue2') total_files.setWidth(3) label14 = Text(Point(570, 520), "total files") label14.draw (win) total_files.draw(win) w in.getMouse() w in.close() main()