
Recommandé
Recommandé
Contenu connexe
Tendances
Tendances (16)
Similaire à Grocery Shopping Survey
Similaire à Grocery Shopping Survey (20)
Plus de Jeffrey Henning
Plus de Jeffrey Henning (8)
Dernier
Dernier (20)
Grocery Shopping Survey
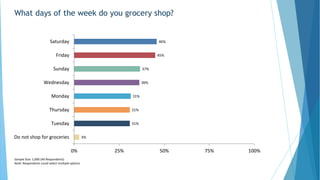
- 1. What days of the week do you grocery shop? 46% 45% 37% 36% 31% 31% 31% 3% 0% 25% 50% 75% 100% Saturday Friday Sunday Wednesday Monday Thursday Tuesday Do not shop for groceries Sample Size: 1,000 (All Respondents) Note: Respondents could select multiple options
- 2. What days of the week do you grocery shop? Which of the following best describes your current employment status? Employe d full- time Employe d part- time Owner, Partner in a business Self- employe d Not employe d Homema ker Retired Student Not working/ currently on disability (%) (%) (%) (%) (%) (%) (%) (%) (%) Sunday 38 46 32 26 42 36 ⇓ 29 41 39 Monday ⇓ 28 32 26 26 33 ⇑ 44 33 12 ⇑ 44 Tuesday ⇓ 25 34 32 32 30 ⇑ 44 33 12 ⇑ 42 Wednesday ⇓ 32 35 37 37 42 47 44 18 ⇑ 51 Thursday ⇓ 25 38 26 30 34 ⇑ 41 36 35 ⇑ 44 Friday ⇓ 36 40 47 35 ⇑ 59 ⇑ 59 43 24 ⇑ 58 Saturday 47 40 53 40 52 43 ⇓ 37 53 49 Do not shop for groceries 3 4 0 4 ⇑ 8 1 ⇓ 0 0 4 Base n=453 n=68 n=19 n=57 n=73 n=90 n=166 n=17 n=57 Sample Size: 1,000 (All Respondents)
- 3. What days of the week do you grocery shop? Nested Gender and Age Male 18-24 Male 25-34 Male 35-44 Male 45-54 Male 55-64 Male 65+ Femal e 18- 24 Femal e 25- 34 Femal e 35- 44 Femal e 45- 54 Femal e 55- 64 Femal e 65+ (%) (%) (%) (%) (%) (%) (%) (%) (%) (%) (%) (%) Sunday ⇓ 23 41 34 37 38 37 37 ⇑ 51 44 28 34 29 Monday 23 27 36 30 27 39 25 34 ⇑ 42 31 27 28 Tuesday 25 30 28 30 30 30 20 32 33 38 31 29 Wednesday ⇓ 25 34 38 45 35 ⇑ 49 27 39 42 32 44 32 Thursday 30 ⇓ 22 30 32 27 40 31 33 32 32 36 32 Friday 38 ⇓ 29 35 43 35 40 42 ⇑ 53 48 ⇑ 53 47 47 Saturday ⇓ 30 48 ⇓ 35 54 44 41 47 ⇑ 58 46 46 44 42 Do not shop for groceries ⇑ 13 ⇑ 7 5 1 0 0 ⇑ 8 0 0 2 0 0 Base n=61 n=97 n=107 n=97 n=66 n=82 n=59 n=93 n=103 n=93 n=64 n=78 Sample Size: 1,000 (All Respondents)
- 4. How often do you purchase groceries online? 58% 16% 16% 6% 3% 0% 25% 50% 75% 100% Never Rarely Sometimes Often Always Sample Size: 972 (97% of Respondents)
- 5. How often do you purchase groceries online? Which of the following groups describes your current age? 18-24 25-34 35-44 45-54 55-64 65+ (%) (%) (%) (%) (%) (%) [Never + Rarely] 69 ⇓ 58 ⇓ 61 75 ⇑ 86 ⇑ 89 Never 52 ⇓ 40 ⇓ 43 58 ⇑ 68 ⇑ 78 Rarely 17 17 19 17 18 12 Sometimes 22 21 ⇑ 22 18 ⇓ 8 ⇓ 9 Often 7 ⇑ 11 10 6 3 ⇓ 1 Always 2 ⇑ 9 ⇑ 6 ⇓ 1 2 ⇓ 0 [Often + Always] 8 ⇑ 21 ⇑ 16 7 ⇓ 5 ⇓ 1 Base n=107 n=183 n=205 n=187 n=130 n=160 Sample Size: 972 (97% of Respondents)
- 6. Have you ever ordered groceries using a voice assistant? 10% 90% Yes No Sample Size: 958 (96% of Respondents)
- 7. Have you ever ordered groceries using a voice assistant? Which of the following groups describes your current age? 18-24 25-34 35-44 45-54 55-64 65+ (%) (%) (%) (%) (%) (%) Yes 11 ⇑ 21 ⇑ 20 ⇓ 7 ⇓ 4 ⇓ 1 No 89 ⇓ 79 ⇓ 80 ⇑ 93 ⇑ 96 ⇑ 99 Base n=101 n=179 n=205 n=183 n=130 n=160 Sample Size: 958 (96% of Respondents)
- 8. Have you ever ordered groceries using a voice assistant? Nested Gender and Age Male 18-24 Male 25-34 Male 35-44 Male 45-54 Male 55-64 Male 65+ Femal e 18- 24 Femal e 25- 34 Femal e 35- 44 Femal e 45- 54 Femal e 55- 64 Femal e 65+ (%) (%) (%) (%) (%) (%) (%) (%) (%) (%) (%) (%) Yes 12 ⇑ 27 ⇑ 31 7 6 ⇓ 2 10 15 10 6 ⇓ 2 ⇓ 0 No 88 ⇓ 73 ⇓ 69 93 94 ⇑ 98 90 85 90 94 ⇑ 98 ⇑ 100 Base n=50 n=86 n=102 n=94 n=66 n=82 n=51 n=93 n=103 n=89 n=64 n=78 Sample Size: 958 (96% of Respondents)
- 9. When shopping for groceries, how frequently do you purchase meat? 2% 6% 28% 39% 26% 0% 25% 50% 75% 100% Never Rarely Sometimes Often Always Sample Size: 972 (97% of Respondents)
- 10. When shopping for groceries, how frequently do you purchase meat? Which of the following groups describes your current age? 18-24 25-34 35-44 45-54 55-64 65+ (%) (%) (%) (%) (%) (%) [Never + Rarely] 11 6 7 10 6 ⇑ 13 Never 2 3 2 1 2 2 Rarely 9 ⇓ 3 5 9 5 ⇑ 11 Sometimes 25 23 ⇓ 21 ⇓ 20 ⇑ 35 ⇑ 41 Often 36 37 40 43 38 39 Always 28 ⇑ 34 ⇑ 32 27 21 ⇓ 7 [Often + Always] 64 ⇑ 71 ⇑ 71 70 59 ⇓ 46 Base n=107 n=183 n=205 n=187 n=130 n=160 Sample Size: 972 (97% of Respondents)
- 11. When shopping for groceries, how frequently do you purchase meat? Do you have any children 25 or younger living in your household? Yes No (%) (%) [Never + Rarely] ⇓ 5 ⇑ 11 Never ⇓ 1 ⇑ 3 Rarely ⇓ 4 ⇑ 8 Sometimes ⇓ 21 ⇑ 31 Often 39 39 Always ⇑ 35 ⇓ 19 [Often + Always] ⇑ 74 ⇓ 58 Base n=380 n=592 Sample Size: 972 (97% of Respondents)
- 12. When shopping for groceries, how frequently do you purchase meat? Including yourself and any children, how many people are currently living in your household? 1 2 3 4 5 6 (%) (%) (%) (%) (%) (%) [Never + Rarely] ⇑ 16 8 6 5 8 0 Never ⇑ 5 1 2 1 2 0 Rarely ⇑ 11 7 4 5 6 0 Sometimes ⇑ 36 30 23 22 ⇓ 16 15 Often ⇓ 32 42 39 ⇑ 46 36 27 Always ⇓ 16 ⇓ 20 ⇑ 32 27 ⇑ 41 58 [Often + Always] ⇓ 48 61 ⇑ 71 ⇑ 73 ⇑ 77 85 Base n=209 n=301 n=198 n=165 n=64 n=26 Sample Size: 972 (97% of Respondents)
- 13. When shopping for groceries, how frequently do you purchase meat? Region Northeast Midwest South West (%) (%) (%) (%) [Never + Rarely] 6 9 9 11 Never 2 2 2 2 Rarely 4 7 7 9 Sometimes 26 24 25 ⇑ 33 Often 41 41 38 38 Always 27 27 28 ⇓ 18 [Often + Always] 68 67 66 ⇓ 56 Base n=176 n=222 n=350 n=224 Sample Size: 972 (97% of Respondents)
- 15. What is your gender? - Weighting Question 52% 48% Female Male Sample Size: 1,000 (All Respondents)
- 16. Which of the following groups describes your current age? - Weighting Question 12% 19% 17% 19% 16% 17% 0% 25% 50% 75% 100% 13-17 18-24 25-34 35-44 45-54 55-64 65 or more Sample Size: 1,000 (All Respondents)
- 17. Which of the following best describes your marital status? 46% 32% 7% 9% 4% 1% 0% 25% 50% 75% 100% Married Single, never married Living with a partner Divorced Widowed Separated Sample Size: 1,000 (All Respondents)
- 18. Do you have any children 25 or younger living in your household? 37% 63% Yes No Sample Size: 1,000 (All Respondents)
- 19. Which of the following groups describes your annual household income? 23% 12% 16% 22% 11% 9% 3% 3% 0% 25% 50% 75% 100% Below $25,000 $25,000 - $34,999 $35,000 - $49,999 $50,000 - $74,999 $75,000 - $99,999 $100,000 - $149,999 $150,000 - $199,999 $200,000 or more Sample Size: 1,000 (All Respondents)
- 20. Are you of Hispanic, Spanish or Latino descent? - Weighting Question 13% 87% Yes No Sample Size: 1,000 (All Respondents)
- 21. Which of the following best describes your ethnicity? - Weighting Question 73% 13% 6% 4% 3% 1% 0% 0% 25% 50% 75% 100% Caucasian African American Asian Other Race Mixed Race American Indian/Alaska Native Native Hawaiian/Other Pacific Islander Sample Size: 1,000 (All Respondents)
- 22. Including yourself and any children, how many people are currently living in your household? 21% 33% 19% 16% 7% 3% 0% 0% 0% 0% 0% 25% 50% 75% 100% 1 2 3 4 5 6 7 8 9 10 or more Sample Size: 1,000 (All Respondents)
- 23. What is the highest degree or level of school you have completed? - Weighting Question 9% 24% 22% 5% 9% 20% 2% 9% 1% 0% 25% 50% 75% 100% Some High School or less High School Graduate or equivalent Some college Technical/Vocational Degree Associate Degree Bachelors Degree Professional Degree Master's Degree PhD None of the above Sample Size: 1,000 (All Respondents)
- 24. Which of the following best describes your current employment status? 40% 7% 2% 5% 8% 10% 18% 2% 7% 0% 25% 50% 75% 100% Employed full-time Employed part-time Owner, Partner in a business Self-employed Not employed Homemaker Retired Student Not working/currently on disability Sample Size: 1,000 (All Respondents)
- 25. Nested Gender and Age - Top 10 10% 10% 9% 9% 9% 9% 9% 8% 8% 8% 0% 25% 50% 75% 100% Female 25-34 Female 45-54 Female 35-44 Male 25-34 Male 45-54 Female 65 or more Female 55-64 Male 65 or more Male 35-44 Male 55-64 Sample Size: 1,000 (All Respondents)
- 26. Nested Gender and Age Option Rank Response % Female 25-34 1 10% Female 45-54 2 10% Female 35-44 3 9% Male 25-34 4 9% Male 45-54 5 9% Female 65+ 6 9% Female 55-64 7 9% Male 65+ 8 8% Male 35-44 9 8% Male 55-64 10 8% Male 18-24 11 7% Female 18-24 12 6% Sample Size: 1,000 (All Respondents)
- 27. Region - Weighting Question 38% 23% 21% 18% 0% 25% 50% 75% 100% South West Midwest Northeast Sample Size: 1,000 (All Respondents)
- 28. State - Top 10 10% 9% 6% 6% 6% 4% 4% 4% 3% 3% 0% 25% 50% 75% 100% California Florida New York Pennsylvania Texas Illinois Ohio Georgia Michigan Arizona Sample Size: 1,000 (All Respondents)
- 29. Methodology This online survey had 1,000 respondents. It was fielded from June 18 to June 19, 2019. The results presented in this report were weighted by the following variables: • What is your gender? • Which of the following groups describes your current age? • Are you of Hispanic, Spanish or Latino descent? • Which of the following best describes your ethnicity? • What is the highest degree or level of school you have completed? • Region
- 30. Crosstab Methodology Crosstab Table Notes: • Only crosstab tables with significant differences of at least 10 percentage points are included here. • If the difference is higher at a statistically significant level, the cell is marked with the up - arrow symbol ⇑. If it is lower, the down-arrow symbol ⇓ is used. • Columns with fewer than 30 responses (i.e. degrees of freedom) are ignored for statistical significance comparisons. • Crosstabs with no significant difference greater than 10 percentage points are not presented. • To fit onto a single slide, some crosstabs have had columns without differences omitted. See the spreadsheet for the full crosstabs. • Crosstabs show only unweighted results. • See the accompanying spreadsheet for all tables.
- 31. Researchscape International Researchscape International is a market-research consultancy specializing in custom surveys. For questions about this or other research, please contact us at +1-888-983-1675 x1 or visit our website, http://www.researchscape.com/.