
Recommandé
Recommandé
Contenu connexe
Similaire à Impressions of Tom Brady and Other QBs and Coaches
Similaire à Impressions of Tom Brady and Other QBs and Coaches (10)
Plus de Jeffrey Henning
Dernier
Dernier (20)
Impressions of Tom Brady and Other QBs and Coaches
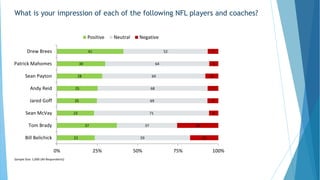
- 1. What is your impression of each of the following NFL players and coaches? 41 30 28 25 25 23 37 23 52 64 64 68 69 71 37 59 7 6 8 7 7 6 26 18 0% 25% 50% 75% 100% Drew Brees Patrick Mahomes Sean Payton Andy Reid Jared Goff Sean McVay Tom Brady Bill Belichick Positive Neutral Negative Sample Size: 1,000 (All Respondents)
- 2. What is your impression of … Tom Brady? Region Tom Brady Northeast Midwest South West (%) (%) (%) (%) Positive ⇑ 46 ⇓ 31 39 43 Neutral 30 ⇑ 44 34 34 Negative 24 26 27 24 Base n=181 n=231 n=360 n=228 Sample Size: 1,000 (All Respondents)
- 3. What is your impression of … Tom Brady? Nested Gender and Age Tom Brady Male 18-24 Male 25-34 Male 35-44 Male 45-54 Male 55-64 Male 65+ Female 18-24 Female 25-34 Female 35-44 Female 45-54 Female 55-64 Female 65+ (%) (%) (%) (%) (%) (%) (%) (%) (%) (%) (%) (%) Positive 49 37 ⇑ 62 40 42 46 39 30 31 ⇓ 27 31 36 Neutral 26 29 27 ⇓ 23 35 34 39 ⇑ 48 36 44 47 40 Negative 25 ⇑ 34 ⇓ 10 ⇑ 37 23 20 22 22 33 29 22 24 Base n=61 n=97 n=106 n=98 n=66 n=82 n=59 n=93 n=103 n=93 n=64 n=78 Sample Size: 1,000 (All Respondents) Which of the following groups describes your annual household income? Tom Brady Below $25,000 $25,000 - $34,999 $35,000 - $49,999 $50,000 - $74,999 $75,000 - $99,999 $100,000 - $149,999 $150,000 - $199,999 $200,000+ (%) (%) (%) (%) (%) (%) (%) (%) Positive ⇓ 31 40 43 35 38 ⇑ 54 ⇑ 58 38 Neutral 40 43 39 32 30 29 21 43 Negative 29 ⇓ 17 ⇓ 18 ⇑ 33 ⇑ 33 ⇓ 17 21 19 Base n=242 n=110 n=145 n=182 n=141 n=126 n=33 n=21
- 4. What one word comes to mind when you think of Tom Brady, the quarterback for the New England Patriots?
- 5. What one word comes to mind when you think of Tom Brady, the quarterback for the New England Patriots? Word # Respondents Example Quote Cheater 107 "Cheater." Good 61 "Good." Goat 39 "Goat." Great 37 "Greatest." Nothing 36 "Nothing. Im a packers fan." Talent 32 "Talented." Winner 27 "Winner." Football 27 "Football." Arrogant 22 "Arrogant." Old 21 "Old."
- 6. Do you watch National Football League games? 60% 40% Yes No Sample Size: 1,000 (All Respondents)
- 7. Which NFL team do you typically root for? - Top 10 10% 8% 6% 6% 5% 5% 5% 4% 4% 3% 0% 25% 50% 75% 100% Dallas Cowboys New England Patriots Pittsburgh Steelers Chicago Bears New York Giants Philadelphia Eagles Seattle Seahawks Atlanta Falcons San Francisco 49ers Cleveland Browns Sample Size: 620 (62% of Respondents)
- 8. Which NFL team do you typically root for? Option Rank Response % Dallas Cowboys 1 10% New England Patriots 2 8% Pittsburgh Steelers 3 6% Chicago Bears 4 6% New York Giants 5 5% Philadelphia Eagles 6 5% Seattle Seahawks 7 5% Atlanta Falcons 8 4% San Francisco 49ers 9 4% Cleveland Browns 10 3% Arizona Cardinals 11 3% None 12 3% Carolina Panthers 13 3% New Orleans Saints 14 3% Detroit Lions 15 3% Los Angeles Rams 16 3% Denver Broncos 17 3% Sample Size: 620 (62% of Respondents) Option Rank Response % Green Bay Packers 18 2% Miami Dolphins 19 2% Kansas City Chiefs 20 2% Buffalo Bills 21 2% Minnesota Vikings 22 2% Baltimore Ravens 23 2% Tennessee Titans 24 2% Washington Redskins 25 2% Houston Texans 26 2% Tampa Bay Buccaneers 27 2% New York Jets 27 2% Oakland Raiders 29 1% Indianapolis Colts 30 1% Cincinnati Bengals 31 1% Los Angeles Chargers 32 <1% Jacksonville Jaguars 33 <1%
- 9. Who are you rooting for to win Super Bowl LIII? 38% 37% 26% 0% 25% 50% 75% 100% Los Angeles Rams Neither New England Patriots Sample Size: 1,000 (All Respondents)
- 10. Methodology This online survey had 1,000 respondents. It was fielded from January 30 to January 31, 2019. The results presented in this report were weighted by the following variables: • What is your gender? • Which of the following groups describes your current age? • Are you of Hispanic, Spanish or Latino descent? • Which of the following best describes your ethnicity? • What is the highest degree or level of school you have completed? • Region
- 11. Crosstab Methodology Crosstab Table Notes: • If the difference is higher at a statistically significant level, the cell is marked with the up - arrow symbol ⇑. If it is lower, the down-arrow symbol ⇓ is used. • Columns with fewer than 30 responses (i.e. degrees of freedom) are ignored for statistical significance comparisons. • Crosstabs with no significant difference greater than 10 percentage points are not presented. • To fit onto a single slide, some crosstabs have had columns without differences omitted. See the spreadsheet for the full crosstabs. • Crosstabs show only unweighted results. • See the accompanying spreadsheet for all tables.
- 12. Researchscape International Researchscape International is a market-research consultancy specializing in custom surveys. For questions about this or other research, please contact us at +1-888-983-1675 x1 or visit our website, http://www.researchscape.com/.