Beginners Guide to TikTok for Search - Rachel Pearson - We are Tilt __ Bright...
Summary: Voice Assistants Survey
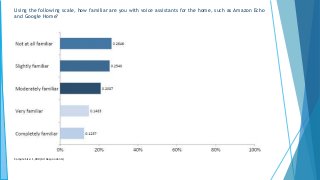
1. Using the following scale, how familiar are you with voice assistants for the home, such as Amazon Echo
and Google Home?
Sample Size: 1,000 (All Respondents)
2. Using the following scale, how familiar are you with voice assistants for the home, such as Amazon Echo
and Google Home?
Nested Gender and Age
Male
18-24
Male
25-34
Male
35-44
Male
45-54
Male
55-64
Male
65+
Femal
e 18-
24
Femal
e 25-
34
Femal
e 35-
44
Femal
e 45-
54
Femal
e 55-
64
Femal
e 65+
(%) (%) (%) (%) (%) (%) (%) (%) (%) (%) (%) (%)
[Not at all +
Slightly familiar]
46 ⇓ 35 ⇓ 37 48 56 ⇑ 67 ⇓ 34 ⇓ 37 49 58 58 ⇑ 69
Not at all
familiar
21 24 ⇓ 16 24 26 ⇑ 39 17 16 19 24 ⇑ 36 ⇑ 36
Slightly familiar 25 ⇓ 11 21 25 30 28 17 20 29 ⇑ 34 22 33
Moderately
familiar
25 21 19 23 26 22 25 25 16 18 27 15
Very familiar 23 ⇑ 24 21 11 11 ⇓ 4 24 22 19 15 11 ⇓ 8
Completely
familiar
7 ⇑ 21 ⇑ 23 18 8 7 17 17 17 9 ⇓ 5 8
[Very +
Completely
familiar]
30 ⇑ 44 ⇑ 44 29 ⇓ 18 ⇓ 11 41 39 36 24 ⇓ 16 ⇓ 15
Base n=61 n=97 n=107 n=97 n=66 n=82 n=59 n=93 n=103 n=93 n=64 n=78
Sample Size: 1,000 (All Respondents)
3. How familiar are you with voice assistants for the home, such as Amazon Echo and
Google Home?
"I am not very familiar with voice assistants for the home. I have just heard the names of Amazon Echo and Google Home."
"I'm aware of them, my TV is alexa enabled but I have no real use for it as I don't have any other kind of home automation."
"Quite familiar as I have used Google Home on numerous occasions at someone else's place of residence to play Luke Bryan."
"I haven't used it myself but some of my friends had one. They ask them to play a certain music and it would...it was nice."
"We have a Google home. I mostly just listen to music on YouTube. I do use it for a alarm clock and also the weather forecast."
"I know they exist but I don't need something like it. I don't fully see the benefit outweighing the cost."
4. Using the following scale, how important is it for you to be able to speak to your electronics
devices?
Sample Size: 1,000 (All Respondents)
5. Using the following scale, how important is it for you to be able to speak to your electronics
devices?
Which of the following groups describes your current age?
18-24 25-34 35-44 45-54 55-64 65+
(%) (%) (%) (%) (%) (%)
[Not at all + Slightly
important]
59 ⇓ 48 62 65 ⇑ 82 ⇑ 89
Not at all important ⇓ 32 ⇓ 36 46 52 ⇑ 66 ⇑ 72
Slightly important ⇑ 28 13 16 13 15 17
Moderately important ⇑ 27 ⇑ 21 12 16 14 ⇓ 4
Very important 11 ⇑ 14 12 10 ⇓ 2 ⇓ 5
Completely important ⇓ 3 ⇑ 16 ⇑ 14 9 ⇓ 3 ⇓ 2
[Very + Completely important] 14 ⇑ 31 ⇑ 26 19 ⇓ 5 ⇓ 8
Base n=120 n=190 n=210 n=190 n=130 n=160
Sample Size: 1,000 (All Respondents)
6. Using the following scale, how important is it for you to be able to speak to your electronics
devices?
Nested Gender and Age
Male
18-24
Male
25-34
Male
35-44
Male
45-54
Male
55-64
Male
65+
Femal
e 18-
24
Femal
e 25-
34
Femal
e 35-
44
Femal
e 45-
54
Femal
e 55-
64
Femal
e 65+
(%) (%) (%) (%) (%) (%) (%) (%) (%) (%) (%) (%)
[Not at all +
Slightly
important]
61 ⇓ 47 ⇓ 50 62 77 ⇑ 90 58 ⇓ 49 75 68 ⇑ 86 ⇑ 87
Not at all
important
⇓ 31 ⇓ 34 ⇓ 37 46 56 ⇑ 80 ⇓ 32 ⇓ 38 54 58 ⇑ 77 ⇑ 63
Slightly
important
⇑ 30 13 12 15 21 10 25 12 20 10 9 ⇑ 24
Moderately
important
⇑ 28 20 14 14 17 ⇓ 2 ⇑ 25 ⇑ 23 10 17 11 ⇓ 5
Very important 7 14 ⇑ 19 12 3 4 15 14 5 8 ⇓ 0 6
Completely
important
5 ⇑ 19 ⇑ 18 11 3 4 ⇓ 2 14 11 8 3 ⇓ 1
[Very +
Completely
important]
11 ⇑ 33 ⇑ 36 24 ⇓ 6 ⇓ 7 17 ⇑ 28 16 15 ⇓ 3 ⇓ 8
Base n=61 n=97 n=107 n=97 n=66 n=82 n=59 n=93 n=103 n=93 n=64 n=78
Sample Size: 1,000 (All Respondents)
7. How important is it for you to be able to speak to your electronics devices?
"If I can do it anyone in my house can do it and charge me for the use, so I would say it is more important for me to no use it."
"It's good for helping with ordering food, helping elderly people who need emergency services, and great for keeping small
children entertained while their parents are preoccupied."
"I do not like speaking to electronic devices unless I have to, for example, using my hands free voice control in the car is good for
stay focused on driving. Having devices in the home that use voice control is not something I want to have."
"It is not important to be able to speak to my electronics devices. I don't need this feature and often this feature does not work
well."
"It would be important to be able to speak with electronic devices, depending on what the appliance is. A coffee pot would be
convenient but not important to be able to speak to, but a home assist product is very important to be able to speak to because if
not, it wouldn't serve a purpose."
"Not important at all. When I speak to them, it's to tell them not to fail, such as when Comcast connections don't do through and
I'm annoyed."
"Not very important I am too old for some of the modern technology however with my memory the way it is sometimes it might
be nice."
8. Using the following scale, how likely are you to purchase a voice assistant for a car?
Sample Size: 1,000 (All Respondents)
9. Using the following scale, how likely are you to purchase a voice assistant for a car?
Which of the following groups describes your current age?
18-24 25-34 35-44 45-54 55-64 65+
(%) (%) (%) (%) (%) (%)
[Not at all + Slightly likely] 67 ⇓ 54 ⇓ 64 71 ⇑ 88 ⇑ 92
Not at all likely ⇓ 44 ⇓ 40 ⇓ 45 57 ⇑ 70 ⇑ 82
Slightly likely ⇑ 22 14 19 14 18 ⇓ 11
Moderately likely ⇑ 18 13 12 15 ⇓ 5 ⇓ 4
Very likely 13 ⇑ 20 11 ⇓ 5 ⇓ 3 ⇓ 3
Completely likely ⇓ 2 ⇑ 13 ⇑ 13 8 4 ⇓ 0
[Very + Completely likely] 15 ⇑ 33 ⇑ 24 14 ⇓ 7 ⇓ 3
Base n=120 n=190 n=210 n=190 n=130 n=160
Sample Size: 1,000 (All Respondents)
10. Using the following scale, how likely are you to purchase a voice assistant for a car?
Nested Gender and Age
Male
18-24
Male
25-34
Male
35-44
Male
45-54
Male
55-64
Male
65+
Femal
e 18-
24
Femal
e 25-
34
Femal
e 35-
44
Femal
e 45-
54
Femal
e 55-
64
Femal
e 65+
(%) (%) (%) (%) (%) (%) (%) (%) (%) (%) (%) (%)
[Not at all +
Slightly likely]
66 ⇓ 51 ⇓ 54 70 ⇑ 89 ⇑ 91 68 ⇓ 57 74 72 ⇑ 88 ⇑ 94
Not at all likely 46 ⇓ 39 ⇓ 40 55 ⇑ 68 ⇑ 83 ⇓ 42 ⇓ 41 50 60 ⇑ 72 ⇑ 81
Slightly likely 20 11 14 15 21 9 ⇑ 25 16 ⇑ 23 12 16 13
Moderately
likely
⇑ 21 13 11 16 ⇓ 3 5 15 13 13 14 6 ⇓ 4
Very likely 11 ⇑ 23 ⇑ 15 4 5 4 15 ⇑ 17 7 6 ⇓ 2 ⇓ 3
Completely
likely
2 ⇑ 13 ⇑ 20 9 3 ⇓ 0 2 ⇑ 13 7 8 5 ⇓ 0
[Very +
Completely
likely]
13 ⇑ 36 ⇑ 35 13 ⇓ 8 ⇓ 4 17 ⇑ 30 14 14 ⇓ 6 ⇓ 3
Base n=61 n=97 n=107 n=97 n=66 n=82 n=59 n=93 n=103 n=93 n=64 n=78
Sample Size: 1,000 (All Respondents)
11. How likely are you to purchase a voice assistant for a car?
"I don't think that I would purchase a voice assist for my car that I have right now because it already has a built in one. But if I
didn't have one, I would probably look into purchasing one."
"I would be somewhat likely to purchase a vehicular based voice assistant, I can see it being useful if in a stressful driving situation
where you can't take your hands off the wheel but need to turn you music down, or reroute your gps."
"I wouldn't have to purchase a voice assistant simply to put, It would already be included with the vehicle infotainment
package/Navigation system."
"Probably not - if the car comes with it, then I would probably use it. But I don't see myself retro fitting one into a car. My
experience with Bluetooth in cars has been very poor."
"Yeah, right. I have a 1993 Ford Explorer. It has a tape player. Doesn't work, but it has one. How is that going to work with a voice
assistant? Not a chance, nor do I want one. My voice assistant is my sister who is my navigator and uses a piece of paper with
handwritten directions on how to get where we're going if we haven't been there before. She also writes down reminders."
"Never; it would be a distraction that would significantly increase my likelihood of dying in a gruesome car accident."
12. Methodology
This online survey had 1,000 respondents. It was fielded from June 18 to 19, 2019.
The results presented in this report were weighted to be representative of the overall
population by the following variables:
• What is your gender?
• Which of the following groups describes your current age?
• Are you of Hispanic, Spanish or Latino descent?
• Which of the following best describes your ethnicity?
• What is the highest degree or level of school you have completed?
• Region
13. Crosstab Methodology
Crosstab Table Notes:
• Rather than compare subgroups to other subgroups individually, we compare each
subgroup to the aggregate of all other subgroups.
• This is easier to present and visualize than column comparisons and
differentiates at the low end as well as the high end.
• Since this approach uses the entire sample, rather than a subsample
consisting of two subgroups, it provides greater statistical power and reduces
the chance that differences are false discoveries.
• A statistically significant difference is one that cannot be attributed to chance at a
95% confidence level: 19 times out of 20 the differences would exist in the target
population.
• If the difference is higher at a statistically significant level, the cell is marked
with the up-arrow symbol ⇑. If it is lower, the down-arrow symbol ⇓ is used.
• Columns with fewer than 30 responses (i.e. degrees of freedom) are ignored
for statistical significance comparisons.
• Crosstabs show only unweighted results.
• To fit onto a single slide, some crosstabs have had columns without differences
omitted. See the spreadsheet for the full crosstabs.
14. Researchscape International
Researchscape International is a market-research consultancy
specializing in custom surveys. For questions about this or other
research, please contact us at +1-888-983-1675 x1 or visit our
website, http://www.researchscape.com/.
![Using the following scale, how familiar are you with voice assistants for the home, such as Amazon Echo
and Google Home?
Nested Gender and Age
Male
18-24
Male
25-34
Male
35-44
Male
45-54
Male
55-64
Male
65+
Femal
e 18-
24
Femal
e 25-
34
Femal
e 35-
44
Femal
e 45-
54
Femal
e 55-
64
Femal
e 65+
(%) (%) (%) (%) (%) (%) (%) (%) (%) (%) (%) (%)
[Not at all +
Slightly familiar]
46 ⇓ 35 ⇓ 37 48 56 ⇑ 67 ⇓ 34 ⇓ 37 49 58 58 ⇑ 69
Not at all
familiar
21 24 ⇓ 16 24 26 ⇑ 39 17 16 19 24 ⇑ 36 ⇑ 36
Slightly familiar 25 ⇓ 11 21 25 30 28 17 20 29 ⇑ 34 22 33
Moderately
familiar
25 21 19 23 26 22 25 25 16 18 27 15
Very familiar 23 ⇑ 24 21 11 11 ⇓ 4 24 22 19 15 11 ⇓ 8
Completely
familiar
7 ⇑ 21 ⇑ 23 18 8 7 17 17 17 9 ⇓ 5 8
[Very +
Completely
familiar]
30 ⇑ 44 ⇑ 44 29 ⇓ 18 ⇓ 11 41 39 36 24 ⇓ 16 ⇓ 15
Base n=61 n=97 n=107 n=97 n=66 n=82 n=59 n=93 n=103 n=93 n=64 n=78
Sample Size: 1,000 (All Respondents)](data:image/gif;base64,R0lGODlhAQABAIAAAAAAAP///yH5BAEAAAAALAAAAAABAAEAAAIBRAA7)