Vendor Performance Management survey results nov 7th
•
1 j'aime•483 vues

Summary of the survey results from the CPPC conference Nov 2012 brought to you by QCsolver.ca

Recommandé
Contenu connexe
Tendances
Tendances (20)
Similaire à Vendor Performance Management survey results nov 7th
Similaire à Vendor Performance Management survey results nov 7th (20)
Dernier
Dernier (20)
Vendor Performance Management survey results nov 7th
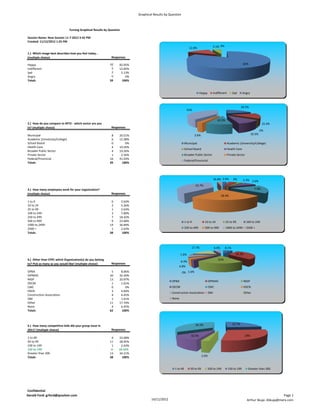
- 1. Graphical Results by Question Turning Graphical Results by Question Session Name: New Session 11-7-2012 3-42 PM Created: 11/12/2012 1:25 PM 12.8% 5.1% 0% 1.) Which image best describes how you feel today… (multiple choice) Responses Happy 32 82.05% 82% Indifferent 5 12.82% Sad 2 5.13% Angry 0 0% Totals 39 100% Happy Indifferent Sad Angry 20.5% 41% 10.3% 2.) How do you compare to MTO - which sector are you 15.4% in? (multiple choice) Responses 0% Municipal 8 20.51% 2.6% 10.3% Academic (University/College) 6 15.38% School Board 0 0% Municipal Academic (University/College) Health Care 4 10.26% School Board Health Care Broader Public Sector 4 10.26% Private Sector 1 2.56% Broader Public Sector Private Sector Federal/Provincial 16 41.03% Federal/Provincial Totals 39 100% 36.8% 2.6% 0% 5.3% 2.6% 23.7% 3.) How many employees work for your organization? 7.9% (multiple choice) Responses 18.4% 1 to 9 0 2.63% 10 to 24 2 5.26% 25 to 99 1 2.63% 100 to 249 3 7.89% 250 to 499 7 18.42% 500 to 999 9 23.68% 1 to 9 10 to 24 25 to 99 100 to 249 1000 to 2499 14 36.84% 2500 + 1 2.63% 250 to 499 500 to 999 1000 to 2499 2500 + Totals 38 100% 17.7% 6.4% 8.1% 1.6% 32.3% 4.) Other than CPPC which Organization(s) do you belong 21% 6.4% to? Pick as many as you would like! (multiple choice) Responses 4.8% OPBA 5 8.06% 0% 1.6% OIPMAC 20 32.26% NIGP 13 20.97% OPBA OIPMAC NIGP OECM 1 1.61% CMC 0 0% OECM CMC HSCN HSCN 3 4.84% Construction Association ISM Other Construction Association 4 6.45% ISM 1 1.61% None Other 11 17.74% None 4 6.45% Totals 62 100% 34.2% 23.7% 5.) How many competitive bids did your group issue in 2011? (multiple choice) Responses 10.5% 29% 1 to 49 9 23.68% 50 to 99 11 28.95% 100 to 149 1 2.63% 150 to 199 4 10.53% Greater than 200 13 34.21% Totals 38 100% 2.6% 1 to 49 50 to 99 100 to 149 150 to 199 Greater than 200 Confidential Gerald Ford: grford@qcsolver.com Page 1 14/11/2012 Arthur Skuja: ASkuja@merx.com
- 2. Graphical Results by Question 27% 24.3% 0% 6.) On average how many vendor performance evaluations do you do per year? (multiple choice) Responses 37.8% None 9 24.32% 1 to 10 14 37.84% 10.8% 11 to 25 4 10.81% 26 to 49 0 0% 50+ 10 27.03% Totals 37 100% None 1 to 10 11 to 25 26 to 49 50+ 8.2% 17.3% 17.3% 7.) Which tools or methods do you use? Pick as many as 16.3% you would like! (multiple choice) Responses 17.3% 8.2% 15.3% Checklists 17 17.35% Forms 16 16.33% Templates 15 15.31% User Guides & Manuals 8 8.16% Progress meetings 17 17.35% Checklists Forms Performance documentation 17 17.35% 3rd Party verification 8 8.16% Templates User Guides & Manuals Totals 98 100% Progress meetings Performance documentation 3rd Party verification 9.2% 8.2% 10.2% 1% 9.2% 8.) What triggers an evaluation? (multiple choice) Responses Periodic 10 10.20% Budget Threshold 9 9.18% 19.4% 19.4% Contract performance 19 19.39% Project profile 6 6.12% New vendor 11.2% 6.1% 6.1% 6 6.12% Project complexity 11 11.22% Periodic Budget Threshold Contract performance Client Dissatisfaction 19 19.39% Repeat vendors 1 1.02% Project profile New vendor Project complexity Length of Engagement 9 9.18% Client Dissatisfaction Repeat vendors Length of Engagement Every Project 8 8.16% Totals 98 100% Every Project 9.) On a scale from 1 to 5, what is the average score you 3.1% 6.2% 9.4% give to your contractors when you do evaluations? (multiple choice) Responses 40.6% Poor 2 6.25% 40.6% Acceptable 3 9.38% Standard 13 40.62% Good 13 40.62% Excellent 1 3.12% Totals 32 100% Poor Acceptable Standard Good Excellent 10.) What is important for an effective engagement? 18.1% 5.7% 23% Responses 5.6% (priority ranking) 12.2% 5.1% Effective communication throughout engagement 200 22.96% 10.6% 19.8% Quality of resources 49 5.63% Availability of resources to carry out contra... 44 5.05% Effective communication throughout engagement Quality of the final deliverables 172 19.75% Providing value added services 92 10.56% Quality of resources Maintaining timelines/deadlines 106 12.17% Availability of resources to carry out contra... Budget/cost control 158 18.14% Having a vendor contact for dispute resolutio... 50 5.74% Quality of the final deliverables Totals 871 100% Providing value added services Maintaining timelines/deadlines Confidential Gerald Ford: grford@qcsolver.com Page 2 14/11/2012 Arthur Skuja: ASkuja@merx.com
- 3. Graphical Results by Question 11.) What are your greatest challenges to having an 12.8% 31.9% effective VPM! (multiple choice) Responses 21.3% Not enough time 15 31.91% End user input difficult to get 12 25.53% 0% Poor systems 4 8.51% 8.5% Not required 0 0% 25.5% Missing linkage between contract and performa... 10 21.28% Not enough time Comparative Consistency 6 12.77% Totals 47 100% End user input difficult to get Poor systems Not required Missing linkage between contract and performa... Comparative Consistency 12.) Is the use of bonding a viable alternative to vendor performance management? (multiple choice) Responses Yes 9 25% No 11 30.56% 25% 44.4% Depends 16 44.44% Totals 36 100% 30.6% Yes No Depends 13.) Do you share performance results with vendors? (multiple choice) Responses Yes 25 80.65% No 6 19.35% Totals 31 100% 19.4% 80.6% Yes No 14.) Do you tie VPM data to proposal evaluations and vendor selection? (multiple choice) Responses Proposals 2 6.90% 6.9% Evaluations 7 24.14% 41.4% 24.1% Both 8 27.59% Neither 12 41.38% Totals 29 100% 27.6% Proposals Evaluations Both Neither Confidential Gerald Ford: grford@qcsolver.com Page 3 14/11/2012 Arthur Skuja: ASkuja@merx.com
- 4. Graphical Results by Question 15.) Do you tie vendor qualification to specific procurements or a general work or product category? (multiple choice) Responses 10% Specific 21 70% 20% General 6 20% Product Category 3 10% 70% Totals 30 100% Specific General Product Category 16.) And how do you feel now? (multiple choice) Responses Happy 18 51.43% Indifferent 6 17.14% 14.3% Sad 6 17.14% 17.1% 51.4% Angry 5 14.29% Totals 35 100% 17.1% Happy Indifferent Sad Angry Confidential Gerald Ford: grford@qcsolver.com Page 4 14/11/2012 Arthur Skuja: ASkuja@merx.com