Recommandé

Recommandé
Contenu connexe
Tendances
Tendances (20)
En vedette
En vedette (20)
Similaire à Jodutt JRI Poster (viewable)
Similaire à Jodutt JRI Poster (viewable) (20)
Jodutt JRI Poster (viewable)
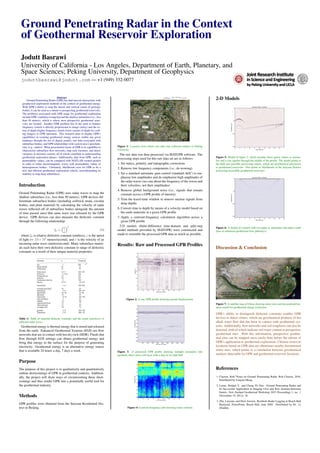
- 1. Ground Penetrating Radar in the Context of Geothermal Reservoir Exploration Jodutt Basrawi University of California - Los Angeles, Department of Earth, Planetary, and Space Sciences; Peking University, Department of Geophysics joduttbasrawi@jodutt.com — +1 (949) 332-0077 Abstract Ground Penetrating Radar (GPR) has had nascent interactions with geophysical exploration methods in the context of geothermal energy. With GPR’s ability to map the lateral and vertical extent of geologic bodies, it can be used as a means to prospecting geothermal reservoirs. The problems associated with GPR usage for geothermal exploration include GPR’s inability to map beyond the shallow subsurface (i.e., less than 50 meters), which is where most prospective geothermal reser- voirs are located. Another GPR problem lies in the need to balance frequency (which is directly proportional to image clarity) and the ex- tent of depth (higher frequency entails lower extents of depth for craft- ing images) in GPR operation. This research aims to display GPR’s capabilities in scouting geothermal energy sources within any given landmass through the use of digital models, raw data associated with subsurface bodies, and GPR relationships with a given area’s geochem- istry (e.g., sinters). What geoscientists know of GPR is its capability to characterize subsurface flow networks, map rock fractures, and detect variances in moisture content, all of which contribute to understanding geothermal exploration phases. Additionally, data from GPR, such as permeability values, can be compared with MATLAB created models in order to relate electromagnetic waves with permeability values of heterogeneous bodies. Ultimately, likelihoods exist for GPR to be a new and efficient geothermal exploration vehicle, notwithstanding its inability to map deep subsurfaces. Introduction Ground Penetrating Radar (GPR) uses radar waves to map the shallow subsurface (i.e., less than 50 meters). GPR devices dif- ferentiate subsurface bodies (including soil/rock strata, circular bodies, and plant material) by calculating the velocity of radar waves reflected off of subsurface bodies alongside the amount of time passed since that same wave was released by the GPR device. GPR devices can also measure the dielectric constant through the following relationship: ξr = c v 2 (1) where ξr is relative dielectric constant (unitless), c is the speed of light (≈ 3.0 ∗ 107 meters/second), and v is the velocity of an incoming radar wave (meters/second). Many subsurface materi- als each have their own dielectric constant or range of dielectric constants as a result of their unique material properties. Table 1: Table of material dielectic constants and the usual velocity(s) of reflected radar waves Geothermal energy is thermal energy that is stored and released from the earth. Enhanced Geothermal Systems (EGS) are flow networks that are in contact with hot dry rock (HDR). Fluids that flow through EGS settings can obtain geothermal energy and bring that energy to the surface for the purpose of generating electricity. Geothermal energy is an alternative energy source that is available 24 hours a day, 7 days a week. Purpose The purpose of this project is to qualitatively and quantitatively outline shortcomings of GPR in geothermal contexts. Addition- ally, the project will show ways of circumventing these short- comings and thus render GPR into a potentially useful tool for the geothermal industry. Methods GPR profiles were obtained from the Suiyuan Residential Dis- trict in Beijing. Figure 1: Location from which raw data was collected relative to Peking University The raw data was then processed via MATGPR software. The processing steps used for this raw data set are as follows: 1. Set statics, polarity, and topographic corrections 2. Remove low frequency components (i.e., de-wowing) 3. Set a standard automatic gain control (standard AGC) to em- phasize low amplitudes and de-emphasize high amplitudes of the radar waves (we care about the frequency of the waves and their velocities, not their amplitudes) 4. Remove global background noise (i.e., signals that remain constant across a GPR profile of interest) 5. Trim the travel-time window to remove unclear signals from deep depths 6. Convert time to depth by means of a velocity model based on the earth materials in a given GPR profile 7. Apply a centroid-frequency calculation algorithm across a given GPR profile 2-D models (finite-difference time-domain and split-step model methods provided by MATGPR) were constructed and made to resemble the processed GPR data as much as possible. Results: Raw and Processed GPR Profiles Figure 2: A raw GPR profile showing normal displacement. Figure 3: A processed GPR profile showing multiple anomalies (the parabolic lines) and a soil layer with a step on its right half. Figure 4: Centroid frequency plot showing water contents 2-D Models Figure 5: Model of figure 2, which includes three quartz sinters as anoma- lies and a clay aquifer through the middle of the profile. The model points to the field area possibly possessing sinters, which are geochemical precursors to geothermal reservoirs. This points to likelihoods of the Suiyuan District possessing accessible geothermal reservoirs. Figure 6: A model of a trench with two pipes as anomalies (the pipes could pose as enhanced geothermal flow pathways). Discussion & Conclusion Figure 7: A satellite map of China showing sinter sites and documented hot- spots useful for geothermal energy extraction. GPR’s ability to distinguish dielectric constants enables GPR devices to detect sinters, which are geochemical products of hot alkali water flow that has been in contact with geothermal sys- tems. Additionally, flow networks and soil roughness can also be detected, both of which indicate soil water content in prospective geothermal sites. With this information, prospective geother- mal sites can be mapped more easily than before the advent of GPR’s application to geothermal exploration. Chinese reservoir locations based on GPR data are oftentimes nearby documented sinter sites, which points to a correlation between geochemical markers detectable by GPR and geothermal reservoir locations. References 1. Clayton, Rob.“Notes on Ground Penetrating Radar. Rob Clayton, 2016. Distributed by Lingsen Meng. 2. Lynne, Bridget Y., and Cheng Yii Sim. Ground Penetrating Radar and Its Successful Application in Imaging USA and New Zealand Siliceous Sinters. New Zealand Geothermal Workshop 2012 Proceedings 1, no. 1 (November 19, 2012): 18. 3. Zhu, Lieyuan, and Peter Joeston. Borehole-Radar Logging at Beach Hall Backyard. PowerPoint, Beach Hall, June 2005. Distributed by Dr. Li Zhanhui.