1. October 2003
John Banos report: issue no 30
Bull market in Australian equities likely to continue,
in my opinion
Summary
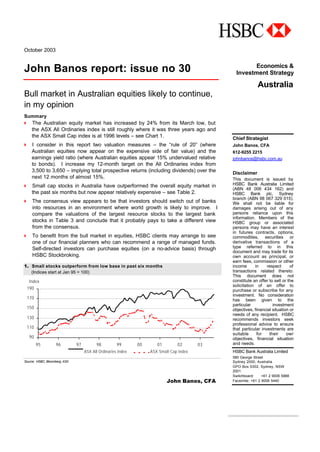
4 The Australian equity market has increased by 24% from its March low, but
the ASX All Ordinaries index is still roughly where it was three years ago and
the ASX Small Cap index is at 1996 levels – see Chart 1.
4 I consider in this report two valuation measures – the “rule of 20” (where
Australian equities now appear on the expensive side of fair value) and the
earnings yield ratio (where Australian equities appear 15% undervalued relative
to bonds). I increase my 12-month target on the All Ordinaries index from
3,500 to 3,650 – implying total prospective returns (including dividends) over the
next 12 months of almost 15%.
4 Small cap stocks in Australia have outperformed the overall equity market in
the past six months but now appear relatively expensive – see Table 2.
4 The consensus view appears to be that investors should switch out of banks
into resources in an environment where world growth is likely to improve. I
compare the valuations of the largest resource stocks to the largest bank
stocks in Table 3 and conclude that it probably pays to take a different view
from the consensus.
4 To benefit from the bull market in equities, HSBC clients may arrange to see
one of our financial planners who can recommend a range of managed funds.
Self-directed investors can purchase equities (on a no-advice basis) through
HSBC Stockbroking.
1. Small stocks outperform from low base in past six months
(Indices start at Jan 95 = 100)
90
110
130
150
170
190
95 96 97 98 99 00 01 02 03
Index
ASX All Ordinaries Index ASX Small Cap Index
Source: HSBC, Bloomberg, ASX
John Banos, CFA
Economics &
Investment Strategy
Australia
Chief Strategist
John Banos, CFA
612-9255 2215
johnbanos@hsbc.com.au
Disclaimer
This document is issued by
HSBC Bank Australia Limited
(ABN 48 006 434 162) and
HSBC Bank plc, Sydney
branch (ABN 98 067 329 015).
We shall not be liable for
damages arising out of any
persons reliance upon this
information. Members of the
HSBC group or associated
persons may have an interest
in futures contracts, options,
commodities, securities or
derivative transactions of a
type referred to in this
document and may trade for its
own account as principal, or
earn fees, commission or other
income in respect of
transactions related thereto.
This document does not
constitute an offer to sell or the
solicitation of an offer to
purchase or subscribe for any
investment. No consideration
has been given to the
particular investment
objectives, financial situation or
needs of any recipient. HSBC
recommends investors seek
professional advice to ensure
that particular investments are
suitable for their own
objectives, financial situation
and needs.
HSBC Bank Australia Limited
580 George Street
Sydney 2000, Australia
GPO Box 5302, Sydney, NSW
2001
Switchboard: +61 2 9006 5888
Facsimile: +61 2 9006 5440
2. October 2003 John Banos report: issue no 30
HSBC Economics & Investment Strategy 2
Strong fundamentals for the Australian equity market
I believe that the Australian equity market is benefiting from strong fundamentals –
particularly improving earnings and attractive valuations. On the earnings front, there is
widespread agreement from equity market commentators that we have in the past few
months witnessed one of the strongest profit reporting periods in many years. There is,
however, some disagreement on the quantum of the profit increase. Some who
optimistically talk of double-digit earnings growth in FY03 are usually referring to net
profits growth, without taking into account dilution from the increased number of shares on
issue. I prefer to focus on growth in adjusted earnings per share and on this basis EPS
(as calculated by Aegis Equities) increased by 6% in FY03. I sometimes refer to
Government tax records to get a second opinion on company profits, knowing well that
most companies try to be as conservative as possible when reporting their profits to the
tax office. Government records indicate that income tax on companies increased by a
phenomenal 23% from $27.1B in FY02 to $33.4B in FY03. While the Australian Stock
Exchange and the Government use a different sample of companies – the Government
sample is much larger and also includes non-listed companies – I do not need any
further convincing that earnings of listed companies are clearly on the way up.
Looking forward, Aegis analysts are forecasting at least 11% EPS growth for each of
FY04F and FY05F. I believe the risks to these earnings forecasts are probably to the
downside given that a strong A$ should have a dampening impact on export revenues and
may also lead to lower overseas earnings in A$ terms. Furthermore, borrowing costs may
also rise from early next year. However, I believe that EPS growth in line with nominal
GDP (+5 to +6% per annum) should be attainable over the next two years.
I have used the following yardsticks in the past decade to ascertain whether share prices
provide value in a particular inflation or interest rate environment:
• “Rule of 20” – the prospective PER on the overall equity market plus the
prospective inflation rate need to add to less than 20 for the equity market to be
good value. The logic of this yardstick is that high inflation increases the risks for
equities because monetary policy is often tightened aggressively during such
periods. Furthermore, high inflation reduces the quality of earnings (for example,
historic cost depreciation may understate the true level of depreciation when prices
are rising rapidly) and real return on equity is often much lower. Therefore, equities
should be penalised and should trade at much lower price-to-earnings ratios (PERs)
during high inflation periods. At present, the prospective PER on the All Ordinaries
index (using Aegis forecast earnings to October 2004) is 14.3x and using a
prospective inflation rate of 2.6% (forecast from HSBC Economics) gives an index of
16.9. This is well below the danger level of 20, but is in the top half of the “fair value”
norm between 12 and 18 that has been appropriate for the past 40 years.
• Prospective earnings yield ratio – the prospective earnings yield on the overall
equity market needs to exceed the prospective 10-year bond rate for the equity
market to be good value. The earnings yield of a stock can be defined as earnings
per share (EPS) over share price and is a good proxy for profits accruing to
3. October 2003 John Banos report: issue no 30
HSBC Economics & Investment Strategy 3
shareholders. Similarly, the 10-year bond yield is a good proxy for the expected return
on risk-free government bonds. Now one may argue that surely the earnings yield on
shares should significantly exceed the bond yield to compensate share investors for
higher risk. Keep in mind, however, that the earnings yield on shares is an after-tax
return while the bond yield is a pre-tax return. At present, the prospective earnings
yield ratio is 0.85x – using a 12-months forward bond rate of 5.95% and a 12-months
forward earnings yield of 7.0% (inverse of PER of 14.3x). The Australian equity market
therefore appears 15% undervalued relative to bonds using this measure.
Beware of valuations among ex-100 stocks
Ex-100 stocks have strongly outperformed the All Ordinaries index in the past six months,
but it is now much harder to find value in this area. Smaller stocks have historically traded
on more attractive valuations (PERs and dividend yields) than the overall equity market to
compensate investors for the higher risk. However, the prospective PER for smaller
companies is now higher than that for the overall market – 15.7x versus 14.4x (see Table
2). Admittedly, the average PER for the smaller companies sector appears to be distorted
by large losses from ‘fallen angels” (small companies that were once in the top-100) and
large exposure to small gold miners and exploration companies that often trade on high
PERs. It is also evident from Table 2 that ex-100 companies in aggregate are significantly
less profitable – with an average return on equity (ROE) of under 9% forecast by Aegis
Equities for FY04F versus an ROE of 12.8% for the overall market. Despite the lower ROE,
ex-100 companies are trading at similar price to net tangible assets (NTA) ratios as the
overall equity market. In conclusion, the ex-100 sector as a whole no longer appears
undervalued. One way to continue to make money in small caps is through managed
funds – your HSBC financial planners will be able to guide you in this regard. For those
who try to pick small stock themselves, it is often true that those companies with the best
news (e.g. imminent new discoveries in the biotech sector) usually also have the most
expensive valuations.
2. Valuation parameters for Australian equities*
FY03 FY04F FY03 FY04F
(x) (x) (%) (%)
All companies 17.2 14.8 6.2 11.3
Banks 12.9 11.9 8.6 6.5
Ex-100 companies 20.9 15.7 -0.7 22.3
Price/NTA ROE
FY03 FY04F FY03 FY04F
(%) (%) (x) (%)
All companies 3.8 4.0 2.6 12.8
Banks 5.0 5.5 2.3 16.4
Ex-100 companies 4.4 4.7 2.4 8.6
PER
Dividend yield
EPS growth
* Equity market valuations based on share prices as at 13 October 2003. Source: Aegis Equities
4. October 2003 John Banos report: issue no 30
HSBC Economics & Investment Strategy 4
Is the consensus view correct that resources are likely to outperform
banks?
The consensus view appears to be that stronger world growth over the next six months
may contribute to higher bond rates in Australia (and overseas) – implying that Australian
investors should be shifting out of banks (or other high-yield stocks) into resources (or
other cyclicals).
Let me analyse each component of the above statement in more detail. First of all, I find it
interesting to know about the consensus view on markets, because I believe that to profit
significantly you need to take a view different from consensus. It certainly does not make
sense for retail investors or – even professional money managers – to try and second-
guess where consensus is headed. My philosophy is to buy excellent businesses with
excellent management teams at attractive prices and you usually only get this opportunity
to buy quality businesses cheaply when the consensus for some reason has a different
view.
On the issue of world growth picking up next year, I am finding it very difficult to predict this
with any degree of certainty. It may happen and it may not. It certainly does appear that
many of the leading economic indicators particularly in the US and Japan have picked up
in the past two quarters. Furthermore, global policy settings (both monetary and fiscal)
appear strongly stimulatory. However, I believe that the US economy is in a post-bubble
environment and it is possible in such an environment to see strong share market rallies
only to be followed by further declines. For example, the Japanese equity market has
been in a 13-year “post-bubble” bear market, but there have been three significant rallies
of +55% (92 low to Jan 94), +44% (1995 low to 1996 high) and +79% (1998 to 2000) in
between. Even in the bleakest of post-bubble environments there are false dawns and
the current rally is certainly not enough to undermine the post bubble hypothesis.
Even if the world economy continues to improve, one may argue that this is largely
discounted in current prices for resource stocks. I believe that the best way to value
resource stocks (or other finite life businesses) is through a discounted cashflow analysis
that provides an NPV (or net present value) for each stock. However, of the five major
resource stocks only Woodside Petroleum is trading a little below its NPV – as calculated
by Aegis Equities. The other major miners are trading on premiums varying from 17% (for
BHP Billiton) to 58% (for Alumina Limited) – see Table 3. In contrast, the five big banks in
aggregate are trading 6% below their NPVs. Furthermore, the five big resource stocks are
52% more expensive than the big five banks on the basis of FY04 PERs (19.1x versus
12.6x) and provide only half the dividend yields (2.7% versus 5.5%).
5. October 2003 John Banos report: issue no 30
HSBC Economics & Investment Strategy 5
3. Comparing valuations – resources versus banks
Price/ PER* Dividend yield*
Share price Aegis NPV FY04F FY04F
(cents) (x) (x) (%)
Major resources
Alumina 583 1.58 22.7 3.9
BHP Billiton 1142 1.17 18.5 2.1
Rio Tinto 3514 1.23 18.2 2.8
WMC Resources 503 1.35 17.5 2.0
Woodside Petroleum 1375 0.99 19.4 3.0
Average (equal weights) 1.26 19.1 2.7
Major banks
ANZ Bank 1822 0.89 11.4 5.8
Commonwealth Bank 2833 1.01 14.0 6.0
National Australia Bank 3099 0.92 10.6 5.7
St George Bank 2140 0.91 15.5 4.8
Westpac Bank 1653 0.97 13.0 5.2
Average (equal weights) 0.94 12.6 5.5
Overall equity market 14.8 4.0
* Earnings and dividend forecasts are consensus numbers from I/B/E/S.
Source: HSBC, Aegis Equities
I continue to have a large weighting in banks in the recommended equity portfolios and
include only one miner (BHP Billiton) in the growth and balanced portfolios – see Table 4.
4. Recommended equity portfolios for retail investors
Growth Balanced High-income
ANZ Bank ($18.22) ANZ Bank ($18.22) AGL ($10.67)
BHP Billiton ($11.42) BHP Billiton ($11.42) ANZ Bank ($18.22)
QBE Insurance ($10.07) Centro Properties ($3.94) Centro Properties ($3.94)
Macquarie Bank ($35.60) QBE Insurance ($10.07) St George Bank ($21.40)
Resmed ($6.75) St George Bank ($21.40) Stockland Trust ($4.90)
St George Bank ($21.40) Tabcorp ($11.88) Tabcorp ($11.88)
Westfield Holdings ($14.07) Westpac Bank ($16.53) Westfield America ($1.89)
Woolworths ($11.09) Westfield Holdings ($14.07) Westpac Bank ($16.53)
Source: HSBC
John Banos, CFA
John Banos is an authorised representative of HSBC Bank Australia Limited, a licensed dealer in
securities. He owns shares in the following companies that have been discussed in this report –
ANZ Bank, QBE Insurance.
6. October 2003 John Banos report: issue no 30
HSBC Economics & Investment Strategy 6
Neither HSBC nor any member of the HSBC Group guarantees the capital value or the performance
of the securities.
PRIVACY INFORMATION
HSBC Bank Australia Limited and members of the HSBC Group would like to contact you from time
to time with various product offers, special promotions and information. This may happen via mail,
email or telephone. If you do not wish to receive this information you may tell us by telephoning us
on 1300 308 008, or writing to us at HSBC Bank Australia Limited, Marketing Department, GPO Box
5302 Sydney 2001.
If you would like to see a copy of HSBC’s Privacy Policy one can be obtained by calling 1300 308
008 or by writing to HSBC at HSBC Bank Australia Limited, Marketing Department, GPO Box 5302
Sydney 2001, or from your local HSBC branch. Alternatively, you can view the HSBC’s Privacy
Policy on our website at www.hsbc.com.au.