Changing patch dynamics of Cape eelgrass Zostera capensis: impacts of loss on epifaunal communities in Langebaan Lagoon, South Africa
•Télécharger en tant que DOCX, PDF•
1 j'aime•369 vues

The cape eelgrass Zostera capensis is an ecosystem engineer endemic to South Africa. Given its rapid decline in recent years, this study aimed to address the following: (1) Do total area and patch dynamics change over time? (2) Do these trends impact patch quality? (3) How does this affect epifaunal communities? Using satellite imagery, we discovered fragmentation and a net loss of 47% in seagrass beds from 2009 to 2015.

Recommandé
Recommandé
Contenu connexe
Tendances
Tendances (20)
Similaire à Changing patch dynamics of Cape eelgrass Zostera capensis: impacts of loss on epifaunal communities in Langebaan Lagoon, South Africa
Similaire à Changing patch dynamics of Cape eelgrass Zostera capensis: impacts of loss on epifaunal communities in Langebaan Lagoon, South Africa (20)
Dernier
Dernier (20)
Changing patch dynamics of Cape eelgrass Zostera capensis: impacts of loss on epifaunal communities in Langebaan Lagoon, South Africa
- 1. Changing patch dynamics of Cape eelgrass Zostera capensis: impacts of loss on epifaunal communities in Langebaan Lagoon, South Africa Category: Capstone Project Participants: Damaris Chenoweth, Joseph W. Galaske, Qawekazi Mkabile and Ceinwen Smith (resource person) Site: Klein Oesterwal, Langebaan Lagoon, Western Cape Province, South Africa Key Words: edge effect, epifauna, fragmentation, patch quality, seagrass Abstract The cape eelgrass Zostera capensis is an ecosystem engineer endemic to South Africa. It has seen a rapid decline in recent years, largely due to the increasing effects of climate change and anthropogenic land uses. Given these losses, the present study aimed to address the following: (1) Do total area and patch dynamics change over time? (2) Do these trends impact patch quality? (3) How does this affect epifaunal communities? Using satellite imagery, we calculated changes in total seagrass cover, number of patches and the mean distances between patches from 2009 to 2015. We investigate consequences to patch quality and epifauna by sampling seagrass bed sizes, mean leaf length, seagrass percent cover and epifuanal presence and abundance with respect to stratum (center vs. edge), and across intertidal zones at Klein Oesterwal beach on Langebaan Lagoon. We discovered fragmentation and a net loss of 47% in seagrass beds. Leaf length and percent cover were both significantly lower on the edges of a patch rather than in the center of a patch. The mean leaf length decreased from 2014 to 2016, and differed across the intertidal zone (high, mid, low). Lastly, leaf length was a predictor of species richness in a patch. The difference between edge and center in patch quality influenced the distribution, abundance and the species diversity of epifauna present in the patches. In conclusion, seagrasses are declining and fragmenting, negatively impacting patch quality and epifaunal communities. Long-term datasets on patch dynamics will contribute to efficient conservation efforts for the rehabilitation of Z. capensis. Introduction Vital marine ecosystems such as coral reefs, seagrass beds, mangrove swamps, continental shelves and seamounts are in decline (Airoldi et al.2008). Previous studies have largely attributed climate change (which is associated with changes in sea level, salinity, temperature, atmospheric carbon dioxide and UV radiation) and anthropogenic activities (unsustainable fishing, fertilizer runoff, pollution from oil gas extraction, untreated sewage, industrial wastes and shipping) as the main drivers of marine ecosystem damages (Hinrichsen et al. 2011, Short and Nickles 1998). The implication of these disturbances is that they alter the local and regional biota, near shore geomorphology, biogeochemical cycles, community distributions, productivity and compositions (Short and Nickles 1998).
- 2. Seagrasses are found in unvegetated sandflats, existing as patches or continuous beds, and require some of the highest light levels of any plant group worldwide (Orth et al. 2006). The fact that they have high light requirements means that they are acutely sensitive to environmental changes, especially those that alter water clarity (Orth et al. 2006). Acting as ecosystem engineers, they provide numerous ecological services; they stabilize sediments, their leaves trap/hold nutrients, therefore providing nutrient rich habitats for resident communities such as anemones and limpets, they are food for herbivores and are nurseries for invertebrates and fishes (Orth et al. 2006, Pillay et al. 2010). They, with salt marshes and mangroves, hold about 50 percent of the total organic carbon of the ocean sediments (Hinrichsen et al. 2011, Orth et al. 2006, Ray et al. 2014). Seagrass beds play an important role in providing substrate for some algal species, and improve water quality by filtering suspended matter (Short and Neckles 1998, Williams and Heck Jr. 2001, Hinrichsen et al. 2011). Combined, seagrass functions enhance the biomass, abundance and diversity of local fauna when compared to the surrounding bare sand (Ray et al. 2014). Studies have confirmed that these structurally complex marine plants have partially declined due to natural disturbances such as strong storms, hurricanes and typhoons (Duarte 2002). However, anthropogenic activity, causing direct damage and deterioration of water quality, has been identified as the primary cause (Airoldi et al. 2008, Duarte 2002, Ray et al. 2014). Besides seagrass loss due to fragmentation, species composition of seagrasses changes and this can affect faunal assemblages (Ray et al. 2014). Duarte (2002) found that the primary source of human impact on seagrass ecosystems is physical disturbance, which is derived from human usage of the coastal zone for transportation, recreation and food production. In Europe, it is estimated that between 1960 and 1995 a kilometer of coastline was developed every day; this in turn caused huge losses of coastal wetland and seagrass habitat− between 50% and 80% of the original area was lost for many regions (Airoldi et al.2008). In the case of the Oesterwal beach, Langebaan in the Western Cape, Pillay et al. (2010) discovered that coastal eutrophication (which drives algal blooms that reduce light availability), over- exploitation of top predatory fish and coastal developments (dredging) were the main causes of damage to seagrass beds. Dredging modifies sediment dynamics by creating small patches of bare sand in a matrix of seagrass, dissecting contiguous seagrass into separate patches (Boström et al.2006). Collectively anthropogenic activities can lead to the irreversible elimination of seagrasses from coastal ecosystems (Ray et al. 2014). The reduction of seagrasses results in habitat loss, thus causing a major reduction in species diversity and spatial distribution, a process also described as biotic homogenization (Airoldi et al.2008). Fragmentation in any ecosystem leads to the isolation of subpopulations and alters interaction among species (Braschler and Baur 2016). Populations in small patches have greater sensitivity to demographic stochasticity and typically experience genetic variation (Braschler and Baur 2016). Patch dynamics and the fragmentation of seagrasses are partly based on the island biogeography model, which suggest that there is a focal habitat patch type (seagrass), which occurs in a matrix of a less favorable habitat (bare sand) (Boström et al. 2006). As fragmentation increases the proportion of edge to interior also increases, therefore with fragmentation a variety of faunal responses can be expected, depending on species preference to the center or edge of their habitat (Bell et al. 2001). Faunal densities tend to increase from the edges to the
- 3. interior of patches, therefore modifying species dispersal because the quality of the patch is relatively lower (Bell et al. 2001). This could be of critical importance for conservation in Langebaan Lagoon, especially with the predicted impact of landscape alteration (Bell et al. 2001). Due to the state of coastal land-use and seagrass loss, we aim to examine broad- scale patch dynamics and impacts on patch quality and epifaunal communities. Firstly, we intend to determine changes in total seagrass area, patch number and patch distance among the intertidal zones (low, mid and high shore) from 2009 to 2015. Secondly we will determine trends in patch quality both within patches and between intertidal zones. Lastly, we will test the effects of both fragmentation and patch quality on epifaunal presence and abundance. Since the work of Pillay et al. (2010), which provided a broad- scale study of the Langebaan Lagoon, and Cameron-Burr et al. (2014), which narrowed the study to just Klein Oesterwal, to our knowledge no work has been done within Langebaan Lagoon. Detailed spatial and temporal changes of the seagrass beds in Klein Oesterwal have not been re-examined. We aim to build on previous work with a focus on changing seagrass patch dynamics and impacts on patch quality and the epifaunal communities that they support. Based on Bell et al. (2001), we emphasize the importance of understanding the role of edge effects in the restoration efforts of habitats that differ in size and shape. Our methodology aims to show relationships between seagrass patch dynamics and the number of species and individuals it supports (McNeill and Fairweather 2016). Our study will contribute to long-term data collection in addition to suggesting efficient restoration and management of the seagrasses in Langebaan Lagoon. We hypothesize that (1) cover of Z. capensis has decreased from 2009 to 2015, as well as an increase in the fragmentation of the remaining seagrass beds. This implies negative consequences on patch quality and epifaunal communities. (2) Patch quality, which we define as the percent cover and leaf length of seagrass patches, will decrease from the center of patches to the edges, and from low shore to the high shore. (3) Fauna will be affected by changing patch quality, and patch centers will have higher species diversity, whilst the edges have a relatively lower species diversity. Methods Study site Langebaan Lagoon is a saltwater lagoon on the west coast of South Africa. The lagoon was declared a protected area in 1985, and now falls within West Coast National Park, in the municipality of Langebaan, Western Cape Province (Pillay et al. 2010). The study site, Klein Oesterwal (33.7.362 S, 18.3.094 E), lies just outside of the park in an area where human disturbance, including bait harvesting, angling, windsurfing and sail boating, are permitted (Pillay et al. 2010). Data was collected on April 15 during the afternoon low tide (17:00) and April 16, 17, 18, 19 during the morning low tide (06:00- 08:00). The tidal range during sampling was roughly 0.96m. Study species Cape eelgrass (Zostera capensis) is a seagrass endemic to South Africa and dominates intertidal vegetation in Langebaan Lagoon (Cameron-Burr et al. 2014). Z. capensis can exist as both continuous beds capable of spanning hundreds of square
- 4. meters, or as a mosaic of smaller patches among unvegetated sand flats (Pillay et al. 2010). Z. capensis beds function as ecosystem engineers; their root/rhizome system stabilizes sediment while the leaf canopy traps nutrients, thus providing habitat and food for a number of marine organisms, from algae to small fish (Pillay et al. 2010). Patch size and quality To determine if patch distance from shore affects patch quality we sampled patches at various locations across the intertidal zone (high, mid and low shore) in addition to quadrat location (center and edge). Zones were defined by their distance from the highest high tide line at the top of the beach; high shore was approximately 5 meters from the high tide line, mid shore approximately 10-20 meters and low shore 20-50 m (Cameron-Burr et al. 2014). Four sea grass patches were sampled in the high shore, three in the mid shore, and five in the low shore. For each patch, 3-5 measurements of length and width were used to estimate patch area for comparison across zones. The number of measurements depended on the size of the patch. Patch location was recorded using a Garmin GPS model GPSMAP 64. To assess patch quality, we measured both leaf length and percent cover in each patch across the intertidal zone. Data for leaf length and percent cover was collected from six 0.25 m2 quadrats, three from the center of the patch and three from the edge (Pillay et al. 2010; Cameron-Burr et al. 2014). Using a ruler and taking the average of five medium-sized leaves determined leaf length values for each quadrat. Medium-length was defined as representative of 80% of the seagrass leaf lengths (Cameron-Burr et al. 2014). To account for seasonal and daily water-level fluctuations, percent cover was determined from the base of the seagrass bed rather than seagrass canopy cover, as has been done in previous studies (Cameron-Burr et al. 2014). Assessing Epifaunal Presence and Abundance Data on epifaunal species were collected following patch quality measurements. Data collectors initially scanned the surface of each 0.25m2 quadrat to record data on all visually obvious species. Sediment was then carefully dug, so as to avoid disturbance to the seagrass roots, down to a depth of roughly 5cm and sifted through by hand. Each unique epifaunal species was then identified and recorded (Branch et al. 2010), as well as their respective abundance. A total of 72 quadrats were sampled (36 center, 36 edge) in the 12 patches, across all zones (low, mid, high). Change in Patch Dynamics in Klein Oesterwal LANDSAT images of Klein Oesterwal in 2009, 2014 and 2015 were obtained from Google Earth Pro and geo-referenced to 1:2000 topographical map using Quantum GIS version 2.4.0. Total area, patch count and mean patch distance of Z. capensis was estimated for Klein Oesterwal by digitizing seagrass beds from geo-referenced images (1:2000) for each time period. Patch distances were determined using a distance matrix tool in QGIS. For full processing protocol see additional material in Appendix. Data Analysis All multivariate analyses for patch dynamics were run in Minitab Express version 1.3.0. To assess changes in patch connectedness, one-way analysis of variance (ANOVA)
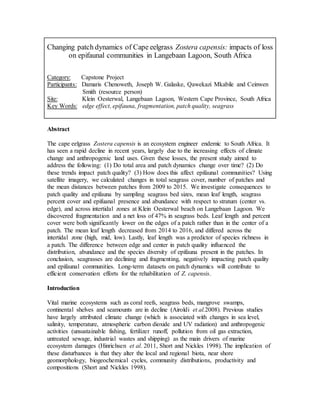
- 5. was run to show the effect of year (2009, 2014, 2015) on patch distance. Changes in the number of patches and total bed area were collected from the digitized seagrass beds in QGIS. Two-way ANOVA was used to assess the effect of year (2009, 2014, 2015) and shore position (high, mid, low) on patch size (m2). For patch quality, one-way ANOVAs were ran to assess the effect of stratum (center vs. edge) and shore position on average leaf length (cm) and percent cover. Two-way ANOVA was used to perceive the effect of year (2014 vs. 2016) and shore position on average leaf length. All epifaunal multivariate analyses were performed using PRIMER version 6. Non-metric multidimensional scaling (MDS) ordination and cluster-analysis were used to visually assess differences in community structure of epifauna between high, mid, and low shore positions in 2016. MDS ordination was constructed from Bray-Curtis similarities to show relative dispersal between samples. Epifaunal abundance data was square root transformed to account for those species with high individual counts. Permutational multivariate analysis of variance (PERMANOVA) was run to assess epifaunal similarity within and between zones. Distance-based test of multivariate dispersions (PERMDISP) was subsequently run to test for homogeneity of relative dispersal within zones (high, mid, low). Results Changes in Seagrass Patch Dynamics between 2009 and 2016 Calculations from GIS show a decline in seagrass total area from 2009 to 2014 by 67.2% and a slight increase of 22% from 2014 to 2015. Additionally, the number of patches increased from 14 in 2009 to 25 in 2015. The mean distance between patches significantly increased from 2009 to 2015 (F= 22.83, p=0.00001; Table 1). Figure 2 shows spatial distributions of Zostera capensis in 2009, 2014 and 2015. Visually, seagrass area appears to reduce from the high to low shores and patches appear to be more scattered in the low shore (Figure 1). Within the smaller study site (2014 and 2016), patch size did not differ with zone (df=2, F=1.0679413, p=0.363467433) or between years (df=1, F=2.6431795, p=0.120467292). Table 1. Changes in the number of patches, mean (± standard error) distance between patches and total seagrass area at Klein Oesterwal between 2009, 2014 and 2015. 2009 2014 2015 Number of patches 14 24 25 Mean patch distance 81.71 ± 3.17 113.188 ± 3.817 92.116 ± 2.066 Total area (m2) 5205.619 1897.237 2192.979
- 6. Figure 1. Changes in total area of Zostera capensis at Klein Oesterwal between 2009, 2014 and 2015. Maps are based on LANSAT images with digitized seagrass beds. Changes in Patch Quality Mean leaf length was significantly higher in the center of a patch when compared to edge (Table 2). Mean percent cover was also significantly higher in the center than on the edge (Table 2). Additionally, mean leaf length differed significantly by zone, year and with the interaction of zone and year. Length increased from the high to low zones and decreased overall from 2014 to 2016 (df=1, F=11.676, p<0.001; Table 4). Percent cover did not differ between zones (Table 4). Table 2. Mean (± standard error) leaf length, percent cover and species richness comparisons between the center and edge of a patch at Klein Oesterwal in 2016. Center Edge df F Mean leaf length 18.461 ± 1.450 15.492 ± 1.297 1 5.884 p=0.017* Mean percent cover 59.710 ± 5.995 46.913 ± 5.810 1 12.966 p<0.001* Mean species richness 4.691 ± 0.254 3.676 ± 0.254 1 7.297 p=0.009* *Indicates significant (p<0.05) differences between center and edge. Mean species richness represents mean species per quadrat. Epifaunal Assemblages and Species Richness Eighteen species were observed across all zones, the globular mud snail, Assiminea globulus being the most abundant in the high shore (n=1204), in the mid the most abundant was the bamboo worm, Euclyeme spp. (n=72), and the turbin shell
- 7. Turitella capensis in the low (n=365; Figure 2; Table 3). An MDS of faunal assemblages showed clustering by zone with 40% similarity. Visually, the mid zone appeared less tightly clustered than the high or low zones (Figure 3). A PERMANOVA illustrated that all zones were significantly more similar within zones than between (p=0.001; See Appendix). A PERMDISP additionally showed that the multivariate dispersion of the mid zone was significantly less homogenous than that of the high and mid zones (p=0.006; See Appendix). Similarity between edge and center was not significantly different, however the multivariate dispersion of edge was significantly less homogenous than center (See Appendix). Mean species richness increased from high to low zones. Mean leaf length had a small relationship to mean species richness (Table 4). Figure 2. Total species abundances across all zones (high, mid, low) at Klein Oesterwal in 2016. 0 200 400 600 800 1000 1200 1400 Siphonaria compressa Cypraeidae Sponge spp. Paratylodiplax edwardsii Crab spp. Fissurella mutabilis Hynenosoma orbiculare Nassarius spp. Nassarius kraussianus Parvulastra exigua Littorina saxatilis Clionella spp. Diogenes brevirostris Callianassa kraussi Sargatia ornata Euclymene spp. Turritella capensis Assiminea globulus Abundance
- 8. Table 3. Relative species abundance (% composition) of high, mid and low zones at Klein Oesterwal in 2016. Common name Species High Mid Low Eelgrass false-limpet Siphonaria compressa Cowry shell* Cypraeidae Sponge** Sponge spp. Sandflat crab Paratylodiplax edwardsii Crab*** Crab spp. Cape keyhole-limpet Fissurella mutabilis Crown crab Hynenosoma orbiculare Dogwhelk**** Nassarius spp. Tick shell Nassarius kraussianus Dwarf cushion-star Parvulastra exigua British periwinkle Littorina saxatilis Clionella^ Clionella spp. Common sand hermit Diogenes brevirostris Common sandprawn^^ Callianassa kraussi Rooted anenome Sargatia ornata Bamboo worm^^^ Euclymene spp. Turbin shell Turritella capensis Globular mud snail Assiminea globulus =0 <1 <5 <15 <50 <100 *The family name Cypraeidae was used, as cowry shell species could not be determined. **Sponge species could not be determined. ***Crab spp. represents all crab species that were not Hynenosoma orbiculare or Paratylodiplax edwardsii. ****Nassarius spp. represents all Nassurius genus that were not Nassarius kraussianus. ^All Clionella species. ^^Individuals were estimated by halving the number of sand prawn holes counted.
- 9. ^^^All Euclymene species. Table 4. Comparisons of mean (± standard error) leaf length, mean percent cover and mean species richness between zones at Klein Oesterwal in 2016. High Mid Low df F Mean leaf length (cm) 13.481 ± 0.971 14.766 ± 1.121 17.890 ± 0.868 1 11.676 p<0.001* Mean percent cover (%) 28.875 ± 3.047 32.056 ±3.519 29.567 ±2.726 2 0.219 p=0.804 Mean species richness 6.5 ± 0.346 9.67 ± 0.498 10.2 ± 0.182 2 5.248 p=0.031* *Indicates significant difference. Mean species richness represents mean species per patch. Figure 7. Non-metric multidimensional scaling (MDS) ordination of quadrats based on faunal assemblages at Klein Oesterwal in 2016. Each sample represents a single quadrat with pooled data from all quadrats across the intertidal zone (high, mid, low). Quadrats are clustered with a 40% similarity.
- 10. Table 5. Results from regression analyses of leaf length, percent over and patch area against species richness at Klein Oesterwal in 2016. *Indicates significant relationship. Mean species richness for regressions with leaf length and percent cover were represent mean species per quadrat. Mean species richness for regression with patch area represents mean species per patch. Discussion Seagrass Decline and Fragmentation in Klein Oesterwal The decline in total area of Zostera capensis beds observed in Langebaan Lagoon between 2009 and 2015 is consistent with other studies that report declines in seagrasses over the last century (Duarte 2002, Orth et al. 2006; Pillay et al. 2010; Ray et al. 2014). The reason for the severe loss of Z. capensis in Langebaan Lagoon since 2009 is unclear, but several studies have attributed direct human activity (bait harvesting, trampling, boating, angling, etc.) and indirect human impacts (climate change, increased sea temperature, increased CO2 concentration, sea level rise, changing weather patterns and shoreline erosion) as potential sources of seagrass loss (Short and Neckles 1999; Duarte 2002; Orth et al. 2006; Pillay et al. 2010; Ray et al. 2014). Another factor not yet looked at is the impact of avian trampling on seagrass bed decline. Large wading birds, including the curlew sandpiper Calidris ferruginea and greater flamingo Phoenicopterus roseus, either feed on the seagrass beds themselves or the invertebrate communities that use the seagrass as habitat (Pillay et al. 2010). Through their foraging behavior, these wading birds have the ability to shape seagrass patch dynamics by trampling, overturning sediment and uprooting the beds where they feed (Pillay et al. 2010). Given the susceptibility of seagrasses to sedimentation and burial (Pillay et al. 2010), it is likely that avian disturbance has contributed to the decline of Z. capensis in Klein Oesterwal. While the reasons for the decline in Z. capensis cover in Langebaan Lagoon remain speculative, our data collected from Klein Oesterwal now show that fragmentation of remaining seagrass habitat is also occurring over time (see Table 1). Whilst the reasons for increased seagrass bed fragmentation also remain unclear, studies have implicated bait harvesting as being one likely driver (Pillay et al 2010; Cameron- Burr et al. 2014). Mud and sand prawns, popular choices for angling bait, are usually collected with a handheld prawn pump, which turns over sediment cores from ~90cm deep to the surface (Pillay et al. 2010). Each bait collector turns over ~200-300kg of sediment to collect 50 prawns per day, resulting in ~5,000 tons of sediment being turned over annually in Langebaan Lagoon (Pillay et al. 2010). Given the vulnerability of Mean species richness Leaf length (cm) R2=0.078 p=0.018* Percent cover (%) R2=0.010 p=0.409 Patch area (m2) R2=0.004 p=0.846
- 11. seagrass beds to sediment smothering, it is probable that increasing fragmentation in Klein Oesterwal can be at least partially attributed to such disturbance. Impacts on Patch Quality and Epifaunal Communities Fragmentation leads to an intensified edge effect through increasing the outer surface area of the patch community, therefore exposing more area to higher disturbance (Pillay et al. 2010; Cameron-Burr et al. 2014). Increasing fragmentation would therefore have negative consequences on overall patch quality, measured in terms of leaf length and percent cover. Likewise average leaf length declined from 2014 to 2016, supporting the negative effect of fragmentation on patch quality. Leaf length was also shown to be longer in the center of patches, supporting edge effects on patch leaf length. Although an analysis of the change in percent cover from 2014 to 2016 was not possible due to methodological differences, our results do show a change in percent cover with respect to stratum (center vs. edge; see Figure 4). This also supports the predictions made by edge theory, as increasing outer surface area will expose seagrass leaves to higher disturbance from herbivory and sedimentation (Bell et al. 2001; Pillay et al. 2010; Cameron-Burr et al. 2014). Many motile organisms have the ability to choose preferred microhabitats to increase survival in response to predation pressure (Ray et al. 2014). Given that percent cover and leaf length is higher in the center of patches, edge theory predicts that epifauna should select for the center of patches so as to avoid higher disturbance (e.g. predation) on patch edges (Bell et al. 2001). Our results demonstrate higher species richness in the center of a patch as compared to the edge, affirming edge effects on epifaunal communities in Klein Oesterwal. Declining patch quality, as a result of fragmentation, are therefore expected to have a negative impact on epifaunal presence and abundance (Duarte 2002; Orth et al. 2006; Pillay et al. 2010; Ray et al. 2014; Cameron-Burr et al. 2014). For example, species that are largely associated with Z. capensis, the surface- dwelling limpet Fissurella mutabilis and the dwarf cushion starfish Parvulastra exigua, have virtually disappeared from Klein Oesterwal between 1983 and 2009 (Pillay et al. 2010). The crucial role that Z. capensis plays in supporting these marine species is indicative of its capability to increase local heterogeneity and biodiversity in otherwise homogenous sedimentary habitats (Orth et al. 2006; Pillay et al. 2010; Ray et al. 2014). Implications for Management Severe loss and fragmentation of Z. capensis, and the negative impacts on patch quality and epifaunal communities, has important implications for conservation and management. The current challenge is to synthesize information to enhance our understanding of seagrass processes, threats and change in Langebaan Lagoon, and to apply this knowledge to develop effective management strategies (Orth et al. 2006). Management applications should be based on the foundation of seagrass knowledge developed in Langebaan Lagoon and aimed at establishing standards to conserve and restore Z. capensis. A number of seagrass management strategies have objectives with quantitative goals aimed at restoring seagrasses to target levels (Duarte 2002; Orth et al. 2006). This allows resource managers, who often make critical decisions, to justify the expense of public funds (Orth et al. 2006). One key example is seagrass restoration programs that
- 12. use transplantation. Globally, the success rate of seagrass transplantation and restoration is ~30%, although in some regions higher success rates have been reported (Orth et al. 2006). With the severe loss and fragmentation of Z. capensis in Langebaan Lagoon (see Table 1), we propose transplant restoration programs as one viable solution. However, some species are so difficult to transplant that restoration is not logistically or economically feasible (Orth et al. 2006). Given the unknown success rate and high cost of such programs, we also suggest a small-scale pilot study be done within Langebaan Lagoon, using Klein Oesterwal as a potential study site. Several small-scale (< 1 hectare) restoration programs have been attempted or are being planned using both adult plants and seeds (Orth et al. 2006), providing a reference for restoration programs within Langebaan Lagoon. Long-term studies, comparing the functionality of transplanted areas with that of natural populations, would be necessary before larger-scale implementation would be feasible in Langebaan Lagoon. We found that epifaunal assemblage and species richness significantly differed across the intertidal zone, demonstrating higher species richness in the low shore (see Table 4). This has implications for direct intervention programs, as our results suggest the low shore (20-50m from the high tide line) as a higher priority for conserving total biodiversity. Langebaan Lagoon is currently divided into 3 zones with varying recreational and harvesting activities (Pillay et al. 2010). Zone A (municipality of Langebaan) is defined as a multi-purpose recreational area, Zone B (Bottelray) is a limited recreational area and Zone C (West Coast National Park) is a “sanctuary” area where human activity is prohibited (Pillay et al. 2010). Our results warrant research into a potential extension of the zonation, thus limiting human activity in the low shore of the intertidal zone. Conclusions Seagrasses are critical components of the marine ecosystems where they exist (Duarte 2002; Orth et al. 2006; Waycott et al. 2009; Pillay et al. 2010; Ray et al. 2014). Despite their ecological importance, severe losses and fragmentation of Z. capensis beds are occurring (Pillay et al. 2010), especially within the context of Klein Oesterwal. These broad-scale processes negatively impact patch quality, and thus epifaunal communities. Given this background, there is an urgent for the development and implementation of effective seagrass management programs in Langebaan Lagoon. The preservation of seagrasses and their associated ecosystem services should be an emphasized priority. We believe that the crisis facing Z. capensis in Langebaan Lagoon can be averted with a concerted conservation effort, and this effort will benefit not just seagrasses and their associated epifauna but also the entirety of the coastal ecosystem. Acknowledgements Firstly, we thank Ceini Smith and Donovan Tye for their help in the field, as well as their advice and guidance on this project. Secondly, we would like to thank South African National Parks for allowing us access to resources within West Coast National Park. Finally, we thank the Organization of Tropical Studies and Duke University for allowing us to take part in this program.
- 13. References Aroildi, L., D. Balata and M.W. Beck. 2008. The gray zone: relationship between habitat loss and marine diversity and their applications in conservation. Journal of Experimental Marine Biology and Ecology 336:8-15. Bell, S.S., R.A. Brooks, B.D. Robbins, M.S. Fonseca and M.O. Hall. 2001. Faunal response to fragmentation in seagrass habitats: implications for seagrass conservation. Biological Conservation 100: 115-123. Boström, C., E.L. Jackson, and C.A. Simenstad. 2006. Seagrass landscapes and their effects on associated fauna: a review. Estaurine, Coastal and Shelf Science 68: 383-403. Braschler, B. and B. Baur. 2016. Diverse effects of a seven-year experimental grassland fragmentation on major invertebrate groups. Plos one 11(2):1-20. Cameron-Burr, K., E. Guen-Murray, Z. Kitchel, M. Schmitt, C. Lawrence, and L. Kruger. 2014. Location, Location, Location: Shoreline position and patch dynamics in Zostera capensis ecosystems in marine estuary. Organization for Tropical Studies report Spring 2012. West Coast National Park, Western Cape Province, South Africa. Duarte, C.M. 2002. The future of seagrass meadows. Environmental Conservation 29 (2): 192-206. Hinrichsen, H.H, B. Huwer, A. Markarchouk, C. Petereit, M. Schaber and R. Voss. 2011. Climate-driven long-term trends in Baltic Sea oxygen concentrations and the potential consequences for eastern Baltic cod (Gadus morhua). ICES Journal of Marine Science 68(10):2019-2028. McNeil, S.E. and P.G. Fairweather. 1993. Single large or several small marine reserves? An experimental approach with seagrass fauna. Journal of Biogeography 20(4): 429-440. Orth, R.J., T.J.B. Carruthers, W.C. Dennison, C.M. Duarte, J.W. Fourqurean, K.L. Heck Jr., A.R. Hughes, G.A. Kendrick, W.J. Kenworthy, S. Olyarnik, F.T. Short, M. Waycott, S.L. Williams. 2006. A Global Crisis for Seagrass Ecosystems. BioScience 56 (12): 987-996. Pillay, D., G.M. Branch, C.L. Griffiths, C. Williams, and A. Prinsloo. 2010. Ecosystem change in a South African marine reserve (1960-2009): role of seagrass loss and anthropogenic disturbance. Marine Ecology Progress Series 415: 35-48.
- 14. Ray, B.R., M.W. Johnson, K. Cammarata and D.L. Smee. 2014. Changes in seagrass species composition in northwestern gulf of Mexico estuaries: effects on associated seagrass fauna. Plos one 9(9):1-12. Short, F.T. and H.A. Neckles. 1999. The effects of global climate change on seagrasses. Aquatic Biology 63:169-196. Waycott, M., C.M. Duarte, T.J.B. Carruthers, R.J. Orth, W.C. Dennison, S. Olyarnik, A. Calladine, JW. Fouquerean, K.L. Heck Jr., A.R. Hughes, G.A. Kendrick, W.J. Kenworthy, F.T. Short, and S.L, Williams. 2009. Accelerating loss of seagrasses across the globe threatens coastal ecosystems. PNAS 106:12377-12381. Williams, S.L and K.L. Heck Jr.2001. Seagrass community ecology. Pp317-336 in Bertness, M.D., S.D. Gaines, M.E. Hay, editors. Marine community ecology and conservation. Sinauer Associates, inc. Publishers, Sunderland, Massachusetts.
- 15. Appendix Protocols for Geo-referencing Seagrasses in QGIS: In Google earth Pro Insert place-marks into four points that were boundaries to the study area Save the place-marks coordinates for geo-referencing in QGIS In QGIS: Load the LANDSAT images from Google Earth Pro into QGIS To geo-reference Raster> Geo-referencer (pop up)>Load raster>Add points (place-mark coordinates from the Google Earth Pro images Transformation settings>Transformation type_Helmert Target SRS>WGS 84/UTM zone 34S Start geo-referencing Close the geo-referencing pop up Layer>new shapefile> rename>insert CRS (same as the geo-referenced images) On the toolbars>Toogle editing>Add feature>digitize Save To calculate area Right click on the new digitized shapefiles on the layers toolbar>open attribute table>click on toogle editing mode>open field calculator>field calculator pop up>Output field name: area>output field type: decimal number(real)>output field width: 10> precision: 4>Function list>Geometry>$area (double click so that it appears on expression >ok Export the calculated area to an excel spreadsheet Table A2. PERMANOVA results: average similarities between/within zones with pairwise comparisons. Zones t df High, Mid 4.1698 38 p=0.001 High, Low 7.2159 50 p=0.001 Mid, Low 3.6457 44 p=0.001 Table A3. PERMDISP results: average homogeneity within zones (± standard error) (F=6.625, df1=2, df2=69, p=0.006). Zones Average High 34.443 ± 3.275 Mid 46.536 ± 2.442 Low 34.784 ± 1.598
- 16. Table A4. PERMDISP results: pairwise comparisons of average homogeneity between zones. Zones t High, Mid 2.787 p=0.001 High, Low 0.099 p=0.946 Mid, Low 4.202 p=0.001 Table A5. PERMANOVA results: average similarities between/within center and edge (t=1.4083, p=0.088). Center Edge Center 32.215 Edge 28.023 25.111 Table A6. PERMDISP results: average homogeneities of center and edge (F=8.915, df1= 1, df2= 70, p=0.007). Center 48.688 ± 1.413 Edge 54.26 ± 1.219