1. February 26, 2016
Joshua Moews
joshua.moews@me.com
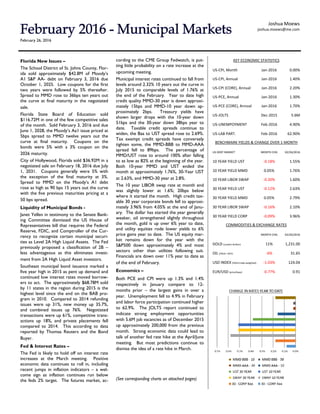
KEY ECONOMIC STATISTICS
US‐CPI, Month Jan‐2016 0.00%
US‐CPI, Annual Jan‐2016 1.40%
US‐CPI (CORE), Annual Jan‐2016 2.20%
US‐PCE, Annual Jan‐2016 1.30%
US‐PCE (CORE), Annual Jan‐2016 1.70%
US‐JOLTS Dec‐2015 5.6M
US‐UNEMPOYMENT Feb‐2016 4.90%
US‐LAB PART. Feb‐2016 62.90%
BENCHMARK YIELDS & CHANGE OVER 1‐MONTH
US DEBT MARKET MONTH CHG 02/26/2016
10 YEAR YIELD UST ‐0.18% 1.55%
10 YEAR YIELD MMD 0.05% 1.76%
10 YEAR LIBOR SWAP ‐0.20% 1.60%
30 YEAR YIELD UST ‐0.12% 2.63%
30 YEAR YIELD MMD 0.05% 2.79%
30 YEAR LIBOR SWAP ‐0.16% 2.10%
30 YEAR YIELD CORP ‐0.09% 3.96%
COMMODITIES & EXCHANGE RATES
GOLD (London Bullion) 11% 1,231.00
OIL (FRED—WTI) ‐6% 31.65
USD INDEX (FRED trade‐weighted) ‐1.03% 124.04
EUR/USD (price/base) ‐0.77% 0.91
MONTH CHG 02/26/2016
Florida New Issues –
The School District of St. Johns County, Flor-
ida sold approximately $42.8M of Moody’s
A1 S&P AA- debt on February 3, 2016 due
October 1, 2025. Low coupons for the first
two years were followed by 5% thereafter.
Spread to MMD rose to 36bps ten years out
the curve at final maturity in the negotiated
sale.
Florida State Board of Education sold
$116.72M in one of the few competitive sales
of the month. Sold February 3, 2016 and due
June 1, 2028, the Moody’s Aa1 issue priced at
5bps spread to MMD twelve years out the
curve at final maturity. Coupons on the
bonds were 5% with a 3% coupon on the
2026 maturity.
City of Hollywood, Florida sold $36.92M in a
negotiated sale on February 18, 2016 due July
1, 2031. Coupons generally were 5% with
the exception of the final maturity at 3%.
Spread to MMD on the Moody’s A1 debt
rose as high as 90 bps 15 years out the curve
with the five previous maturities pricing at a
50 bps spread.
Liquidity of Municipal Bonds -
Janet Yellen in testimony to the Senate Bank-
ing Committee dismissed the US House of
Representatives bill that requires the Federal
Reserve, FDIC, and Comptroller of the Cur-
rency to recognize certain municipal securi-
ties as Level 2A High Liquid Assets. The Fed
previously proposed a classification of 2B –
less advantageous as this eliminates invest-
ment from 2A High Liquid Asset investors.
Southeast municipal bond issuance marked a
five year high in 2015 as pent up demand and
continued low interest rates moved borrow-
ers to act. The approximately $68.78M sold
by 11 states in the region during 2015 is the
highest level since the end on the BAB pro-
gram in 2010. Compared to 2014 refunding
issues were up 31%, new money up 35.7%,
and combined issues up 76%. Negotiated
transactions were up 61%, competitive trans-
actions up 18%, and private placements fell
compared to 2014. This according to data
reported by Thomas Reuters and the Bond
Buyer.
Fed & Interest Rates –
The Fed is likely to hold off on interest rate
increases at the March meeting. Positive
economic data continues to roll in, including
recent jumps in inflation indicators – a wel-
come sign as inflation continues run below
the feds 2% target. The futures market, ac-
cording to the CME Group Fedwatch, is put-
ting little probability on a rate increase at the
upcoming meeting.
Municipal interest rates continued to fall from
levels around 2.32% 10 years out the curve in
July 2015 to comparable levels of 1.76% at
the end of the February. Year to date high
credit quality MMD-30 year is down approxi-
mately 15bps and MMD-10 year down ap-
proximately 2bps. Treasury yields have
shown larger drops with the 10-year down
51bps and the 30-year down 38bps year to
date. Taxable credit spreads continue to
widen, the Baa to UST spread rose to 2.69%.
Tax exempt credit spreads have conversely
tighten some, the MMD-BBB to MMD-AAA
spread fell to 89bps. The percentage of
MMD/UST rose to around 100% after falling
to as low as 82% at the beginning of the year.
Both 10-year MMD and UST ended the
month at approximately 1.76%, 30-Year UST
at 2.63%, and MMD-30 year at 2.8%.
The 10 year LIBOR swap rate at month end
was slightly lower at 1.6%; 20bps below
where it started the month. High credit tax-
able 30 year corporate bonds fell to approxi-
mately 3.96% from 4.05% at the end of Janu-
ary. The dollar has started the year generally
weaker, oil strengthened slightly throughout
the month, gold is up over 6% year to date,
and utility equities rode lower yields to 6%
price gains year to date. The US equity mar-
ket remains down for the year with the
S&P500 down approximately 4% and most
sectors other than utilities following suit.
Financials are down over 11% year to date as
of the end of February.
Economics –
Both PCE and CPI were up 1.3% and 1.4%
respectively in January compare to 12-
months prior – the largest gains in over a
year. Unemployment fell to 4.9% in February
and labor force participation continued higher
to 62.9%. The JOLTS report continued to
indicate strong employment opportunities
with 5.6M job vacancies as of December 2015
up approximately 200,000 from the previous
month. Strong economic data could lead to
talk of another fed rate hike at the April/June
meeting. But most predictions continue to
dismiss the idea of a rate hike in March.
(See corresponding charts on attached pages)