1. FOR RELEASE: STRICTLY CONFIDENTIAL
In Washington (EST): 10:00 a.m., January 24, 2012 UNTIL RELEASED
Global Recovery Stalls, Downside Risks Intensify
The global recovery is threatened by intensifying strains in the euro area and fragilities elsewhere.
Financial conditions have deteriorated, growth prospects have dimmed, and downside risks have escalated.
Global output is projected to expand by 3¼ percent in 2012 (Table 1 and Figure 1)—a downward revision
of about ¾ percentage point relative to the September 2011 World Economic Outlook (WEO). This is
largely because the euro area economy is now expected to go into a mild recession in 2012 as a result of
the rise in sovereign yields, the effects of bank deleveraging on the real economy, and the impact of
additional fiscal consolidation. Growth in emerging and developing economies is also expected to slow
because of the worsening external environment and a weakening of internal demand. The most immediate
policy challenge is to restore confidence and put an end to the crisis in the euro area by supporting growth,
while sustaining adjustment, containing deleveraging, and providing more liquidity and monetary
accommodation. In other major advanced economies, the key policy requirements are to address medium-
term fiscal imbalances and to repair and reform financial systems, while sustaining the recovery. In
emerging and developing economies, near-term policy should focus on responding to moderating domestic
growth and to slowing external demand from advanced economies.
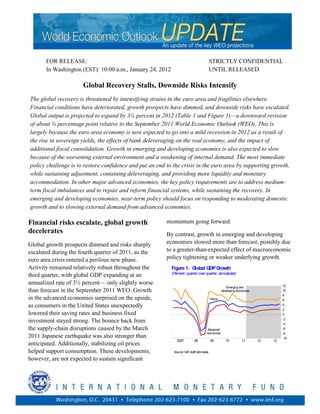
Financial risks escalate, global growth momentum going forward.
decelerates By contrast, growth in emerging and developing
Global growth prospects dimmed and risks sharply economies slowed more than forecast, possibly due
escalated during the fourth quarter of 2011, as the to a greater-than-expected effect of macroeconomic
euro area crisis entered a perilous new phase. policy tightening or weaker underlying growth.
Activity remained relatively robust throughout the Figure 1. Global GDP Growth
(Percent; quarter over quarter, annualized)
third quarter, with global GDP expanding at an
annualized rate of 3½ percent— only slightly worse 12
Emerging and
than forecast in the September 2011 WEO. Growth developing economies 10
8
in the advanced economies surprised on the upside, World 6
as consumers in the United States unexpectedly 4
2
lowered their saving rates and business fixed 0
-2
investment stayed strong. The bounce back from -4
the supply-chain disruptions caused by the March Advanced -6
economies -8
2011 Japanese earthquake was also stronger than -10
2007 08 09 10 11 12 13
anticipated. Additionally, stabilizing oil prices
helped support consumption. These developments, Source: IMF staff estimates.
however, are not expected to sustain significant
2. 2 WEO Update, January 2012
Table 1. Overview of the World Economic Outlook Projections
(Percent change unless noted otherwise)
Year over Year
Difference from September Q4 over Q4
2011 WEO Projections
Projections Estimates Projections
2010 2011 2012 2013 2012 2013 2011 2012 2013
World Output 1 5.2 3.8 3.3 3.9 –0.7 –0.6 3.3 3.4 4.0
Advanced Economies 3.2 1.6 1.2 1.9 –0.7 –0.5 1.3 1.3 2.1
United States 3.0 1.8 1.8 2.2 0.0 –0.3 1.8 1.5 2.4
Euro Area 1.9 1.6 –0.5 0.8 –1.6 –0.7 0.8 –0.2 1.2
Germany 3.6 3.0 0.3 1.5 –1.0 0.0 1.8 0.7 1.6
France 1.4 1.6 0.2 1.0 –1.2 –0.9 0.9 0.5 1.3
Italy 1.5 0.4 –2.2 –0.6 –2.5 –1.1 –0.1 –2.7 0.9
Spain –0.1 0.7 –1.7 –0.3 –2.8 –2.1 0.2 –2.1 0.6
Japan 4.4 –0.9 1.7 1.6 –0.6 –0.4 –0.9 1.9 1.5
United Kingdom 2.1 0.9 0.6 2.0 –1.0 –0.4 0.8 1.0 2.4
Canada 3.2 2.3 1.7 2.0 –0.2 –0.5 2.1 1.7 2.0
2
Other Advanced Economies 5.8 3.3 2.6 3.4 –1.1 –0.3 2.9 3.2 3.5
Newly Industrialized Asian Economies 8.4 4.2 3.3 4.1 –1.2 –0.3 3.8 4.3 3.8
3
Emerging and Developing Economies 7.3 6.2 5.4 5.9 –0.7 –0.6 5.9 6.0 6.3
Central and Eastern Europe 4.5 5.1 1.1 2.4 –1.6 –1.1 3.4 1.4 3.0
Commonwealth of Independent States 4.6 4.5 3.7 3.8 –0.7 –0.6 3.2 3.5 3.7
Russia 4.0 4.1 3.3 3.5 –0.8 –0.5 3.5 2.8 4.0
Excluding Russia 6.0 5.5 4.4 4.7 –0.7 –0.4 ... ... ...
Developing Asia 9.5 7.9 7.3 7.8 –0.7 –0.6 7.4 7.9 7.6
China 10.4 9.2 8.2 8.8 –0.8 –0.7 8.7 8.5 8.4
India 9.9 7.4 7.0 7.3 –0.5 –0.8 6.7 6.9 7.2
ASEAN-5 4 6.9 4.8 5.2 5.6 –0.4 –0.2 3.7 7.4 5.0
Latin America and the Caribbean 6.1 4.6 3.6 3.9 –0.4 –0.2 3.9 3.3 5.0
Brazil 7.5 2.9 3.0 4.0 –0.6 –0.2 2.1 3.8 4.1
Mexico 5.4 4.1 3.5 3.5 –0.1 –0.2 4.1 3.1 3.6
Middle East and North Africa (MENA) 5 4.3 3.1 3.2 3.6 ... ... ... ... ...
Sub-Saharan Africa 5.3 4.9 5.5 5.3 –0.3 –0.2 ... ... ...
South Africa 2.9 3.1 2.5 3.4 –1.1 –0.6 2.4 3.0 3.7
Memorandum
European Union 2.0 1.6 –0.1 1.2 –1.5 –0.7 0.8 0.3 1.7
World Growth Based on Market Exchange Rates 4.1 2.8 2.5 3.2 –0.7 –0.4 ... ... ...
World Trade Volume (goods and services) 12.7 6.9 3.8 5.4 –2.0 –1.0 ... ... ...
Imports
Advanced Economies 11.5 4.8 2.0 3.9 –2.0 –0.8 ... ... ...
Emerging and Developing Economies 15.0 11.3 7.1 7.7 –1.0 –1.0 ... ... ...
Exports
Advanced Economies 12.2 5.5 2.4 4.7 –2.8 –0.8 ... ... ...
Emerging and Developing Economies 13.8 9.0 6.1 7.0 –1.7 –1.6 ... ... ...
Commodity Prices (U.S. dollars)
Oil 6 27.9 31.9 –4.9 –3.6 –1.8 –3.1 ... ... ...
Nonfuel (average based on world commodity export weights) 26.3 17.7 –14.0 –1.7 –9.3 2.2 ... ... ...
Consumer Prices
Advanced Economies 1.6 2.7 1.6 1.3 0.2 –0.1 2.9 1.2 1.3
3
Emerging and Developing Economies 6.1 7.2 6.2 5.5 0.3 0.4 6.5 5.6 4.8
7
London Interbank Offered Rate (percent)
On U.S. Dollar Deposits 0.5 0.5 0.9 0.9 0.4 0.3 ... ... ...
On Euro Deposits 0.8 1.4 1.1 1.2 –0.1 –0.4 ... ... ...
On Japanese Yen Deposits 0.4 0.4 0.5 0.2 0.2 0.0 ... ... ...
Note: Real effective exchange rates are assumed to remain constant at the levels prevailing during November 14–December 12, 2011. When economies are not listed alphabetically, they are ordered
on the basis of economic size. The aggregated quarterly data are seasonally adjusted.
1
The quarterly estimates and projections account for 90 percent of the world purchasing-power-parity weights.
2
Excludes the G7 and euro area countries.
3
The quarterly estimates and projections account for approximately 80 percent of the emerging and developing economies.
4
Indonesia, Malaysia, Philippines, Thailand, and Vietnam.
5
The September 2011 WEO projections did not include Libya due to the uncertain political situation, but Libya is included in these aggregate WEO calculations. Excluding Libya, MENA growth
projections for 2012 and 2013 are lower by –1.6 and –1.2 percentage points, respectively, than in the September 2011 WEO. Note that the World and Emerging and Developing Economies aggregates
are also not directly comparable with those in the September 2011 WEO because of Libya’s inclusion, but Libya’s weight in these aggregates is much lower.
6
Simple average of prices of U.K. Brent, Dubai, and West Texas Intermediate crude oil. The average price of oil in U.S. dollars a barrel was $104.23 in 2011; the assumed price based on futures
markets is $99.09 in 2012 and $95.55 in 2013.
7
Six-month rate for the United States and Japan. Three-month rate for the euro area.
3. 3 WEO Update, January 2012
Figure 2. Recent Economic Indicators1 economies fell sharply. Currency markets were
volatile, as the Japanese yen appreciated and many
Quarterly World Growth Real Gross Fixed Investment
emerging market currencies depreciated
(percent; quarter over quarter,
8 annualized)
(annualized percent change from significantly.
preceding quarter) 20
6
10
4 Figure 3. Recent Financial Market Developments1
2 0
0 Advanced Government Bond Spreads
-10 2
economies3 (two-year yield spreads over Money Market Spreads
Sept. 2011
-2 Emerging German bunds, basis points) (basis points)
WEO forecast of which: -20
economies2 2500 Greece 20000 80 Euro LIBOR–OIS spread 800
-4 machinery (three-month forward;
4 (right scale)
and equipment -30 Ireland 70 left scale) 700
-6 2000 Portugal
16000 ECB deposit facility
Spain
60 600
-8 -40 (billions of euros; right
2007 08 09 10 11: 2007 08 09 10 11: Italy 50 scale) 500
1500 France 12000
Q3 Q3
40 400
1000 8000
Manufacturing Purchasing Merchandise Exports 30 300
Managers' Index (PMI) (percent; three-month moving
average (3mma) over previous 500 4000 20 200
65 (index) 80
Advanced 3mma, annualized) 10 100
60 economies3 Emerging 60 0 0
economies2 0 0
40 Jan. July Jan. July Jan. Jan. July Jan. July Jan.
55 11 12 11 12
10 10
20
50
Implied Volatility3 Equity Indices4
Emerging 0
45 (percent) (Jan. 1, 2010 = 100)
economies2 Advanced 50 125
World -20
economies3
40 120
-40
40 115
35 -60 110
U.S. (VIX)
30 -80 30 105
2007 08 09 10 Dec. 2007 08 09 10 Nov.
11 11 100
20 95
90
Sources: Haver Analytics; and IMF staff calculations. S&P 500
1Not all economies are included in the aggregations. Aggregates are computed on the 10 Euro First 300 85
basis of purchasing-power-parity (PPP) weights unless noted otherwise. Emerging Markets TOPIX
(VXY) 80
2 Argentina, Brazil, Bulgaria, Chile, China, Colombia, Estonia, Hungary, India, Indonesia, MSCI Emerging Markets
0 75
Latvia, Lithuania, Malaysia, Mexico, Pakistan, Peru, Philippines, Poland, Romania, Russia, Jan. July Jan. July Jan. Jan. July Jan. July Jan.
South Africa, Thailand, Turkey, Ukraine, and Venezuela. 10 11 12 10 11 12
3Australia, Canada, Czech Republic, Denmark, euro area, Hong Kong SAR, Israel, Japan,
Korea, New Zealand, Norway, Singapore, Sweden, Switzerland, Taiwan Province of China, Exchange Rate Indices5 Commodity Price Indices
United Kingdom, and United States. (Jan. 1, 2010 = 100) (Jan. 1, 2010 = 100)
4PPP-weighted averages of metal products and machinery for euro area, plants and 120 260
equipment for Japan, plants and machinery for the United Kingdom, and equipment and Crude oil (APSP)6 240
software for the United States. 110 Metals
Food 220
Raw materials
Gold 200
Lately, the near-term outlook has noticeably 100
180
deteriorated, as evidenced by worsening high- 90 160
frequency indicators in the last quarter of 2011 Euro
Yen
140
80 Renminbi 120
(Figure 2). The main reason is the escalating euro Swiss franc
Sterling 100
area crisis, which is interacting with financial 70
80
Jan. July Jan. July Jan. Jan. July Jan. July Jan.
fragilities elsewhere (Figure 3). Specifically, 10 11 12 10 11 12
concerns about banking sector losses and fiscal
Sources: Bloomberg Financial Markets; and IMF staff calculations.
sustainability widened sovereign spreads for many 1Vertical lines on each panel correspond to May 10 and November 30, 2010.
2 ECB = European Central Bank; LIBOR = London interbank offered rate; OIS = overnight
euro area countries, which reached highs not seen index swap.
3 VIX = Chicago Board Options Exchange Market Volatility Index, a measure of the implied
since the launch of the Economic and Monetary volatility of options on the S&P 500 index; VXY = JPMorgan emerging markets implied
Union. Bank funding all but dried up in the euro volatility index, a measure of the aggregate volatility in currency markets.
4 TOPIX = Tokyo stock price index; MSCI = emerging markets stock price index.
5
area, prompting the European Central Bank (ECB) 6
Bilateral exchange rates against the U.S. dollar (increase denotes depreciation).
APSP = average petroleum spot price.
to offer a three-year Long-Term Refinancing
Operation (LTRO). Bank lending conditions moved
sideways or deteriorated across a number of
advanced economies. Capital flows to emerging
4. 4 WEO Update, January 2012
The recovery is expected to stall in 5¾ percent—a significant slowdown from the
many economies 6¾ percent growth registered during 2010–11 and
about ½ percentage point lower than projected in
The updated WEO projections see global activity the September 2011 WEO. This reflects the
decelerating but not collapsing. Most advanced deterioration in the external environment, as well as
economies avoid falling back into a recession, the slowdown in domestic demand in key emerging
while activity in emerging and developing economies. Despite a substantial downward
economies slows from a high pace. However, this revision of ¾ percentage point, developing Asia is
is predicated on the assumption that in the euro still projected to grow most rapidly at 7½ percent
area, policymakers intensify efforts to address the on average during 2012–13. Economic activity in
crisis. As a result, sovereign bond premiums the Middle East and North Africa is expected to
stabilize near current levels and start to normalize accelerate in 2012-13, driven mainly by the
in early 2013. Also, policies succeed in limiting recovery in Libya and the continued strong
deleveraging by euro area banks. Credit and performance of other oil exporters. But most oil-
importing countries in the region face muted
investment in the euro area contract only modestly,
with limited financial and trade spillovers to other growth prospects due to longer-than-expected
political transitions and an adverse external
regions.
environment. The impact of the global slowdown
Overall, activity in the advanced economies is now on sub-Saharan Africa has to date been limited to a
projected to expand by 1½ percent on average few countries—most notably, South Africa—and
during 2012–13. Given the depth of the 2009 the region's output is expected to expand by around
recession, these growth rates are too sluggish to 5½ percent in 2012. The adverse spillover effects
make a major dent in very high unemployment. are expected to be largest for central and eastern
Moreover, the 2012 growth projection is a Europe, given the region’s strong trade and
downward revision of ¾ percentage points relative financial linkages with the euro area economies.
to the September 2011 WEO. The impact on other regions is expected to be
relatively mild, as macroeconomic policy easing is
The euro area economy is now expected to go expected to largely offset the effects of slowing
into a mild recession in 2012––consistent with demand from advanced economies and rising
what was presented as a downside scenario in global risk aversion. For many emerging and
the January 2011 WEO Update. The significant developing economies, the strength of the forecasts
downward revision (1½ percentage points) also reflects relatively high commodity prices (see
since the September 2011 WEO is due to the below).
rise in sovereign yields, the effects of bank
deleveraging on the real economy, and the Commodity prices and consumer price
impact of additional fiscal consolidation inflation recede, but risks remain
announced by euro area governments.
Commodity prices generally declined in 2011, in
With only limited policy room, growth in most response to weaker global demand. Oil prices,
other advanced economies is also lower, mainly however, have held up in recent months, largely
due to adverse spillovers from the euro area via because of supply developments. Moreover,
trade and financial channels that exacerbate the geopolitical risks to oil prices have risen again.
effects of existing weaknesses. For the United These risks are expected to remain elevated for
States, the growth impact of such spillovers is some time, and oil prices will ease only marginally
broadly offset by stronger underlying domestic in 2012 despite less favorable prospects for global
demand dynamics in 2012. Nonetheless, activity. As a result, the IMF’s baseline petroleum
activity slows from the pace reached during the price projection for 2012 is broadly unchanged
second half of 2011, as higher risk aversion since the September 2011 WEO ($99 a barrel
tightens financial conditions and fiscal policy compared with $100). For non-oil commodities,
turns more contractionary. improving supply conditions and slowing global
demand are expected to cause further price
During 2012–13, growth in emerging and declines. Non-oil commodity prices are projected to
developing economies is expected to average fall by 14 percent in 2012. In the near term, the
5. 5 WEO Update, January 2012
risks to prices are to the downside for most of these Figure 4. WEO Downside Scenario
(Percent deviation from WEO baseline)
commodities.
Real GDP
Global consumer price inflation is projected to ease 0
as demand softens and commodity prices stabilize
or recede. In advanced economies, ample economic -1
World
slack and well-anchored inflation expectations will -2
keep inflation pressures subdued, as the effects of
last year’s higher commodity prices wane. Inflation Euro area -3
is projected to fall to about 1½ percent in the course
-4
of this year, down from a peak of about 2¾ percent
in 2011. In emerging and developing economies, 2011: 12: 13: 14: 15: 16:
-5
pressures are also expected to drop, as both growth Q4 Q4 Q4 Q4 Q4 Q4
and food price inflation slow. However, inflation is
Source: Global Projection Model (GPM) simulations.
expected to remain persistent in some regions.
Overall, consumer prices in these economies are Another downside risk arises from insufficient
projected to decelerate, with inflation around progress in developing medium-term fiscal
6¼ percent during 2012, down from over consolidation plans in the United States and Japan.
7¼ percent in 2011. In the short term, this risk might be mitigated as the
turbulence in the euro area makes government debt
Downside risks have risen sharply of these economies more attractive to investors.
However, as long as public debt levels are
Downside risks stem from several sources. The projected to rise over the medium term, and in the
most immediate risk is intensification of the absence of well-defined and credible fiscal
adverse feedback loops between sovereign and consolidation strategies, there is the possibility of
bank funding pressures in the euro area, resulting in turmoil in global bond and currency markets. A
much larger and more protracted bank deleveraging more immediate risk is that an accident-prone
and sizable contractions in credit and output. Figure political economy will lead to excessive fiscal
4 presents such a downside scenario. It assumes tightening in the near term in the United States.
that sovereign spreads temporarily rise. Increased
concerns about fiscal sustainability force a more In key emerging economies, risks relate to the
front-loaded fiscal consolidation, which depresses possibility of a hard landing, especially in the
near-term demand and growth. Bank asset quality context of uncertain (possibly slowing) potential
deteriorates by more than in the baseline, owing to output. In recent years, a number of major
higher losses on sovereign debt holdings and on emerging economies experienced buoyant credit
loans to the private sector. Private investment and asset price growth as well as rising financial
contracts by additional 1¾ percentage points of vulnerabilities. This has buoyed demand and may
GDP (relative to WEO projections). As a result, have led to overestimation of the trend growth rates
euro area output is reduced by about 4 percent in these economies. Should the dynamics of real
relative to the WEO forecast. Assuming that estate and credit markets unwind—triggered by
financial contagion to the rest of the world is more losses in confidence and a paring back of
intense than in the baseline (but weaker than expectations at home or by falling demand from
following the collapse of Lehman Brothers in 2008) abroad—the impact on economic activity could be
and taking into consideration spillovers via very damaging.
international trade, global output will be lower than
the WEO projections by about 2 percent. Moreover, concerns about geopolitical oil supply
risks are increasing again. The oil market impact of
intensified concerns about an Iran-related oil
supply shock (or an actual disruption) would be
large, given limited inventory and spare capacity
buffers, as well as the still-tight physical market
conditions expected throughout 2012.
6. 6 WEO Update, January 2012
Decisive and consistent policy action is growth, and job creation. Fiscal policies are
urgently needed discussed in more detail in the January 2012
Fiscal Monitor Update.
The current environment—characterized by fragile
financial systems, high public deficits and debt, and Liquidity. While fiscal consolidation proceeds
interest rates close to the zero bound—provides in the advanced economies, monetary policy
fertile ground for self-perpetuating pessimism and should continue to support growth, as long as
the propagation of adverse shocks, the most critical inflation expectations remain anchored and
of which is a worsening of the crisis in the euro unemployment stays high. If downside risks to
area. In this setting, there are three requirements for growth materialize, further monetary
a more resilient recovery: sustained but gradual stimulus—including through quantitative
adjustment; ample liquidity and easy monetary easing—may well be necessary. In this regard,
policy, mainly in advanced economies; and restored targeted programs to help ease credit
confidence in policymakers’ ability to act. constraints on businesses and households would
Importantly, not all countries should adjust in the be useful in economies where monetary
same way, to the same extent, or at the same time, transmission is impaired. In the euro area, it is
lest their efforts become self-defeating. Countries critical to break the adverse feedback loops
with relatively strong fiscal and external positions, between subpar growth, deteriorating fiscal
for example, should not adjust to the same extent as positions, and weakening bank balance sheets,
countries lacking those strengths or facing market which may very well lead to a prolonged period
pressures. Through mutually consistent actions, of asset and consumer price deflation.
policymakers can help anchor expectations and Addressing this requires action on several
reestablish confidence. fronts. First, additional and timely monetary
easing by the ECB will be important, consistent
with its mandate to ensure stable prices. Also,
Fiscal adjustment. In the near term, sufficient
fiscal adjustment is in motion in most advanced the ECB should continue to provide liquidity
economies. Countries should let automatic and stay fully engaged in securities purchases
to help maintain confidence in the euro. And
stabilizers operate freely for as long as they can
readily finance higher deficits. Among those sufficient funding must be made available
countries, those with very low interest rates or through the European Financial Stability
other factors that create adequate fiscal space, Facility (EFSF) and the European Stability
including some in the euro area, should Mechanism (ESM) to countries facing severe
reconsider the pace of near-term fiscal funding constraints.
consolidation. Overdoing fiscal adjustment in
the short term to counter cyclical revenue losses Bank deleveraging. To break the adverse loops
will further undercut activity, diminish popular between weak growth and deteriorating bank
support for adjustment, and undermine market balance sheets, more capital needs to be
confidence. Among the major economies, a injected into the euro area banks (including
specific concern is that political paralysis in the from public sources) and supervisors must do
United States will lead to an excessively rapid whatever possible to avoid excessively fast
unwinding of stimulus spending. Regarding the deleveraging that could lead to a devastating
medium term, the United States and Japan credit crunch (see the January 2012 Global
should push ahead in formulating and Financial Stability Report Update). Individual
implementing credible medium-term countries under pressure may well require
consolidation plans, because neither country recourse to euro-wide resources to facilitate
can take for granted its status as a safe haven. bank recapitalization.
Measures could include reforms to slow the
growth of health care and pension spending, Financial adjustment. Easy funding in the
caps on discretionary spending, and tax system short-term must be coupled with continued
reforms to boost fiscal revenue. Putting in place progress to repair and reform financial systems.
credible medium-term plans also will create This is a critical element of normalizing credit
policy room to support balance sheet repair, conditions and would help reduce the burden on
monetary and fiscal policy of supporting the
7. 7 WEO Update, January 2012
recovery. Financial sector policies are that suffer from both relatively high inflation and
discussed in more detail in the January 2012 public debt (including India and various economies
Global Financial Stability Report Update. in the Middle East) may need to take a more
cautious stance on any policy easing.
Restoring confidence in the viability of the euro
area hinges on deepening financial and fiscal Figure 5. Net Fund Flows to Emerging Markets
integration over time and on implementing (Billions of U.S. dollars; weekly flows)
structural reforms to help resolve internal
imbalances. On the financial front, moving toward 8 Bond fund flows 2
(right scale)
a model of common supervision, resolution, and 4 1
deposit insurance will strengthen and unify the euro
0 0
area financial system and break the adverse
feedback loops between banks and sovereigns. In -4 -1
the near term, a pan-euro area facility that has the -8 Equity fund flows -2
capacity to take direct stakes in banks will also help (left scale)
-12 -3
break these loops. Further fiscal integration is also
essential and must include more risk sharing across -16
Jan. Apr. Jul. Oct. Jan. Apr. Jul. Oct.
-4
Jan.
euro area members, alongside stronger fiscal 10 11 12
discipline or centralization. The EFSF and ESM are
major steps in this direction. But adding substantial Source: EPFR Global.
real resources to what is currently available, by
folding the EFSF into the ESM and increasing the Collective action can help set the global economy
size of the ESM, would help greatly. In the medium on a more robust growth trajectory by fostering
term, reforms to labor and product markets will global demand rebalancing. In many advanced
help address underlying internal imbalances and economies, notably those with external deficits, the
competitiveness problems, which are the root deleveraging of households is set to continue for
causes of the travails; in the short term, they may some time. Structural reforms to boost potential
help anchor market expectations. output––including measures to reform labor and
product markets and strengthen economies’
In emerging and developing economies, the near-
resilience to population aging––can lower but not
term focus should be on responding to moderating
obviate the need for deleveraging. Achieving more
domestic demand and slowing external demand
resilient global growth in this setting will require
from advanced economies, while dealing with
that economies with strong household balance
volatile capital flows. The specific conditions
sheets and external positions eliminate distortions
facing these economies and the policy room
that weigh on domestic demand. Depending on the
available to them vary widely, and so will the
precise challenges facing these economies, actions
appropriate policy response. In general, inflation
could usefully focus on building more market-
pressures have eased, credit growth has peaked, and
oriented exchange systems, improving social safety
capital inflows have diminished (Figure 5).
nets and pension, health care, and education
Economies where inflation is under control, public
systems; strengthening financial sectors; and
debt is not high, and external surpluses are
improving the business environment for private
appreciable (including China and selected emerging
investment.
economies in Asia) can afford to deploy additional
social spending to support poorer households in the
face of weakening external demand. Economies
with diminishing inflation pressure but weaker
fiscal fundamentals (including various economies
in Latin America) can afford to stop tightening or
to ease monetary policy, provided they manage to
control lending to overheating sectors (such as real
estate) through macroprudential measures. Those