1. See each paragraph for specific
data measurement period
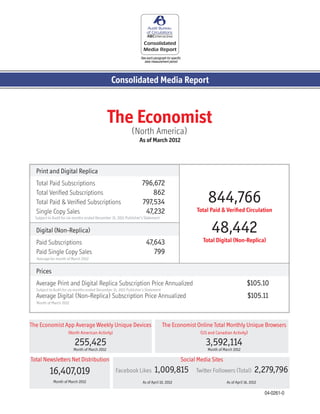
Consolidated Media Report
The Economist
(North America)
As of March 2012
Print and Digital Replica
Total Paid Subscriptions 796,672
Total Verified Subscriptions
Total Paid & Verified Subscriptions
862
797,534 844,766
Single Copy Sales 47,232 Total Paid & Verified Circulation
Subject to Audit for six months ended December 31, 2011 Publisher’s Statement
Digital (Non-Replica) 48,442
Paid Subscriptions 47,643 Total Digital (Non-Replica)
Paid Single Copy Sales 799
Average for month of March 2012
Prices
Average Print and Digital Replica Subscription Price Annualized $105.10
Subject to Audit for six months ended December 31, 2011 Publisher’s Statement
Average Digital (Non-Replica) Subscription Price Annualized $105.11
Month of March 2012
The Economist App Average Weekly Unique Devices The Economist Online Total Monthly Unique Browsers
(North American Activity) (US and Canadian Activity)
255,425 3,592,114
Month of March 2012 Month of March 2012
Total Newsletters Net Distribution Social Media Sites
16,407,019 Facebook Likes 1,009,815 Twitter Followers (Total) 2,279,796
Month of March 2012 As of April 10, 2012 As of April 16, 2012
04-0261-0
2. Consolidated Media Report
Product Average For Period
The Economist App
(North American Activity) Average Weekly Unique Devices 255,425
Month of March 2012
The Economist Online
(US and Canadian Activity) Total Monthly Unique Browsers 3,592,114
Total Visits 6,622,142
Total Page Impressions 14,914,663
Average Visit Duration 9 minutes 4 seconds
Month of March 2012
Newsletters
Total Net Distribution 16,407,019
Total Unique Opens 2,261,595
Unique Open Rate 13.8%
Month of March 2012
Social Media Sites
Facebook Likes 1,009,815
Twitter Followers (Total) 2,279,796
LinkedIn Group Members 23,003
Google+ Circle Members 502,118
Tumblr Followers 43,007
As of April 10, 2012 for all, except Twitter Followers (Total) as of April 16, 2012
The World In 2012
The World In Platform Print Circulation 770,764
App Downloads 129,615
Paid Circulation - Six months ended December 31, 2011 Publisher’s Statement.
App Downloads - from November 18, 2011 through March 31, 2012.
The Economist (North American Edition), New York, NY, Page #2
3. Consolidated Media Report
The Economist Magazine
The Economist was established in 1843, to take part in “a severe
contest between intelligence, which presses forward, and unworthy,
timid ignorance obstructing our progress.” Today, The Economist
acts as a compass for Ideas People, as they look for guidance in an
increasingly topsy-turvy international world.
Print and Digital Replica
950,000
900,000
Circulation
850,000
800,000
Rate Base
750,000
700,000
650,000
600,000
Jul
y
gust mb
er
tob
er be
r
be
r
Au te Oc vem cem
Sep No De
Subject to Audit for six months ended December 31, 2011 Publisher’s Statement
The Economist App
(North American Activity)
The Economist App replicates the lean-back, immersive experience that readers get in
print. Readers are able to authenticate their existing print subscription, purchase a digital
subscription, buy single copies or read the free editor’s highlights. Although the editorial
is the same as the printed edition, the advertising is sold separately, and the iPad version
provides the ability for interactive features.
The Economist App
(North American Activity)
Total Unique Devices
255,425
Month of March 2012
The Economist (North American Edition), New York, NY, Page #3
4. Consolidated Media Report
The Economist Online
(US and Canadian Activity)
The Economist Online is the home of intelligent analysis, discussion and debate.
Completely redesigned in 2010, the site contains the complete print edition (behind
a pay barrier); channels on politics, business, science & technology, and culture;
and 20+ editorial blogs. To engage our audience of Ideas People there is a series of
online debates, a bi-weekly poll on What the World Thinks, and Conversation Cloud
so users can easily find the topics of discussion that interest them.
The Economist Online
(US and Canadian Activity)
Total Monthly Unique Browsers Total Page Impressions
3,592,114 14,914,663
Month of March 2012
Newsletters
The Economist Online provides registered users a selection of newsletters highlight-
ing content on the site. From business (The World this Week: Business & Management
Thinking) to Politics (The World this Week: Politics), from travel (Gulliver’s Best)
to everything in-between (Editor’s Highlights & New on The Economist online) our
readers are able to access insight on the world’s most pressing issues.
Newsletters
Total Net Distribution Total Unique Opens Unique Open Rate
16,407,019 2,261,595 13.8%
Month of March 2012
The Economist (North American Edition), New York, NY, Page #4
5. Consolidated Media Report
Social Media
The Economist’s success in print and digital is matched by its reach
across social platforms.
Social Media
Facebook Likes Twitter Followers (Total) LinkedIn Group Members
1,009,815 2,279,796 23,003
Google+ Circle Members Tumblr Followers
502,118 43,007
As of April 10, 2012 for all, except Twitter Followers (Total) as of April 16, 2012
The World In 2012
The World in 2012 is the latest in a series of annual predictions that
identifies and explores the issues shaping the year ahead. A delightful
mixture of analysis and wit, this platform combines content from Economist
journalists and guest writers, with engaging interactive elements.
The World In Platform
Print Circulation App Downloads
770,764 129,615
Print Circulation - Subject to Audit, six months ended December 31, 2011 Publisher’s Statement. App Downloads - from November 18, 2011 through March 31, 2012.
The Economist (North American Edition), New York, NY, Page #5
6. Consolidated Media Report
Explanatory
The Economist Magazine:
Field Served: International journal of news and opinion, covering aspects of public life, finance, business, economics, politics, world affairs and science and technology.
Published by The Economist Newspaper Limited
Issues in this report period: 26 (six months ended December 31, 2011)
DESCRIPTION OF DIGITAL (Replica) - The Digital (Replica) Edition is an exact replica of the print product in format and advertising content. The Digital Edition is available at www.zinio.com and www.barnesandnoble.com
(Nook) and www.amazon.com (Kindle Fire). Digital (Non-Replica) - The Digital (Non-Replica) edition carried different editorial content of the print edition. Advertising for this edition was sold specifically for the non-replica
edition.
For additional circulation information, see the December 2011 ABC Publisher’s Statement for The Economist (North American Edition)
(ABC member number 04-0261-0)
Total Print and Digital Replica Circulation for the six month period ended December 31, 2011
(Excluding special issue “The World in 2012”)
Total Total Total
Total Paid & Total Paid & Total Paid &
Paid & Verified Circ. Total Paid & Verified Circ. Total Paid & Verified Circ. Total
Verified Circ. Digital Paid & Verified Circ. Digital Paid & Verified Circ. Digital Paid &
Issue Print (Replica) Verified Circ. Issue Print (Replica) Verified Circ. Issue Print (Replica) Verified Circ.
July 2 825,095 5,551 830,646 Sept. 3 819,161 5,589 824,750 Nov. 5 817,598 4,982 822,580
9 847,558 5,646 853,204 10 831,971 5,699 837,670 12 829,534 5,002 834,536
16 838,317 5,797 844,114 17 832,128 5,736 837,864 19 838,898 5,119 844,017
23 841,227 5,831 847,058 24 840,727 5,842 846,569 26 847,190 5,134 852,324
30 847,903 5,917 853,820 Oct. 1 825,065 5,345 830,410 Dec. 3 825,765 5,230 830,995
Aug. 6 813,359 5,758 819,117 8 844,431 5,848 850,279 10 836,984 5,410 842,394
13 834,000 5,815 839,815 15 827,322 5,394 832,716 17 930,265 5,909 936,174
20 836,337 5,864 842,201 22 840,689 5,413 846,102 31 866,925 5,584 872,509
27 835,252 5,910 841,162 29 845,467 5,403 850,870
Digital Non-Replica:
For the Month of March 2012
Audited Circulation
Total
Paid Paid Digital
Subscriptions Single Copy (Non-Replica)
March 3 45,928 679 46,607
10 46,187 680 46,867
17 46,530 732 47,262
24 49,457 835 50,292
31 50,115 1,069 51,184
Prices:
Average Print and Digital (Replica) subscription price as reported on the six months ended December 31, 2011 Publisher’s Statement.
Average Digital (Non-Replica) Subscription Price Annualized Period Audited: Month of March 2012
Represents average annualized price of subscriptions sold during month of March 2012.
The Economist App:
App Usage reported is for devices accessing one of The Economist Apps from North American IP addresses only.
Included in the App Usage report are the following versions of The Economist Apps: Economist Android, Economist iPad Live, Economist iPad Live 1.3, Economist iPhone, iPad Asia Pacific, iPad Central and South Americas,
iPad Continental Europe, iPad Middle East and Africa, iPad North America, iPad United Kingdom, iPhone Asia Pacific, iPhone Central and South Americas, iPhone Continental Europe, iPhone Live 1.1, iPhone Middle East and
Africa, iPhone North America, and iPhone United Kingdom.
Weekly Usage by Platform:
Week Ended Android iPad iPhone Totals
March 4, 2012 87,329 90,198 90,043 267,570
March 11, 2012 86,914 80,127 81,967 249,008
March 18, 2012 84,745 88,966 79,128 252,839
March 25, 2012 83,544 90,281 78,457 252,282
Weekly Average 85,633 87,393 82,399 255,425
Definitions
App Unique Device : Any unique device that has accessed an App during the period stated. App unique browsers may use consistent/persistent identifiers that are wholly or partially based on identifiers (e.g. UDID) and passed
to the App by the device.
The Economist Online:
Website Usage reported is for those browsers accessing The Economist website (as defined below) from U.S. and Canadian IP addresses only.
Domains included in web activity : www.economist.com, jobs.economist.com, www.store.economist.com, and economistsquares.economist.com.
The average visit duration calculation excludes 4,395,000 visits for which the duration could not be measured due to only one request during a particular browser session.
Definitions
Page Impressions: The combination of one or more files presented to a viewer as a single document as a result of a single request received by the server.
Unique Browser: A unique and valid identifier. Sites may use (i) IP+User-Agent and/or (ii) Cookie. This metric measures each browser; it does not measure a person. Counting of unique browsers may overstate or understate
the number of individual devices concerned due to factors such as dynamic IP address allocation, significant levels of uniformity in IP and browser combinations operating through a proxy, cookie blocking and deletion.
Visit: A series of interactions by a visitor with a site without 30 consecutive minutes of inactivity.
Internal Page Impressions: Website activity that is generated by individuals with IP addresses known to be associated with the website. This activity is excluded from the report.
Nonqualifying Activity: Unsuccessful transfers of requested documents, as well as successful transfers of requested documents where evidence suggests that browsers were not in use (i.e. a human was not viewing the page
at the time of the request), are both considered nonqualifying and have been deducted from the report.
The Economist (North American Edition), New York, NY, Page #6