
Recommandé
Contenu connexe
Tendances
Tendances (20)
Similaire à Quality Accomplishments - Jun Rigonan
Similaire à Quality Accomplishments - Jun Rigonan (20)
Quality Accomplishments - Jun Rigonan
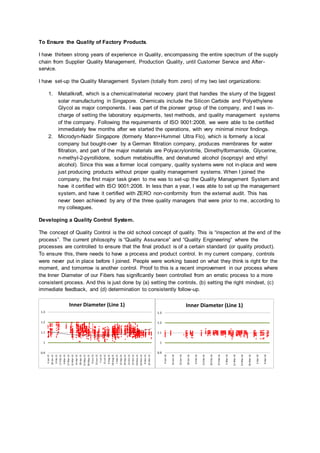
- 1. To Ensure the Quality of Factory Products. I have thirteen strong years of experience in Quality, encompassing the entire spectrum of the supply chain from Supplier Quality Management, Production Quality, until Customer Service and After- service. I have set-up the Quality Management System (totally from zero) of my two last organizations: 1. Metallkraft, which is a chemical/material recovery plant that handles the slurry of the biggest solar manufacturing in Singapore. Chemicals include the Silicon Carbide and Polyethylene Glycol as major components. I was part of the pioneer group of the company, and I was in- charge of setting the laboratory equipments, test methods, and quality management systems of the company. Following the requirements of ISO 9001:2008, we were able to be certified immediately few months after we started the operations, with very minimal minor findings. 2. Microdyn-Nadir Singapore (formerly Mann+Hummel Ultra Flo), which is formerly a local company but bought-over by a German filtration company, produces membranes for water filtration, and part of the major materials are Polyacrylonitrile, Dimethylformamide, Glycerine, n-methyl-2-pyrollidone, sodium metabisulfite, and denatured alcohol (isopropyl and ethyl alcohol). Since this was a former local company, quality systems were not in-place and were just producing products without proper quality management systems. When I joined the company, the first major task given to me was to set-up the Quality Management System and have it certified with ISO 9001:2008. In less than a year, I was able to set up the management system, and have it certified with ZERO non-conformity from the external audit. This has never been achieved by any of the three quality managers that were prior to me, according to my colleagues. Developing a Quality Control System. The concept of Quality Control is the old school concept of quality. This is “inspection at the end of the process”. The current philosophy is “Quality Assurance” and “Quality Engineering” where the processes are controlled to ensure that the final product is of a certain standard (or quality product). To ensure this, there needs to have a process and product control. In my current company, controls were never put in place before I joined. People were working based on what they think is right for the moment, and tomorrow is another control. Proof to this is a recent improvement in our process where the Inner Diameter of our Fibers has significantly been controlled from an erratic process to a more consistent process. And this is just done by (a) setting the controls, (b) setting the right mindset, (c) immediate feedback, and (d) determination to consistently follow-up. 0.9 1 1.1 1.2 1.3 6-Jan-15 20-Jan-15 3-Feb-15 17-Feb-15 3-Mar-15 17-Mar-15 31-Mar-15 14-Apr-15 28-Apr-15 12-May-15 26-May-15 9-Jun-15 23-Jun-15 7-Jul-15 21-Jul-15 4-Aug-15 18-Aug-15 1-Sep-15 15-Sep-15 29-Sep-15 13-Oct-15 27-Oct-15 10-Nov-15 24-Nov-15 8-Dec-15 22-Dec-15 Inner Diameter (Line 1) 0.9 1 1.1 1.2 1.3 9-Jan-16 16-Jan-16 23-Jan-16 30-Jan-16 6-Feb-16 13-Feb-16 20-Feb-16 27-Feb-16 5-Mar-16 12-Mar-16 19-Mar-16 26-Mar-16 2-Apr-16 9-Apr-16 Inner Diameter (Line 1)
- 2. Customer Complaints are now being tracked and has significantly improved in numbers over the years. And this is because of a more controlled production and quality processes. Over the past years, I have implemented major controls in the processes that includes the Control Plans, Control of Non-Conforming Materials and Products, Deviation Permits, Management of Change, and Corrective and Preventive Actions. These made a significant improvement in ensuring consistency and reliability of products produced. I am also in-charge of the laboratory in setting up methods that would help improve the controls in our process such as a simple Refractive Index as an indirect measurement to the concentration of preservatives in production, thus it does not need to have one day waiting time if the concentrations are in control or not. The rest of the equipments in the lab were purchased and recommended by me such as the microscopes for ID and OD measurements, tensile strength using UTMs, and viscometers to measure viscosity of dope. Previously, everything was done using in-house equipments by previous owner of the company. Key Performance Indicators Factory Right First Time – we have started to implement this last year by tracking the first-pass quality of our products. The numbers are still high, but we have plans of reducing it, with the help of RnD. This is one of the major improvements of this year which the company had to invest a new raw material and new plant to make the final product more consistent. Rejects Management – both materials and products are being tracked on rejection rate, with KPIs in place (ie %Wastes, Number of Non-Conforming Products, Number of Supplier Rejections) Scrap Rates – in 2015, the scrap rates were high, but has improved significantly in 2016 due to the controls in place. Moreover, a daily meeting was implemented to ensure daily feedback. 2013 2014 2015 2016 (YTD) 52 48 24 6 Valid Complaints
- 3. Product Returns – there was only one product return in 2014. After improvements were made, we had zero customer-charge back or product returns. Claims Review – these are crossfunctional activity headed by myself that handles any claim from a customer whilst getting feedback and informations from Production, RnD and Technical Team. This is organized through a Complaint Review session. I have a strong background in statistics which helps me to do proper assessment on the capability of the processes. This complements by Chemical Engineering background to have a better understanding on these chemical-related industries which I am with right now and previously. All of these improvements cannot be done without the cooperation of all cross-functional areas and departments, as well as the perseverance of the QA department to follow-up actions. Should you need references to confirm the informations above, I can provide an attested copies of the data above or a letter of confirmation or recommendations if needed. Thank you. 1.81% 6.84% 2.35% 3.94% 2.61% 1.34% 11.71% 0.96% 2.09% 0.71% 1.49% 2.33% 1.55% 0.35% 0.52% COST OF NON-QUALITY (KPI: <= 1.02%)