SlideShare une entreprise Scribd logo
1  sur  8
DETAILED LESSON PLAN FOR DEMO TEACHING
Grade 7 (Mathematics)
Learning Competency: Calculates the measures of variability of grouped and ungroup
data.
I. OBJECTIVES
At the end of the lesson, the students will be able to:
 Identify the measures of variability of grouped and ungroup data.
 Link the concept of measures of variability in real life context.
 Solve the measures of variability of grouped and ungrouped data.
II. SUBJECT MATTER
Topic: Measures of Varibility of Grouped and Ungrouped data.
Reference: Mathematics Module 7
Materials: Laptop, LCD Projector, Chalk, Activity Materials
III. INSTRUCTIONAL PROCEDURE
Teacher’s Activity Students’ Activity
A. Daily Routine
1. Prayer
Class let’s all stand up.
Before we start, ___________ will
lead the prayer.
2. Greetings
Good Morning/ Good Afternoon
class.
Hi everyone, I am Junila A. Tejada
Ma’am “June” in short and a
graduate of BSED- Math. I am
hoping for your outmost
cooperation for todays lesson in
order to make our lesson a
success. Is that a deal class?
3. Checking of Attendance
Is everybody present today?
4. Setting Expectation
The teacher will present the
lesson objectives.
B. Priming / Activating Prior Knowlegde
1. Class, using your understanding of
the concept of the “measures of
central tendency”. Given the
data below, find the mean of the data.
A student will lead the prayer.
Dear God, …….. Amen.
Good Morning/ Good Afternoon
Ma’am.
Yes ma’am, deal.
Yes ma’am, everybody is present
today.
SET A:
4, 10, 12, 20, 24
SET B:
12, 13, 14, 15, 16
What is the mean for set A? How
about for set B?
2. Review
Based from the number line class,
which set has a long line? How
about short?
Very Good. The line represent the
spread of the data and it shows that
Set A is more spread than Set B.
Does the set of data in our activity
can be considered as grouped or
ungrouped data? Why?
Very Good. Grouped data are set of
data that are categorize and arrange
in a form of data while the
ungrouped data are data that are
raw and not yet classified.
C. Lesson Development
1. Motivation/ Activity
Class, are you familiar with the term
“measures of variability”?
In our drill earlier, we compare the
distance of spread of set A, and set
B right? That process is a way of
knowing the spread of the data and
determining the consistency of data
which is the core of the measures of
variability,
To learn more about the measures
variability and its’ types we will
conduct an activity.
Are you ready?
Let’s us start our activity entitled
“Connectiword”. The class will be
divided into six groups, each group
will select their group leader. The
activity is for only 5 minutes. Once
the time is done, the students will
submit their work. In the activity, the
students will arrange the shuffled
words by sequencing the clues
indicated below the letter. Each group
will select a representative that will
The mean for set A ma’am is 14, while in
Set B it is also 14.
The set that has long line is Set A ma’am
while the short line is Set B.
It is ungrouped data ma’am because the
data are not in table.
The set of data is considered ungrouped
ma’am.
Students’ answers may vary.
Yes we are ready.
Yes ma’am.
pick the words to be arrange and a
representative to recite the sequence
that they created.
Number 1:
Number 2:
Number 3:
Number 4:
Number 5:
Number 6:
2. Analysis
What did we do in our activity?
Correct. What is the word for
number 1?
Kindly recite the description on each
letter.
The students will answer:
We were tasked to arrange the letters
base on the clues below the letter ma’am.
The word ma’am is RANGE.
A student will recite the steps in each
letters.
Very Good. In order to find the spread
of the scores of Mel, what did she
discover?
Exactly. The dicovery of Mel is the
definition of range which we will?
Very Good. What will be the range of
the scores? Which set has less
spread?
Excellent. Therefore, the scores in
Math class is more consistent and
closer together.
The formula above is applicable for
grouped data. For group data, we will
first get the upper boundary of the
highest score and the lower boundary
of the lowest score.
What is the lowest score? What is the
lowest boundary? The highest score
and highest boundary?
After identifying the lowest and
highest Boundary, simply subtract the
highest To the lowest boundary. So
the range is?
What if the two sets of data have the
same range? Is there other
way to compute the spread of the
data? Let us find out later.
What is the answer for the shuffled
letter no. 2? Kindly recite the
description below the letters.
What did Joy find first?
What is the mean?
In subtracting the individual scores to
the mean why it is important to get its
absolute value?
In mean deviation, we are concerned
with the distance of the individual scores
from the mean and there is no negative
distance so we make sure to get is
absolute value. So, if we will solve the
mean deviation, we will create a table:
She subtract the lowest score from the
highest score ma’am.
We will subtract the lowest score from the
highest ma’am.
The range of her score in Math is 5, while
8 in English ma’am. So the scores in math
is less spread.
The lowest score ma’am is 11 and the
lowest boundary is 10.5, while the highest
score is 22 and the highest boundary is
22.5.
The range is 12 ma’am.
Students’ answer may vary.
The answer ma’am is MEAN DEVIATION.
A student will recite the steps below the
letters.
The mean ma’am.
The mean is 25 ma’am.
The students’ answer may vary.
What will do next?
Very Good. So our mean deviation is?
Now, let us focus on number 3, what is
the word?
In the letter V, it indicates that it is a raw
score, is data grouped or ungrouped?
Correct. Kindly recite the description
below the letter.
Very Good. What is the first step of
Veronica in finding the spread of her
scores?
After she find the difference of the mean
and the individual score, what did she do
with the result?
So if we will get the variance, we will
create a table.
What is the summation of the squared
over the number of terms?
Very Good. Now what is the word for
number 5?
Please recite the description below the
letters.
What are your observation from the
description recited?
Exactly. Standard deviation (SD) is the
squareroot of the variance, so the SD is?
Now, we will proceed on the next word.
What is the word for number 5?
Okay. Kindly recite description below the
letters.
What is the first step?
We will add the all the result and divide the
number of terms.
The mean deviation ma’am is 10.
The word ma’am is VARIANCE.
It is ungrouped data ma’am.
A student will recite the steps below the
letter.
She first determines the mean ma’am.
She squares the result ma’am.
The variance is equal to 5.
The word is STANDARD DEVIATION
ma’am.
A student will recite the steps below the
letter.
It is almost the same with variance ma’am
but the standard deviation has square root.
The standard deviation is 2.24.
The word for number 5 ma’am is
VARIANCE.
A student will recite the steps below the
letter.
We need to find the class mark ma’am.
How can we find the class mark?
Very Good. Now we will create a table.
What is the summation of the f(x-
mean)^2?
Using the formula, what is our variance?
What do you think is difference of this
variance from the variance presented
earlier?
Very good. The formula earlier is for
finding the variance for ungrouped data
while this is the formula for finding the
variance of grouped data.
Now, we will reveal the last word. What is
the word?
Kindly recite the description underneath
the letters.
Do you have any observation?
Very Good. In finding the standard
Deviation of grouped data follow the
Steps in finding the variance and find its
squareroot.
3. Abstraction
The terms that you discovered are the
different measures of spread or
measures of variability. Again, what is
the purpose of measure of variability?
Very good. Always remember that the
lesser the variability, the more
consistent the scores and the data.
Now, what are the measures of
variability for ungrouped data and
grouped data?
4. Application
By adding the two interval and dividing it
by the number of terms.
The summation ma’am is 420.
The variance is 14.48 ma’am.
The difference ma’am is that the data
earlier are raw score while the data now
contains interval and frequency.
The word ma’am is STANDARD
DEVIATION.
A student will recite the steps below the
letter.
Yes ma’am. It is same with the steps in
variance but final answer will be in square
root.
The measures of variability allows us to
know how spread our scores/ data ma’am.
The measures of variability for ungrouped
and grouped data ma’am are range, mean
deviation, variance, and standard
deviation.
Now that you know the measures of
varibility of grouped and ungrouped
data, we will be having a group activity. I
will divide you into two groups. Each
group will select their group leaders. The
leader will be the one who is responsible
for dividing the task among the members
of the group.
Each group will be given a pen and a
manila paper that consists of tables the
goal of the group is to complete the table
and answer the given questions. The
activity will only cover 15 minutes of the
time.
1. Complete the table below and find the:
1.1 Standard Deviation
1.2 Variance
1.3 Range
2. Complete the table below and find the:
2.1 Variance
2.2 Standard deviation
The students will answer the ff:
The students will answer.
IV. Evaluation
Class, write TRUE if the statement is
true and FALSE if the statement is false.
You have two minutes to answer this quiz.
1. The measures of variability allows
us to determine the spread of the
data.
2. The greater the variability, the
more consistent the scores
3. In finding the range of ungrouped
data, we will subtract the highest
score to the lowest score.
4. In finding the range of the group
data, we will subtract the highest
class mark to the lowest class mark.
5 . The first step in getting the variance
of grouped data is to determine the
class boundary.
6. In finding the mean deviation, it is
important to get the absolute value of
(x-mean).
7. In finding the variance, we need to
square root the result of (x-mean).
8. Standard deviation is the squareroot
of variance.
1. TRUE
2.FALSE
3. TRUE
4. FALSE
5. FALSE
6. TRUE
7. FALSE
8. TRUE
V. Assignment
Given the data below, find the individual range, mean deviation and the standard
deviation of the scores of the three students in their Mathematics quizzes. Determine
which student has more consistent scores.
VI. Remarks
Prepared By:
Junila A. Tejada
Teacher Applicant

Contenu connexe

Tendances

Lesson plan on Linear inequalities in two variables
Lesson plan on Linear inequalities in two variablesLesson plan on Linear inequalities in two variables
Lesson plan on Linear inequalities in two variablesLorie Jane Letada
 
Circle and Its Part - Math 7 (3rd Quarter)
Circle and Its Part - Math 7 (3rd Quarter)Circle and Its Part - Math 7 (3rd Quarter)
Circle and Its Part - Math 7 (3rd Quarter)Carlo Luna
 
Detailed lesson plan sss congruence postulate
Detailed lesson plan sss congruence postulateDetailed lesson plan sss congruence postulate
Detailed lesson plan sss congruence postulateElton John Embodo
 
Math 10 Curriculum Guide
Math 10 Curriculum GuideMath 10 Curriculum Guide
Math 10 Curriculum Guideleybrigs
 
Detailed lesson plan in mathematics 7 (circles)
Detailed lesson plan in mathematics 7 (circles)Detailed lesson plan in mathematics 7 (circles)
Detailed lesson plan in mathematics 7 (circles)Jo Ann Chrysol Iringan
 
Concept of angle of elevation and depression
Concept of angle of elevation and depressionConcept of angle of elevation and depression
Concept of angle of elevation and depressionJunila Tejada
 
Strategic Intervention Material in Mathematics Grade 7
Strategic Intervention Material in Mathematics Grade 7Strategic Intervention Material in Mathematics Grade 7
Strategic Intervention Material in Mathematics Grade 7Arlene Callang
 
Rectangular Coordinate System Lesson Plan
Rectangular Coordinate System Lesson PlanRectangular Coordinate System Lesson Plan
Rectangular Coordinate System Lesson PlanRealyn Magbanua
 
Math 8 Curriculum Guide rev.2016
Math 8 Curriculum Guide rev.2016Math 8 Curriculum Guide rev.2016
Math 8 Curriculum Guide rev.2016Chuckry Maunes
 
Summative Test on Measures of Position
Summative Test on Measures of PositionSummative Test on Measures of Position
Summative Test on Measures of PositionJoey Valdriz
 
Math 7 Curriculum Guide rev.2016
Math 7 Curriculum Guide rev.2016Math 7 Curriculum Guide rev.2016
Math 7 Curriculum Guide rev.2016Chuckry Maunes
 
PROBABILITY OF MUTUALLY EXCLUSIVE EVENTS final.pptx
PROBABILITY OF MUTUALLY EXCLUSIVE EVENTS final.pptxPROBABILITY OF MUTUALLY EXCLUSIVE EVENTS final.pptx
PROBABILITY OF MUTUALLY EXCLUSIVE EVENTS final.pptxReinabelleMarfilMarq
 
Lesson Plan in Algebra
Lesson Plan in AlgebraLesson Plan in Algebra
Lesson Plan in Algebrajanehbasto
 
DISTANCE FORMULA (GRADE 10 MATH)
DISTANCE FORMULA (GRADE 10 MATH)DISTANCE FORMULA (GRADE 10 MATH)
DISTANCE FORMULA (GRADE 10 MATH)daisyree medino
 

Tendances (20)

Lesson plan on Linear inequalities in two variables
Lesson plan on Linear inequalities in two variablesLesson plan on Linear inequalities in two variables
Lesson plan on Linear inequalities in two variables
 
A detailed lesson plan in permutation
A detailed lesson plan in permutationA detailed lesson plan in permutation
A detailed lesson plan in permutation
 
Circle and Its Part - Math 7 (3rd Quarter)
Circle and Its Part - Math 7 (3rd Quarter)Circle and Its Part - Math 7 (3rd Quarter)
Circle and Its Part - Math 7 (3rd Quarter)
 
Lesson plan (1)
Lesson plan (1)Lesson plan (1)
Lesson plan (1)
 
Quartile (ungrouped)
Quartile (ungrouped)Quartile (ungrouped)
Quartile (ungrouped)
 
Grade 7 Statistics
Grade 7 StatisticsGrade 7 Statistics
Grade 7 Statistics
 
Detailed lesson plan sss congruence postulate
Detailed lesson plan sss congruence postulateDetailed lesson plan sss congruence postulate
Detailed lesson plan sss congruence postulate
 
Math 10 Curriculum Guide
Math 10 Curriculum GuideMath 10 Curriculum Guide
Math 10 Curriculum Guide
 
Detailed lesson plan in mathematics 7 (circles)
Detailed lesson plan in mathematics 7 (circles)Detailed lesson plan in mathematics 7 (circles)
Detailed lesson plan in mathematics 7 (circles)
 
Concept of angle of elevation and depression
Concept of angle of elevation and depressionConcept of angle of elevation and depression
Concept of angle of elevation and depression
 
Strategic Intervention Material in Mathematics Grade 7
Strategic Intervention Material in Mathematics Grade 7Strategic Intervention Material in Mathematics Grade 7
Strategic Intervention Material in Mathematics Grade 7
 
Rectangular Coordinate System Lesson Plan
Rectangular Coordinate System Lesson PlanRectangular Coordinate System Lesson Plan
Rectangular Coordinate System Lesson Plan
 
Math 8 Curriculum Guide rev.2016
Math 8 Curriculum Guide rev.2016Math 8 Curriculum Guide rev.2016
Math 8 Curriculum Guide rev.2016
 
Summative Test on Measures of Position
Summative Test on Measures of PositionSummative Test on Measures of Position
Summative Test on Measures of Position
 
Table of specification in math test
Table of specification in math testTable of specification in math test
Table of specification in math test
 
Math 7 Curriculum Guide rev.2016
Math 7 Curriculum Guide rev.2016Math 7 Curriculum Guide rev.2016
Math 7 Curriculum Guide rev.2016
 
PROBABILITY OF MUTUALLY EXCLUSIVE EVENTS final.pptx
PROBABILITY OF MUTUALLY EXCLUSIVE EVENTS final.pptxPROBABILITY OF MUTUALLY EXCLUSIVE EVENTS final.pptx
PROBABILITY OF MUTUALLY EXCLUSIVE EVENTS final.pptx
 
Lesson Plan in Algebra
Lesson Plan in AlgebraLesson Plan in Algebra
Lesson Plan in Algebra
 
DISTANCE FORMULA (GRADE 10 MATH)
DISTANCE FORMULA (GRADE 10 MATH)DISTANCE FORMULA (GRADE 10 MATH)
DISTANCE FORMULA (GRADE 10 MATH)
 
For demo lesson plan
For demo lesson planFor demo lesson plan
For demo lesson plan
 

Similaire à Detailed Lesson Plan on Measures of Variability of Grouped and Ungrouped Data

Newly-EDITED-DLP-FINAL-DEMO-Quarter-4-Module_1_Measures-of-Central-Tendency-o...
Newly-EDITED-DLP-FINAL-DEMO-Quarter-4-Module_1_Measures-of-Central-Tendency-o...Newly-EDITED-DLP-FINAL-DEMO-Quarter-4-Module_1_Measures-of-Central-Tendency-o...
Newly-EDITED-DLP-FINAL-DEMO-Quarter-4-Module_1_Measures-of-Central-Tendency-o...JONASSIBAL
 
Mean of grouped data.docx
Mean of grouped data.docxMean of grouped data.docx
Mean of grouped data.docxAngeli Lim
 
Weeklong Lesson Plan
Weeklong Lesson PlanWeeklong Lesson Plan
Weeklong Lesson PlanElise Andrews
 
SemiDLL-CO2.Circle-Math 10-Quarter 1docx
SemiDLL-CO2.Circle-Math 10-Quarter 1docxSemiDLL-CO2.Circle-Math 10-Quarter 1docx
SemiDLL-CO2.Circle-Math 10-Quarter 1docxIvySeorin
 
ged_math_lesson_13_ec_final.pdf
ged_math_lesson_13_ec_final.pdfged_math_lesson_13_ec_final.pdf
ged_math_lesson_13_ec_final.pdfAnselmoDelima1
 
SECTION 1A. Journal Week 2Chapter 4 in Affirming Diversity pag.docx
SECTION 1A. Journal Week 2Chapter 4 in Affirming Diversity pag.docxSECTION 1A. Journal Week 2Chapter 4 in Affirming Diversity pag.docx
SECTION 1A. Journal Week 2Chapter 4 in Affirming Diversity pag.docxkenjordan97598
 
Detailed Lesson Plan in Math
Detailed Lesson Plan in Math Detailed Lesson Plan in Math
Detailed Lesson Plan in Math Lorie Jane Letada
 
Curriculum night
Curriculum night Curriculum night
Curriculum night cindy ashe
 
Brain based learning
Brain based learningBrain based learning
Brain based learningTim Barlow
 
Semi-detailed Lesson Plan in English 6
Semi-detailed Lesson Plan in English 6Semi-detailed Lesson Plan in English 6
Semi-detailed Lesson Plan in English 6Rodessa Marie Canillas
 
G6 m1-a-lesson 1-t
G6 m1-a-lesson 1-tG6 m1-a-lesson 1-t
G6 m1-a-lesson 1-tmlabuski
 
When you are working on the Inferential Statistics Paper I want yo.docx
When you are working on the Inferential Statistics Paper I want yo.docxWhen you are working on the Inferential Statistics Paper I want yo.docx
When you are working on the Inferential Statistics Paper I want yo.docxalanfhall8953
 
Rate of change and graphing lesson plan
Rate of change and graphing lesson planRate of change and graphing lesson plan
Rate of change and graphing lesson plansgrif915
 
Take One! #2 Northville.Pptx
Take One! #2  Northville.PptxTake One! #2  Northville.Pptx
Take One! #2 Northville.Pptxguestc23ef1
 
Solving problems with inequalities
Solving problems with inequalitiesSolving problems with inequalities
Solving problems with inequalitiesdouglasgreig
 
Unit 6 presentation base ten equality form of a number with trainer notes 7.9.08
Unit 6 presentation base ten equality form of a number with trainer notes 7.9.08Unit 6 presentation base ten equality form of a number with trainer notes 7.9.08
Unit 6 presentation base ten equality form of a number with trainer notes 7.9.08jcsmathfoundations
 
Dll math 5 q1_w3 (june19-23, 2017) -
Dll math 5 q1_w3 (june19-23, 2017) -Dll math 5 q1_w3 (june19-23, 2017) -
Dll math 5 q1_w3 (june19-23, 2017) -Rigino Macunay Jr.
 
summative notesAssessment and Grading in the Differentiated C.docx
summative notesAssessment and Grading in the Differentiated C.docxsummative notesAssessment and Grading in the Differentiated C.docx
summative notesAssessment and Grading in the Differentiated C.docxdeanmtaylor1545
 

Similaire à Detailed Lesson Plan on Measures of Variability of Grouped and Ungrouped Data (20)

Newly-EDITED-DLP-FINAL-DEMO-Quarter-4-Module_1_Measures-of-Central-Tendency-o...
Newly-EDITED-DLP-FINAL-DEMO-Quarter-4-Module_1_Measures-of-Central-Tendency-o...Newly-EDITED-DLP-FINAL-DEMO-Quarter-4-Module_1_Measures-of-Central-Tendency-o...
Newly-EDITED-DLP-FINAL-DEMO-Quarter-4-Module_1_Measures-of-Central-Tendency-o...
 
Mean of grouped data.docx
Mean of grouped data.docxMean of grouped data.docx
Mean of grouped data.docx
 
Don’t fal out techno in
Don’t fal out techno inDon’t fal out techno in
Don’t fal out techno in
 
Weeklong Lesson Plan
Weeklong Lesson PlanWeeklong Lesson Plan
Weeklong Lesson Plan
 
SemiDLL-CO2.Circle-Math 10-Quarter 1docx
SemiDLL-CO2.Circle-Math 10-Quarter 1docxSemiDLL-CO2.Circle-Math 10-Quarter 1docx
SemiDLL-CO2.Circle-Math 10-Quarter 1docx
 
ged_math_lesson_13_ec_final.pdf
ged_math_lesson_13_ec_final.pdfged_math_lesson_13_ec_final.pdf
ged_math_lesson_13_ec_final.pdf
 
SECTION 1A. Journal Week 2Chapter 4 in Affirming Diversity pag.docx
SECTION 1A. Journal Week 2Chapter 4 in Affirming Diversity pag.docxSECTION 1A. Journal Week 2Chapter 4 in Affirming Diversity pag.docx
SECTION 1A. Journal Week 2Chapter 4 in Affirming Diversity pag.docx
 
Detailed Lesson Plan in Math
Detailed Lesson Plan in Math Detailed Lesson Plan in Math
Detailed Lesson Plan in Math
 
Curriculum night
Curriculum night Curriculum night
Curriculum night
 
Brain based learning
Brain based learningBrain based learning
Brain based learning
 
Semi-detailed Lesson Plan in English 6
Semi-detailed Lesson Plan in English 6Semi-detailed Lesson Plan in English 6
Semi-detailed Lesson Plan in English 6
 
G6 m1-a-lesson 1-t
G6 m1-a-lesson 1-tG6 m1-a-lesson 1-t
G6 m1-a-lesson 1-t
 
When you are working on the Inferential Statistics Paper I want yo.docx
When you are working on the Inferential Statistics Paper I want yo.docxWhen you are working on the Inferential Statistics Paper I want yo.docx
When you are working on the Inferential Statistics Paper I want yo.docx
 
Rate of change and graphing lesson plan
Rate of change and graphing lesson planRate of change and graphing lesson plan
Rate of change and graphing lesson plan
 
Take One! #2 Northville.Pptx
Take One! #2  Northville.PptxTake One! #2  Northville.Pptx
Take One! #2 Northville.Pptx
 
Solving problems with inequalities
Solving problems with inequalitiesSolving problems with inequalities
Solving problems with inequalities
 
Unit 6 presentation base ten equality form of a number with trainer notes 7.9.08
Unit 6 presentation base ten equality form of a number with trainer notes 7.9.08Unit 6 presentation base ten equality form of a number with trainer notes 7.9.08
Unit 6 presentation base ten equality form of a number with trainer notes 7.9.08
 
DMI Session 3
DMI Session 3DMI Session 3
DMI Session 3
 
Dll math 5 q1_w3 (june19-23, 2017) -
Dll math 5 q1_w3 (june19-23, 2017) -Dll math 5 q1_w3 (june19-23, 2017) -
Dll math 5 q1_w3 (june19-23, 2017) -
 
summative notesAssessment and Grading in the Differentiated C.docx
summative notesAssessment and Grading in the Differentiated C.docxsummative notesAssessment and Grading in the Differentiated C.docx
summative notesAssessment and Grading in the Differentiated C.docx
 

Plus de Junila Tejada

Its all about history of math
Its all about history of mathIts all about history of math
Its all about history of mathJunila Tejada
 
Sample of product presentation
Sample of product presentationSample of product presentation
Sample of product presentationJunila Tejada
 
Calculator mockseminar
Calculator mockseminarCalculator mockseminar
Calculator mockseminarJunila Tejada
 
Lesson plan special angles
Lesson plan special anglesLesson plan special angles
Lesson plan special anglesJunila Tejada
 
Hong Kong Educational Technology
Hong Kong Educational Technology Hong Kong Educational Technology
Hong Kong Educational Technology Junila Tejada
 
Approaches to School Curriculum
Approaches to School CurriculumApproaches to School Curriculum
Approaches to School CurriculumJunila Tejada
 
Mathematical Invention and Discoveries
Mathematical Invention and DiscoveriesMathematical Invention and Discoveries
Mathematical Invention and DiscoveriesJunila Tejada
 
Graphs of linear equation
Graphs of linear equationGraphs of linear equation
Graphs of linear equationJunila Tejada
 
Market Structures (economics)
Market Structures (economics)Market Structures (economics)
Market Structures (economics)Junila Tejada
 
Teaching and Learning Araling Panlipunan
Teaching and Learning Araling PanlipunanTeaching and Learning Araling Panlipunan
Teaching and Learning Araling PanlipunanJunila Tejada
 
Erik Erikson's Psycho-Social Theory of Development
Erik Erikson's Psycho-Social Theory of DevelopmentErik Erikson's Psycho-Social Theory of Development
Erik Erikson's Psycho-Social Theory of DevelopmentJunila Tejada
 
Performance Task Design with Rubrics
Performance Task Design with RubricsPerformance Task Design with Rubrics
Performance Task Design with RubricsJunila Tejada
 
Transformation geometry
Transformation geometryTransformation geometry
Transformation geometryJunila Tejada
 

Plus de Junila Tejada (14)

Its all about history of math
Its all about history of mathIts all about history of math
Its all about history of math
 
Sample of product presentation
Sample of product presentationSample of product presentation
Sample of product presentation
 
Calculator mockseminar
Calculator mockseminarCalculator mockseminar
Calculator mockseminar
 
Lesson plan special angles
Lesson plan special anglesLesson plan special angles
Lesson plan special angles
 
Hong Kong Educational Technology
Hong Kong Educational Technology Hong Kong Educational Technology
Hong Kong Educational Technology
 
Approaches to School Curriculum
Approaches to School CurriculumApproaches to School Curriculum
Approaches to School Curriculum
 
Mathematical Invention and Discoveries
Mathematical Invention and DiscoveriesMathematical Invention and Discoveries
Mathematical Invention and Discoveries
 
Graphs of linear equation
Graphs of linear equationGraphs of linear equation
Graphs of linear equation
 
Market Structures (economics)
Market Structures (economics)Market Structures (economics)
Market Structures (economics)
 
Teaching and Learning Araling Panlipunan
Teaching and Learning Araling PanlipunanTeaching and Learning Araling Panlipunan
Teaching and Learning Araling Panlipunan
 
Erik Erikson's Psycho-Social Theory of Development
Erik Erikson's Psycho-Social Theory of DevelopmentErik Erikson's Psycho-Social Theory of Development
Erik Erikson's Psycho-Social Theory of Development
 
Digestive System
Digestive SystemDigestive System
Digestive System
 
Performance Task Design with Rubrics
Performance Task Design with RubricsPerformance Task Design with Rubrics
Performance Task Design with Rubrics
 
Transformation geometry
Transformation geometryTransformation geometry
Transformation geometry
 

Dernier

AUDIENCE THEORY -CULTIVATION THEORY - GERBNER.pptx
AUDIENCE THEORY -CULTIVATION THEORY -  GERBNER.pptxAUDIENCE THEORY -CULTIVATION THEORY -  GERBNER.pptx
AUDIENCE THEORY -CULTIVATION THEORY - GERBNER.pptxiammrhaywood
 
Karra SKD Conference Presentation Revised.pptx
Karra SKD Conference Presentation Revised.pptxKarra SKD Conference Presentation Revised.pptx
Karra SKD Conference Presentation Revised.pptxAshokKarra1
 
How to Add Barcode on PDF Report in Odoo 17
How to Add Barcode on PDF Report in Odoo 17How to Add Barcode on PDF Report in Odoo 17
How to Add Barcode on PDF Report in Odoo 17Celine George
 
INTRODUCTION TO CATHOLIC CHRISTOLOGY.pptx
INTRODUCTION TO CATHOLIC CHRISTOLOGY.pptxINTRODUCTION TO CATHOLIC CHRISTOLOGY.pptx
INTRODUCTION TO CATHOLIC CHRISTOLOGY.pptxHumphrey A Beña
 
MULTIDISCIPLINRY NATURE OF THE ENVIRONMENTAL STUDIES.pptx
MULTIDISCIPLINRY NATURE OF THE ENVIRONMENTAL STUDIES.pptxMULTIDISCIPLINRY NATURE OF THE ENVIRONMENTAL STUDIES.pptx
MULTIDISCIPLINRY NATURE OF THE ENVIRONMENTAL STUDIES.pptxAnupkumar Sharma
 
Influencing policy (training slides from Fast Track Impact)
Influencing policy (training slides from Fast Track Impact)Influencing policy (training slides from Fast Track Impact)
Influencing policy (training slides from Fast Track Impact)Mark Reed
 
Global Lehigh Strategic Initiatives (without descriptions)
Global Lehigh Strategic Initiatives (without descriptions)Global Lehigh Strategic Initiatives (without descriptions)
Global Lehigh Strategic Initiatives (without descriptions)cama23
 
Difference Between Search & Browse Methods in Odoo 17
Difference Between Search & Browse Methods in Odoo 17Difference Between Search & Browse Methods in Odoo 17
Difference Between Search & Browse Methods in Odoo 17Celine George
 
ANG SEKTOR NG agrikultura.pptx QUARTER 4
ANG SEKTOR NG agrikultura.pptx QUARTER 4ANG SEKTOR NG agrikultura.pptx QUARTER 4
ANG SEKTOR NG agrikultura.pptx QUARTER 4MiaBumagat1
 
USPS® Forced Meter Migration - How to Know if Your Postage Meter Will Soon be...
USPS® Forced Meter Migration - How to Know if Your Postage Meter Will Soon be...USPS® Forced Meter Migration - How to Know if Your Postage Meter Will Soon be...
USPS® Forced Meter Migration - How to Know if Your Postage Meter Will Soon be...Postal Advocate Inc.
 
ACC 2024 Chronicles. Cardiology. Exam.pdf
ACC 2024 Chronicles. Cardiology. Exam.pdfACC 2024 Chronicles. Cardiology. Exam.pdf
ACC 2024 Chronicles. Cardiology. Exam.pdfSpandanaRallapalli
 
Barangay Council for the Protection of Children (BCPC) Orientation.pptx
Barangay Council for the Protection of Children (BCPC) Orientation.pptxBarangay Council for the Protection of Children (BCPC) Orientation.pptx
Barangay Council for the Protection of Children (BCPC) Orientation.pptxCarlos105
 
Proudly South Africa powerpoint Thorisha.pptx
Proudly South Africa powerpoint Thorisha.pptxProudly South Africa powerpoint Thorisha.pptx
Proudly South Africa powerpoint Thorisha.pptxthorishapillay1
 
Visit to a blind student's school🧑‍🦯🧑‍🦯(community medicine)
Visit to a blind student's school🧑‍🦯🧑‍🦯(community medicine)Visit to a blind student's school🧑‍🦯🧑‍🦯(community medicine)
Visit to a blind student's school🧑‍🦯🧑‍🦯(community medicine)lakshayb543
 
Student Profile Sample - We help schools to connect the data they have, with ...
Student Profile Sample - We help schools to connect the data they have, with ...Student Profile Sample - We help schools to connect the data they have, with ...
Student Profile Sample - We help schools to connect the data they have, with ...Seán Kennedy
 
Concurrency Control in Database Management system
Concurrency Control in Database Management systemConcurrency Control in Database Management system
Concurrency Control in Database Management systemChristalin Nelson
 
Inclusivity Essentials_ Creating Accessible Websites for Nonprofits .pdf
Inclusivity Essentials_ Creating Accessible Websites for Nonprofits .pdfInclusivity Essentials_ Creating Accessible Websites for Nonprofits .pdf
Inclusivity Essentials_ Creating Accessible Websites for Nonprofits .pdfTechSoup
 
ENGLISH 7_Q4_LESSON 2_ Employing a Variety of Strategies for Effective Interp...
ENGLISH 7_Q4_LESSON 2_ Employing a Variety of Strategies for Effective Interp...ENGLISH 7_Q4_LESSON 2_ Employing a Variety of Strategies for Effective Interp...
ENGLISH 7_Q4_LESSON 2_ Employing a Variety of Strategies for Effective Interp...JhezDiaz1
 

Dernier (20)

AUDIENCE THEORY -CULTIVATION THEORY - GERBNER.pptx
AUDIENCE THEORY -CULTIVATION THEORY -  GERBNER.pptxAUDIENCE THEORY -CULTIVATION THEORY -  GERBNER.pptx
AUDIENCE THEORY -CULTIVATION THEORY - GERBNER.pptx
 
Karra SKD Conference Presentation Revised.pptx
Karra SKD Conference Presentation Revised.pptxKarra SKD Conference Presentation Revised.pptx
Karra SKD Conference Presentation Revised.pptx
 
How to Add Barcode on PDF Report in Odoo 17
How to Add Barcode on PDF Report in Odoo 17How to Add Barcode on PDF Report in Odoo 17
How to Add Barcode on PDF Report in Odoo 17
 
INTRODUCTION TO CATHOLIC CHRISTOLOGY.pptx
INTRODUCTION TO CATHOLIC CHRISTOLOGY.pptxINTRODUCTION TO CATHOLIC CHRISTOLOGY.pptx
INTRODUCTION TO CATHOLIC CHRISTOLOGY.pptx
 
MULTIDISCIPLINRY NATURE OF THE ENVIRONMENTAL STUDIES.pptx
MULTIDISCIPLINRY NATURE OF THE ENVIRONMENTAL STUDIES.pptxMULTIDISCIPLINRY NATURE OF THE ENVIRONMENTAL STUDIES.pptx
MULTIDISCIPLINRY NATURE OF THE ENVIRONMENTAL STUDIES.pptx
 
Influencing policy (training slides from Fast Track Impact)
Influencing policy (training slides from Fast Track Impact)Influencing policy (training slides from Fast Track Impact)
Influencing policy (training slides from Fast Track Impact)
 
Global Lehigh Strategic Initiatives (without descriptions)
Global Lehigh Strategic Initiatives (without descriptions)Global Lehigh Strategic Initiatives (without descriptions)
Global Lehigh Strategic Initiatives (without descriptions)
 
Difference Between Search & Browse Methods in Odoo 17
Difference Between Search & Browse Methods in Odoo 17Difference Between Search & Browse Methods in Odoo 17
Difference Between Search & Browse Methods in Odoo 17
 
ANG SEKTOR NG agrikultura.pptx QUARTER 4
ANG SEKTOR NG agrikultura.pptx QUARTER 4ANG SEKTOR NG agrikultura.pptx QUARTER 4
ANG SEKTOR NG agrikultura.pptx QUARTER 4
 
USPS® Forced Meter Migration - How to Know if Your Postage Meter Will Soon be...
USPS® Forced Meter Migration - How to Know if Your Postage Meter Will Soon be...USPS® Forced Meter Migration - How to Know if Your Postage Meter Will Soon be...
USPS® Forced Meter Migration - How to Know if Your Postage Meter Will Soon be...
 
ACC 2024 Chronicles. Cardiology. Exam.pdf
ACC 2024 Chronicles. Cardiology. Exam.pdfACC 2024 Chronicles. Cardiology. Exam.pdf
ACC 2024 Chronicles. Cardiology. Exam.pdf
 
Barangay Council for the Protection of Children (BCPC) Orientation.pptx
Barangay Council for the Protection of Children (BCPC) Orientation.pptxBarangay Council for the Protection of Children (BCPC) Orientation.pptx
Barangay Council for the Protection of Children (BCPC) Orientation.pptx
 
Proudly South Africa powerpoint Thorisha.pptx
Proudly South Africa powerpoint Thorisha.pptxProudly South Africa powerpoint Thorisha.pptx
Proudly South Africa powerpoint Thorisha.pptx
 
Visit to a blind student's school🧑‍🦯🧑‍🦯(community medicine)
Visit to a blind student's school🧑‍🦯🧑‍🦯(community medicine)Visit to a blind student's school🧑‍🦯🧑‍🦯(community medicine)
Visit to a blind student's school🧑‍🦯🧑‍🦯(community medicine)
 
Student Profile Sample - We help schools to connect the data they have, with ...
Student Profile Sample - We help schools to connect the data they have, with ...Student Profile Sample - We help schools to connect the data they have, with ...
Student Profile Sample - We help schools to connect the data they have, with ...
 
Concurrency Control in Database Management system
Concurrency Control in Database Management systemConcurrency Control in Database Management system
Concurrency Control in Database Management system
 
Model Call Girl in Tilak Nagar Delhi reach out to us at 🔝9953056974🔝
Model Call Girl in Tilak Nagar Delhi reach out to us at 🔝9953056974🔝Model Call Girl in Tilak Nagar Delhi reach out to us at 🔝9953056974🔝
Model Call Girl in Tilak Nagar Delhi reach out to us at 🔝9953056974🔝
 
Inclusivity Essentials_ Creating Accessible Websites for Nonprofits .pdf
Inclusivity Essentials_ Creating Accessible Websites for Nonprofits .pdfInclusivity Essentials_ Creating Accessible Websites for Nonprofits .pdf
Inclusivity Essentials_ Creating Accessible Websites for Nonprofits .pdf
 
ENGLISH 7_Q4_LESSON 2_ Employing a Variety of Strategies for Effective Interp...
ENGLISH 7_Q4_LESSON 2_ Employing a Variety of Strategies for Effective Interp...ENGLISH 7_Q4_LESSON 2_ Employing a Variety of Strategies for Effective Interp...
ENGLISH 7_Q4_LESSON 2_ Employing a Variety of Strategies for Effective Interp...
 
FINALS_OF_LEFT_ON_C'N_EL_DORADO_2024.pptx
FINALS_OF_LEFT_ON_C'N_EL_DORADO_2024.pptxFINALS_OF_LEFT_ON_C'N_EL_DORADO_2024.pptx
FINALS_OF_LEFT_ON_C'N_EL_DORADO_2024.pptx
 

Detailed Lesson Plan on Measures of Variability of Grouped and Ungrouped Data

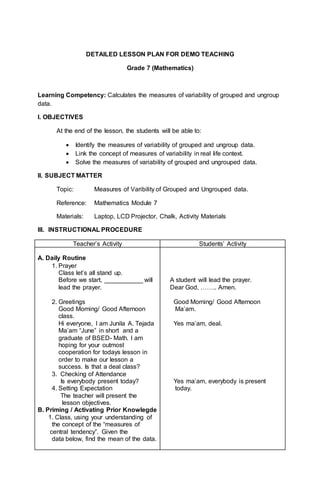
  • 1. DETAILED LESSON PLAN FOR DEMO TEACHING Grade 7 (Mathematics) Learning Competency: Calculates the measures of variability of grouped and ungroup data. I. OBJECTIVES At the end of the lesson, the students will be able to:  Identify the measures of variability of grouped and ungroup data.  Link the concept of measures of variability in real life context.  Solve the measures of variability of grouped and ungrouped data. II. SUBJECT MATTER Topic: Measures of Varibility of Grouped and Ungrouped data. Reference: Mathematics Module 7 Materials: Laptop, LCD Projector, Chalk, Activity Materials III. INSTRUCTIONAL PROCEDURE Teacher’s Activity Students’ Activity A. Daily Routine 1. Prayer Class let’s all stand up. Before we start, ___________ will lead the prayer. 2. Greetings Good Morning/ Good Afternoon class. Hi everyone, I am Junila A. Tejada Ma’am “June” in short and a graduate of BSED- Math. I am hoping for your outmost cooperation for todays lesson in order to make our lesson a success. Is that a deal class? 3. Checking of Attendance Is everybody present today? 4. Setting Expectation The teacher will present the lesson objectives. B. Priming / Activating Prior Knowlegde 1. Class, using your understanding of the concept of the “measures of central tendency”. Given the data below, find the mean of the data. A student will lead the prayer. Dear God, …….. Amen. Good Morning/ Good Afternoon Ma’am. Yes ma’am, deal. Yes ma’am, everybody is present today.
  • 2. SET A: 4, 10, 12, 20, 24 SET B: 12, 13, 14, 15, 16 What is the mean for set A? How about for set B? 2. Review Based from the number line class, which set has a long line? How about short? Very Good. The line represent the spread of the data and it shows that Set A is more spread than Set B. Does the set of data in our activity can be considered as grouped or ungrouped data? Why? Very Good. Grouped data are set of data that are categorize and arrange in a form of data while the ungrouped data are data that are raw and not yet classified. C. Lesson Development 1. Motivation/ Activity Class, are you familiar with the term “measures of variability”? In our drill earlier, we compare the distance of spread of set A, and set B right? That process is a way of knowing the spread of the data and determining the consistency of data which is the core of the measures of variability, To learn more about the measures variability and its’ types we will conduct an activity. Are you ready? Let’s us start our activity entitled “Connectiword”. The class will be divided into six groups, each group will select their group leader. The activity is for only 5 minutes. Once the time is done, the students will submit their work. In the activity, the students will arrange the shuffled words by sequencing the clues indicated below the letter. Each group will select a representative that will The mean for set A ma’am is 14, while in Set B it is also 14. The set that has long line is Set A ma’am while the short line is Set B. It is ungrouped data ma’am because the data are not in table. The set of data is considered ungrouped ma’am. Students’ answers may vary. Yes we are ready. Yes ma’am.
  • 3. pick the words to be arrange and a representative to recite the sequence that they created. Number 1: Number 2: Number 3: Number 4: Number 5: Number 6: 2. Analysis What did we do in our activity? Correct. What is the word for number 1? Kindly recite the description on each letter. The students will answer: The students will answer: The students will answer: The students will answer: The students will answer: The students will answer: We were tasked to arrange the letters base on the clues below the letter ma’am. The word ma’am is RANGE. A student will recite the steps in each letters.
  • 4. Very Good. In order to find the spread of the scores of Mel, what did she discover? Exactly. The dicovery of Mel is the definition of range which we will? Very Good. What will be the range of the scores? Which set has less spread? Excellent. Therefore, the scores in Math class is more consistent and closer together. The formula above is applicable for grouped data. For group data, we will first get the upper boundary of the highest score and the lower boundary of the lowest score. What is the lowest score? What is the lowest boundary? The highest score and highest boundary? After identifying the lowest and highest Boundary, simply subtract the highest To the lowest boundary. So the range is? What if the two sets of data have the same range? Is there other way to compute the spread of the data? Let us find out later. What is the answer for the shuffled letter no. 2? Kindly recite the description below the letters. What did Joy find first? What is the mean? In subtracting the individual scores to the mean why it is important to get its absolute value? In mean deviation, we are concerned with the distance of the individual scores from the mean and there is no negative distance so we make sure to get is absolute value. So, if we will solve the mean deviation, we will create a table: She subtract the lowest score from the highest score ma’am. We will subtract the lowest score from the highest ma’am. The range of her score in Math is 5, while 8 in English ma’am. So the scores in math is less spread. The lowest score ma’am is 11 and the lowest boundary is 10.5, while the highest score is 22 and the highest boundary is 22.5. The range is 12 ma’am. Students’ answer may vary. The answer ma’am is MEAN DEVIATION. A student will recite the steps below the letters. The mean ma’am. The mean is 25 ma’am. The students’ answer may vary.
  • 5. What will do next? Very Good. So our mean deviation is? Now, let us focus on number 3, what is the word? In the letter V, it indicates that it is a raw score, is data grouped or ungrouped? Correct. Kindly recite the description below the letter. Very Good. What is the first step of Veronica in finding the spread of her scores? After she find the difference of the mean and the individual score, what did she do with the result? So if we will get the variance, we will create a table. What is the summation of the squared over the number of terms? Very Good. Now what is the word for number 5? Please recite the description below the letters. What are your observation from the description recited? Exactly. Standard deviation (SD) is the squareroot of the variance, so the SD is? Now, we will proceed on the next word. What is the word for number 5? Okay. Kindly recite description below the letters. What is the first step? We will add the all the result and divide the number of terms. The mean deviation ma’am is 10. The word ma’am is VARIANCE. It is ungrouped data ma’am. A student will recite the steps below the letter. She first determines the mean ma’am. She squares the result ma’am. The variance is equal to 5. The word is STANDARD DEVIATION ma’am. A student will recite the steps below the letter. It is almost the same with variance ma’am but the standard deviation has square root. The standard deviation is 2.24. The word for number 5 ma’am is VARIANCE. A student will recite the steps below the letter. We need to find the class mark ma’am.
  • 6. How can we find the class mark? Very Good. Now we will create a table. What is the summation of the f(x- mean)^2? Using the formula, what is our variance? What do you think is difference of this variance from the variance presented earlier? Very good. The formula earlier is for finding the variance for ungrouped data while this is the formula for finding the variance of grouped data. Now, we will reveal the last word. What is the word? Kindly recite the description underneath the letters. Do you have any observation? Very Good. In finding the standard Deviation of grouped data follow the Steps in finding the variance and find its squareroot. 3. Abstraction The terms that you discovered are the different measures of spread or measures of variability. Again, what is the purpose of measure of variability? Very good. Always remember that the lesser the variability, the more consistent the scores and the data. Now, what are the measures of variability for ungrouped data and grouped data? 4. Application By adding the two interval and dividing it by the number of terms. The summation ma’am is 420. The variance is 14.48 ma’am. The difference ma’am is that the data earlier are raw score while the data now contains interval and frequency. The word ma’am is STANDARD DEVIATION. A student will recite the steps below the letter. Yes ma’am. It is same with the steps in variance but final answer will be in square root. The measures of variability allows us to know how spread our scores/ data ma’am. The measures of variability for ungrouped and grouped data ma’am are range, mean deviation, variance, and standard deviation.
  • 7. Now that you know the measures of varibility of grouped and ungrouped data, we will be having a group activity. I will divide you into two groups. Each group will select their group leaders. The leader will be the one who is responsible for dividing the task among the members of the group. Each group will be given a pen and a manila paper that consists of tables the goal of the group is to complete the table and answer the given questions. The activity will only cover 15 minutes of the time. 1. Complete the table below and find the: 1.1 Standard Deviation 1.2 Variance 1.3 Range 2. Complete the table below and find the: 2.1 Variance 2.2 Standard deviation The students will answer the ff: The students will answer the ff: The students will answer.
  • 8. IV. Evaluation Class, write TRUE if the statement is true and FALSE if the statement is false. You have two minutes to answer this quiz. 1. The measures of variability allows us to determine the spread of the data. 2. The greater the variability, the more consistent the scores 3. In finding the range of ungrouped data, we will subtract the highest score to the lowest score. 4. In finding the range of the group data, we will subtract the highest class mark to the lowest class mark. 5 . The first step in getting the variance of grouped data is to determine the class boundary. 6. In finding the mean deviation, it is important to get the absolute value of (x-mean). 7. In finding the variance, we need to square root the result of (x-mean). 8. Standard deviation is the squareroot of variance. 1. TRUE 2.FALSE 3. TRUE 4. FALSE 5. FALSE 6. TRUE 7. FALSE 8. TRUE V. Assignment Given the data below, find the individual range, mean deviation and the standard deviation of the scores of the three students in their Mathematics quizzes. Determine which student has more consistent scores. VI. Remarks Prepared By: Junila A. Tejada Teacher Applicant