Kalman Graffi - 3rd Research Talk - 2010
•
0 j'aime•249 vues

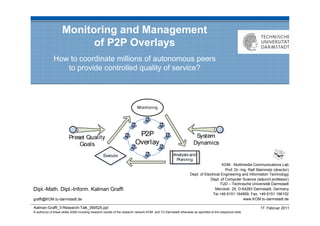
The document discusses monitoring and managing peer-to-peer overlays through a self-configuration cycle that involves monitoring the system state, analyzing the metrics to derive a new parameter configuration, and distributing the new configuration to peers in order to meet predefined quality goals for the overlay. The goal is to coordinate millions of autonomous peers to provide controlled quality of service through an automated process of reconfiguring established peer-to-peer overlays.

Recommandé
Recommandé
Contenu connexe
En vedette
En vedette (16)
Similaire à Kalman Graffi - 3rd Research Talk - 2010
Similaire à Kalman Graffi - 3rd Research Talk - 2010 (20)
Plus de Kalman Graffi
Plus de Kalman Graffi (15)
Dernier
Dernier (20)
Kalman Graffi - 3rd Research Talk - 2010
- 1. Monitoring and Management of P2P Overlays How to coordinate millions of autonomous peers to provide controlled quality of service? KOM - Multimedia Communications Lab Prof. Dr.-Ing. Ralf Steinmetz (director) Dept. of Electrical Engineering and Information Technology Dept. of Computer Science (adjunct professor) TUD – Technische Universität Darmstadt Dipl.-Math. Dipl.-Inform. Kalman Graffi Merckstr. 25, D-64283 Darmstadt, Germany Tel.+49 6151 164959, Fax. +49 6151 166152 graffi@KOM.tu-darmstadt.de www.KOM.tu-darmstadt.de Kalman-Graffi_3-Research-Talk_090525.ppt 17. Februar 2011 © author(s) of these slides 2008 including research results of the research network KOM and TU Darmstadt otherwise as specified at the respective slide
- 2. The Peer-to-Peer Paradigm Peer-to-peer systems Users build infrastructure Service is provided from users to users Peer-to-peer overlays Connecting all peers, providing new functionality H(„my data“) = 3107 1008 1622 2011 709 2207 E.g. Distributed Hash Tables, keyword-based search ? 611 3485 2906 12.5.7.31 peer-to-peer.info planet-lab.org berkeley.edu 61.51.166.150 95.7.6.10 86.8.10.18 7.31.10.25 Evolution of applications / QoS demands File sharing No Quality of Service (QoS) requirements Voice over IP Real-time requirements Video-on-demand Real-time and bandwidth requirements Online community platforms Potential for high user interaction See: K. Graffi, AsKo, et al. “Peer-to-Peer Forschung - Überblick und Herausforderungen” KOM – Multimedia Communications Lab 2 In: it - Information Technology (Methods and Applications of Informatics and Information Technology), vol. 46, no. 5, p. 272-279, July 2007
- 3. Dynamics in P2P System Various scenarios Distributed storage Content delivery User Discovery and contacting of users Application Manage- Dynamics over time ment Overlay Network size Churn Devices Peer heterogeneity Network Peer capacities Connectivity Create a new overlay for every case? No, automated reconfiguring of established overlays! Management of P2P overlays KOM – Multimedia Communications Lab 3
- 4. The Vision: An Example of Automatic Adaption of P2P Overlays to our Needs We want: P2P overlay Fast storage, THIS fast lookup! manages to achieve what we want! 1622 2011 1008 2207 709 2507 2682 BUT: we do not 678 want to know what 659 611 3485 2906 is in the ‘black-box’ KOM – Multimedia Communications Lab 4
- 5. Resulting System… We want: P2P overlay Fast storage, fast lookup! PEER: Prioritize e.g. messages! 2 log( N ) 1622 2011 10 1008 2207 709 2507 1 log( N ) 7 2 OVERLAY: 2682 More Hop count connections 678 659 2906 200 ms 611 3485 UNDERLAY: Chose closer 50 ms contacts Duration of a hop KOM – Multimedia Communications Lab 5
- 6. Steps between… We want: P2P overlay e.g. for N=10K 2 log( N ) 10 1 log( N ) 2 7 1622 2011 1008 2207 Hop count 709 2507 2682 678 659 2906 611 3485 1. Hop count now? 2. What can fix hop count? 3. Fix hop count 4. Hold it fixed! KOM – Multimedia Communications Lab 6
- 7. Problem Statement: Self-X and Automated Reconfiguration System goals are predefined Application and scenario specific e.g. Metric intervals Examples Goal interval for hop count: [7,10] Standard deviation of peer load: max 500% Goal Configuration should adapt to system goals Automated meeting of predefined metric intervals Step 1: Monitor current system state Step 2: Analysis state, plan new parameters Step 3: Distribute and adopt new parameters on all peers KOM – Multimedia Communications Lab 7
- 8. Outline Introduction Motivation and Example My Solution: Quick Overview Self-Configuration Cycle for P2P Overlays Overview and Timeline Execution: Efficient Resource Usage in P2P Systems Monitoring: SkyEye.KOM Design Decision Simulation Results Analysis and Plan Simulation Results Summary and Outlook KOM – Multimedia Communications Lab 8
- 9. Self-Configuration Cycle in P2P Systems Concept of Autonomic Computing Applied to Peer-to-Peer Overlays KOM – Multimedia Communications Lab 9
- 10. Timeline First F-Vortrag Metric-oriented resource usage Coordinated influence on single metric On 3 levels in the p2p system: Peer, overlay and network resources Second F-Vortrag SkyEye.KOM Information management Monitoring of system state Capacity-based peer search KOM – Multimedia Communications Lab 10
- 11. Third F-Vortrag: Closing the Cycle Monitoring system state Applying rules on measured metrics Derive new parameter configuration Distributed and adapt new configuration Repeat configuration cycle until quality goals reached KOM – Multimedia Communications Lab 11
- 12. Outline Introduction Motivation and Example My Solution: Quick Overview Self-Configuration Cycle for P2P Overlays Overview and Timeline Execution: Efficient Resource Usage in P2P Systems Monitoring: SkyEye.KOM Design Decision Simulation Results Analysis and Plan Simulation Results Summary and Outlook KOM – Multimedia Communications Lab 12
- 13. Metric-oriented Resource Usage Key question: Peer level How can I influence a system metric? 1008 1622 2011 709 2207 2507 Peer level Overlay level 2682 Schedule bandwidth, CPU, (…) usage 678 659 2906 Overlay level 611 3485 Underlay/ Allocate heterogeneous peer capacities network level Network level Neighborhood selection Answer: Through setting “right” parameters 10 Next questions 7 Which metrics should be changed? Monitoring Which parameters are “right”? Analysis and Plan Hop count K. Graffi et al. “Overlay Bandwidth Management: Scheduling and Active Queue Management of Overlay Flows” IEEE LCN 2007 Communications Lab 13 KOM – Multimedia K. Graffi et al. “Load Balancing for Multimedia Streaming in Heterogeneous P2P Systems” ACM NOSSDAV 2008
- 14. Outline Introduction Motivation and Example My Solution: Quick Overview Self-Configuration Cycle for P2P Overlays Overview and Timeline Execution: Efficient Resource Usage in P2P Systems Monitoring: SkyEye.KOM Design Decision Simulation Results Analysis and Plan Simulation Results Summary and Outlook KOM – Multimedia Communications Lab 14
- 15. SkyEye.KOM – Information Management Two functionalities Capacity-based peer search Example: Find 5 peers with 100MB storage space and 20kb/s up bandwidth Monitoring system state Global view on system metrics Statistical representation Quality requirements Performance: precise, fresh, robust Costs: lightweight, minimal costs K. Graffi et al. “SkyEye.KOM: An Information Management Over-Overlay for Getting the Oracle View on Structured P2P Systems”Communications Lab 15 KOM – Multimedia IEEE ICPADS 2008
- 16. Inspiration: Monitoring Trees Topology Information management Tree based information architecture Information aggregated at each level Tree degree and node count height In P2P monitoring: churn and equal roles Here: tree degree = 4 Root Coordinators Students KOM – Multimedia Communications Lab 16
- 17. SkyEye.KOM – Architecture Design Decisions Integrated vs. new layer New layer allows wider applicability Reactive vs. proactive System state information is continuously interesting for all users Monitoring topology: bus, ring, star, mesh, tree Tree structure alleviate information aggregation Support for peer heterogeneity: heterogeneous vs. equal roles Load similar for all peers in all positions, no further roles needed Position assignment: dynamic vs. deterministic Deterministic IDs used in topology, dynamically resolved with DHT K. Graffi et al. “SkyEye.KOM: An Information Management Over-Overlay for Getting the Oracle View on Structured–P2P Systems” IEEE ICPADS 2008 17 KOM Multimedia Communications Lab
- 18. Overview on SkyEye.KOM Topology Statistic updates Tree based information architecture Periodically sent to parent peer Uses p2p overlay functionality Aggregated in each node ( same size) [µ,σ,σ²,Σ, min,max] 0,09 0,2 0,3 0,4 0,51 0,6 0,75 0,9 0 1 [µ,σ,σ²,Σ, 50 1 min,max] 10 45 15 40 20 [µ,σ,σ²,Σ, 30 min,max] KOM – Multimedia Communications Lab 18
- 19. Overview on SkyEye.KOM Topology Statistic updates Tree based information architecture Periodically sent to parent peer Uses p2p overlay functionality Aggregated in each node ( same size) [µ,σ,σ²,Σ, 0,09 0,2 0,3 0,4 0,51 0,6 0,75 0,9 min, max] 0 1 [µ,σ,σ²,Σ, 50 1 min, max] 10 45 15 40 20 30 [µ,σ,σ²,Σ, min, max] KOM – Multimedia Communications Lab 19
- 20. Outline Introduction Motivation and Example My Solution: Quick Overview Self-Configuration Cycle for P2P Overlays Overview and Timeline Execution: Efficient Resource Usage in P2P Systems Monitoring: SkyEye.KOM Design Decision Simulation Results Analysis and Plan Simulation Results Summary and Outlook KOM – Multimedia Communications Lab 20
- 21. Simulation Setup Evaluated in PeerfactSim.KOM PeerfactSim.KOM User Simulation Setup Application Simulation Engine IdealDHT: Dispatches messages to responsible peer Manage- ment 5000 Nodes Overlay Delay model: global network positioning Churn model: based on KAD measurements (Steiner et al.) Transport Network Metrics Monitored and real metrics Relative monitoring error Monitoring age Traffic overhead KOM – Multimedia Communications Lab 21
- 22. Monitoring Performance Tree degree = 4 Update interval = 60sec K. Graffi, D. Stingl et al. “Monitoring and Management of Structured P2P Systems” submitted to IEEE P2P 2009 KOM – Multimedia Communications Lab 22
- 23. Monitoring Costs Tree degree = 4 Update interval = 60sec K. Graffi, D. Stingl et al. “Monitoring and Management of Structured P2P Systems” submitted to IEEE P2P 2009 KOM – Multimedia Communications Lab 23
- 24. SkyEye.KOM: Properties Monitoring Tree degree Smoothening: tradeoff freshness vs. precision Update intervals Smoothening: relative errors K. Graffi, D. Stingl et al. “Monitoring and Management of Structured P2P Systems” submitted to IEEE P2P 2009 KOM – Multimedia Communications Lab 24
- 25. SkyEye.KOM: Properties (2. F-Vortrag) Capacity-based Peer Search Scalability Query resolution Freshness Completeness and validity K. Graffi et al. “SkyEye.KOM: An Information Management Over-Overlay for Getting the Oracle View on Structured–P2P Systems” IEEE ICPADS 2008 25 KOM Multimedia Communications Lab
- 26. SkyEye.KOM: Testbed Evaluation 2 x ~50 % fail ~20% fail ~10% fail random churn 37 machines, up to 500 instances Testbed- match simulation-results Tree properties Selected metrics: bandwidth utilization, peer density per level KOM – Multimedia Communications Lab 26
- 27. Outline Introduction Motivation and Example My Solution: Quick Overview Self-Configuration Cycle for P2P Overlays Overview and Timeline Execution: Efficient Resource Usage in P2P Systems Monitoring: SkyEye.KOM Design Decision Simulation Results Analysis and Plan Simulation Results Summary and Outlook KOM – Multimedia Communications Lab 27
- 28. Analysis and Plan Steps prepared P2P overlay parameterizable Monitoring reveals current system state Predefined quality goals given Steps needed Derive new parameter configuration Based on Predefined metric intervals Current metrics Current parameter configuration Distribute new configuration timely to all peers KOM – Multimedia Communications Lab 28
- 29. Analysis Point and Configuration Distribution SkyEye.KOM topology SkyEye.KOM aggregates system statistics up the tree Every update message is acknowledged Global view from above Policy of new actions to implement Root has global view and can reach all leafs [µ,σ,σ²,Σ, min, max] Root analyzes and [µ,σ,σ²,Σ, min, max] pushes new configuration down [µ,σ,σ²,Σ, min, max] KOM – Multimedia Communications Lab 29
- 30. Analysis Point and Configuration Distribution SkyEye.KOM topology SkyEye.KOM aggregates system statistics up the tree Every update message is acknowledged Global view from above Policy of new actions to implement Root has global view [µ,σ,σ²,Σ, and can reach all leafs min, max] + new parameter Root analyzes and configuration pushes new configuration down KOM – Multimedia Communications Lab 30
- 31. Deriving a new Configuration Root is deciding component Metric goals Metrics Analysis Parameter Detects missed quality intervals and Plan Parameters Plans new configuration Spreads new configuration to Metric goal all peers using SkyEye.KOM Current Peers adopt locally the new rules metric Parameters Prevent configuration oscillation Give time for changes to take effect Introduce execution delay Analyze slope of value history Act only if small, i.e. changes settled KOM – Multimedia Communications Lab 31
- 32. Our Analysis Approach Rule based Planning Compare preset quality intervals with monitored status Deviance detected: Adapt rules on parameters Wait until current changes take effect Results presented Rules manually set Using known correlations Future Work Automated rule derivation Use machine learning to identify metric / parameter correlations Vary identified parameters using genetic algorithms KOM – Multimedia Communications Lab 32
- 33. Outline Introduction Motivation and Example My Solution: Quick Overview Self-Configuration Cycle for P2P Overlays Overview and Timeline Execution: Efficient Resource Usage in P2P Systems Monitoring: SkyEye.KOM Design Decision Simulation Results Analysis and Plan Simulation Results Summary and Outlook KOM – Multimedia Communications Lab 33
- 34. Case: Chord, Hop Count, Routing Table Size Chord H(„mydata“) = 3107 Classic DHT, provides req. functionality 709 1008 1622 2011 2207 Adapted to consider new configuration ? 611 2906 3485 Parameter: Finger table (FT) size Metric: Hop count (HC) Analysis: Hop count interval [7,10] Plan: HC large FT +100% HC small FT -10% KOM – Multimedia Communications Lab 34
- 35. Starting with High Hop Count Quick convergence towards preset quality interval Analysis: Too large hop count is detected Finger table size: increase by 100% Initial FT size: 20, at end 80 Quality goal is reached and kept KOM – Multimedia Communications Lab 35
- 36. Starting with Low Hop Count Quick convergence towards preset quality interval Analysis: Too small hop count is detected Finger table size: decrease by 10% Initial FT size: 160, at end 116 Quality goal is reached and kept KOM – Multimedia Communications Lab 36
- 37. Simulation with 10,000 nodes KOM – Multimedia Communications Lab 37
- 38. Outline Introduction Motivation and Example My Solution: Quick Overview Self-Configuration Cycle for P2P Overlays Overview and Timeline Execution: Efficient Resource Usage in P2P Systems Monitoring: SkyEye.KOM Design Decision Simulation Results Analysis and Plan Simulation Results Summary and Outlook KOM – Multimedia Communications Lab 38
- 39. Summary Management of P2P overlays Reach and hold preset quality intervals Through system management cycle Coordinated resource usage Research on 3 levels of a p2p system Tunable optimization goals Monitoring: SkyEye.KOM Global view on statistics of running system: avg./std./min./max on all metrics Precise yet cost effective monitoring Analysis / Plan / Execute in Chord Automated rule application Preset quality intervals are reached/hold KOM – Multimedia Communications Lab 39
- 40. Outlook Future work Evaluate cycle in Kademlia Automatically detect rules Parameter-metric correlation Using machine learning and genetic algorithms Implications Allows the usage of P2P overlays “off the shelf” For various scenarios / environments Monitoring and quality control P2P as mature IT architecture Interesting for industry Self-configuration framework can include and consider other functional layers KOM – Multimedia Communications Lab 40
- 41. Questions? KOM – Multimedia Communications Lab 41