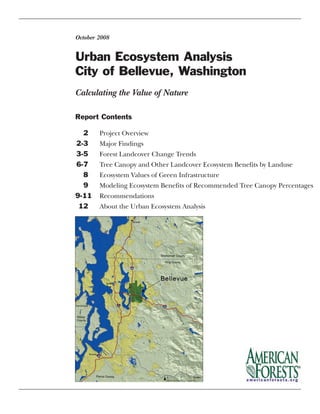
1. Urban Ecosystem Analysis
City of Bellevue, Washington
October 2008
Report Contents
2 Project Overview
2-3 Major Findings
3-5 Forest Landcover Change Trends
6-7 Tree Canopy and Other Landcover Ecosystem Benefits by Landuse
8 Ecosystem Values of Green Infrastructure
9 Modeling Ecosystem Benefits of Recommended Tree Canopy Percentages
9-11 Recommendations
12 About the Urban Ecosystem Analysis
Calculating the Value of Nature
2. Major Findings
In 1998, American Forests conducted an initial Urban
Ecosystem Analysis (UEA) of Bellevue looking at the change
in canopy coverage. Between 1986 and 1996 the city had lost
12% of its tree canopy cover. This new analysis shows that the
city has lost an additional 9% of tree canopy since then and
quantifies the impacts this loss has had on stormwater man-
agement and air and water quality.
1996-2006 Landcover Change Trend Data Using 30 meter
Landsat Satellite Imagery
Since the initial UEA was conducted, tree canopy in
Bellevue declined another 9% percent. This continuing
negative trend is inversely related to urban development
within the city of Bellevue. Although the canopy loss trend
has slowed in recent years, the cumulative loss was meas-
ured at 20% since 1986.
1996-2006 Loss of Ecosystem Services
The loss of forest land cover and tree canopy and resulting
increase in urban areas has ecological consequences; loss of
green infrastructure means the City’s natural environment
is less able to provide ecosystem services for air, water, and
carbon.
Bellevue’s vegetative landcover lost its ability to remove
approximately 30,000 pounds of air pollutants annually, val-
ued at $68,000 per year. The loss of tree canopy equated to
a loss in 15,000 tons of carbon stored in trees’ wood and a
loss of 113 tons of carbon sequestered annually.
As the City continues to develop, the ratio of impervious to
pervious surface greatly influences the amount of stormwa-
ter runoff Bellevue must manage. Currently, Bellevue is
46% impervious surface.
Without tree canopy to reduce stormwater runoff volume,
the City must manage an additional 755,000 cubic feet of
stormwater, valued at $1.5 million (using a national cost of
$2 per cubic foot.). Construction costs for stormwater
detention in the Bellevue area is estimated to be $10 per
cubic foot, resulting in a value of $15 million.
Tree roots absorb water pollutants; based on American
Forests’ modeling, eight of these pollutants can be meas-
ured: Biological Oxygen Demand, Cadmium, Copper,
Lead, Nitrogen, Phosphorus, Suspended Solids, and Zinc.
Of these, each worsened, ranging from 15% for zinc to 42%
for Cadmium because trees were removed from the land.
2
Project Overview
Recognizing the many benefits that urban tree canopy brings to
urban environmental quality, the City of Bellevue engaged
American Forests to update their 1998 Urban Ecosystem
Analysis (UEA), initially conducted using Landsat satellite data.
This analysis examines forest, tree canopy and other landcover
changes over the last decade and quantifies the ecosystem ben-
efits of the City’s green infrastructure. This study also takes a
closer look at the shortfalls and potential for increasing tree
canopy within distinct land uses and three land ownership cat-
egories: Public Park and Open Space, Public Street Right-of-
Way and Private Property. Currently, 69% of the city’s 21,377
acres of land is private property comprised of the central busi-
ness district, industrial, commercial and mixed use, and resi-
dential land. City-owned Park and Open Space property
occupies 12% of the city land and 18% of the city land base is
public Right-of-Way.
The Urban Ecosystem Analysis in this study analyzed the ecol-
ogy of landcover at two scales spanning two time periods. The
first assessment addressed contiguous forest land conversion
using moderate resolution (30 meter pixel resolution) from
Landsat satellite imagery taken between1985 and 2006. While
the resolution of Landsat data is too coarse for analyzing at the
scale of individual trees and land use areas, this chronological
analysis reveals both historic and future trends. The second
assessment studied tree canopy and other urban landcover
types using 2007 high-resolution (2 foot pixel resolution), dig-
ital imagery to analyze the City’s existing landcover and ecosys-
tem benefits by land use classification.
This study also conducted modeling scenarios to quantify the
environmental benefits of enhancing Bellevue’s tree canopy to
American Forests’ recommended canopy percentage levels.
The evidence and data presented in this project will provide
City leaders with the information to better integrate natural
systems into future development decisions.
Data from this project gives the City staff the ability to conduct
their own assessments for on-going planning decisions. From
a broader perspective, the urban ecosystem analysis offers the
entire community a role in developing and maintaining its tree
canopy and improving environmental quality.
Urban Ecosystem Analysis: Bellevue Washington
3. 3
Quantifying Bellevue’s 2007 landcover and its ecosystem bene-
fits provides ecological opportunities for the future
In 2007, the city of Bellevue had a 36% overall tree canopy.
While this is higher than in many cities, it is less than
American Forests’ recommended 40%. When viewed from
a land use perspective, Bellevue’s existing canopy falls short
of American Forests’ recommendations in each category:
Urban residential (-5%), Suburban residential (-15%),
Central Business District (-8%), Commercial/Mixed Use
(-4%), and Industrial (-6%).
Trees slow stormwater runoff, decreasing the amount of
stormwater storage needed. In 2007 Bellevue’s tree canopy
provided 62 million cubic feet in stormwater detention serv-
ices, valued at $123 million.
• Public ROW and Park Open Space trees provide 16.7 mil-
lion cubic feet of stormwater retention services, valued at
$33 million.
• Trees on private property provide 42.5 million cubic feet
of stormwater retention services, valued at $ 94 million.
Trees improve air quality by removing nitrogen dioxide
(NO2), sulfur dioxide (SO2), carbon monoxide (CO),
ozone (O3) and particulate matter 10 microns or less
(PM10) in size. Bellevue’s tree canopy removes 687,000 lbs.
of these pollutants annually at a value of $1.55 million per
year.
Trees have a direct impact on the carbon footprint. Trees
help clean the air by storing and sequestering carbon. Total
storage and the rate at which carbon is stored (known as
sequestration) can be measured. Bellevue’s tree canopy
stores 332,000 tons of carbon in trees’ wood and sequesters
2,582 tons of carbon annually.
In 2007 Bellevue had 7,708 acres of tree canopy (36%),
although 2% of it had impervious paving underneath the
canopy which prevents stormwater infiltration. The city had
339 acres of shrubs (2%), 3,386 acres of open space with
grass and scattered trees (16%), 9,700 acres of impervious
surface (46%), 105 acres of bare soil (<1%), and 126 acres
of water (<1%).
American Forests Report
The City’s right of way (ROW) land has 3,895 acres, 20% of
which is currently in tree canopy and 12% in open space
with grasslands and scattered trees.
The City’s Park and Open Space land is comprised of 2,530
acres, 67% of which is currently in tree canopy.
Forest Landcover Change Trends
Bellevue is indicative of forest stand conversion trends seen in
many U.S. metropolitan areas over the last few decades.
American Forests has analyzed the tree cover in more than a
dozen metropolitan areas and documented changes. Over the
last 15 years, naturally forested areas in metropolitan areas,
have lost about 25% canopy cover while impervious surfaces
increased about 20%. American Forests recommended that
all metropolitan areas analyzed increase tree cover.
Communities can offset the ecological impact of land devel-
opment by planting trees and utilizing their natural capacity
to clean air and water and slow stormwater runoff.
For the 2008 Urban Ecosystem Analysis, American Forests ana-
lyzed contiguous forest change trends from 1985, 1996, 2001
and 2006. This new data updates the City’s forest change trend
information produced by American Forests in the “1998
Regional Ecosystem Analysis for the Puget Sound Metropolitan Area”.
The 2008 study used classified Landsat satellite imagery devel-
oped by the U.S Geological Survey, now considered the gold
standard for analyzing land cover change trends (Figure 1).
The Landsat data shows how rapidly forest was converted into
different uses over the last two decades. Due to the forest con-
version changes between 1996 and 2006, the City lost the abil-
ity to store 754,825 cubic feet of stormwater, valued at $1.5
million. A conservative $2 per cubic foot was used in the cal-
culations but anecdotally, according to recent stormwater con-
struction facilities in Bellevue, the cost is approximately $10
per cubic foot resulting in a loss of $15 million in stormwater
benefit. Bellevue’s tree canopy also lost $68,000 in annual air
pollution removal value, 14,527 tons of carbon storage and
113 tons of sequestration annually. The chronological analysis
provides valuable public policy information showing general
trends in landcover changes. Even though Bellevue’s rate of
tree canopy loss has declined since the 1980s, the City contin-
ues to lose trees and ecosystem services.
Bellevue Initial Year Ending Tree Tree Loss in Loss in Loss of Air Loss of Air Loss of Loss of
Tree Tree Canopy Canopy Stormwater Stormwater Pollution Pollution Carbon Carbon
Canopy Canopy Change Change Value Value Removal Removal Stored Sequestered
acres acres acres percentage cu. ft. @ $2/cu ft. $ lbs./yr Value $ tons tons/yr
1985-1996 4,108 3,609 -499 -12% -2,807,081 -$5,614,162 -44,548 -$100,176 -21,505 -167
1996-2006 3,609 3,271 -338 -9% -754,825 -$1,509,650 -30,093 -$67,669 -14,527 -113
Table 1. Forest Change in Ecosystem Services as Measured with Landsat Data
4. Forest Landcover Change Trends 1985-1996
4
Urban Ecosystem Analysis: Bellevue Washington
Figure 1: The images show the forest landcover change trends over two time periods. The area in red denotes forest loss between 1985 and 1996 (left) and
the forest loss between 1996 and 2006 (right).
Legend
Forest Loss 1985-1996
1996 Forest
5. Forest Landcover Change Trends 1996-2006
5
American Forests Report
Legend
Forest Loss 1996-2006
2006 Forest
6. 6
Urban Ecosystem Analysis: Bellevue Washington
Tree Canopy and Other Landcover
Ecosystem Benefits by Landuse
To better understand how tree canopy and other urban land-
cover impacts ecosystem benefits, higher resolution imagery
now allows us to examine trees in more detail within differ-
ent land uses. High-resolution, (2 foot) multi-spectral satel-
lite imagery taken in 2007 was classified into ten landcover
categories: trees; trees with an impervious understory;
shrubs; open space/grass/scattered trees; impervious sur-
faces general; impervious surface buildings/structures;
impervious paved; other impervious; bare soil; and water.
Landcover was also stratified into seven land use classes:
Urban Residential, Suburban Residential, Business District,
Commercial and Mixed Use, Industrial, Parks, and Rights of
Way (ROW), based on land use and ownership categories
within the City.
An Urban Ecosystem Analysis was conducted on each land
use’s landcover (Table 3 and 4). Table 4 lists American Forests’
recommendations for tree canopy goals for each land use. As
of 2007, Bellevue’s 36% overall tree canopy cover is 4% short
of American Forests’ recommended goals for urban areas east
of the Mississippi and in the Pacific Northwest (see
http://www.americanforests.org/resources/urbanforests/
treedeficit.php for more information on recommended tree
canopy goals). Each land use category also falls short of rec-
ommended goals.
These recommendations should be considered an initial ref-
erence point. Each municipality must designate its own tree
canopy goals based on their unique combination of existing
tree canopy, climate, geography, soils, planting potential, and
vision for the future.
Landcover was stratified into seven land use classes: Urban Residential,
Suburban Residential, Business District, Commercial and Mixed Use,
Industrial, Parks, and public Right of Way (ROW), based on land use
and ownership categories within Bellevue.
Citywide Urban Suburban Central Commercial Industrial Parks ROW
Residential Residential Business District & Mixed Use
Landcover 2007 % Land- 2007 % Land- 2007 % Land- 2007 % Land- 2007 % Land- 2007 % Land- 2007 % Land- 2007 % Land-
Acres cover Acres cover Acres cover Acres cover Acres cover Acres cover Acres cover Acres cover
Trees 7,708 36.1% 456.3 29.5% 4,932.0 35.4% 28.1 7.3% 465.4 20.6% 134.8 19.1% 1,691.4 66.9% 763.3 19.6%
Shrubs 339 1.6% 14.2 0.9% 99.4 0.7% .06 0.2% 25.6 1.1% 10.4 1.5% 188.4 7.4% 25.8 0.7%
Open space* 3,386 15.8% 136.6 8.8% 2,558.9 18.3% 5.8 1.5% 188.0 8.3% 51.1 7.3% 445.4 17.6% 464.6 11.9%
Impervious 9,713 45.5% 932.5 60.3% 6,209.8 44.5% 351.1 91.1% 1,556.9 68.8% 503.1 71.0% 159.9 6.3% 2,635.1 67.7%
Bare 105 0.5% 1.3 0.1% 71.1 0.5% 0.0 0.0% 10.6 0.5% 4.5 0.6% 17.8 0.7% 4.0 0.1%
Water 126 0.6% 5.2 0.3% 77.0 0.6% 0.1 0.0% 16.3 0.7% 0.9 0.1% 26.9 1.1% 2.3 0.1%
Total Acres 21,377 100% 1,546 100% 13,948 100% 386 100% 2,263 100% 705 100.0% 2,530.0 100% 3,895.2 100%
* Grass/scattered trees
Table 2. Bellevue 2007 High Resolution Data of Landcover by Landuse
Bellevue Land Use Classes
Parks Industrial
Suburban Residential Central Business District
Urban Residential Commercial & Mixed Use
7. 7
American Forests Report
Landcover Classification from 2007 High Resolution Imagery
Deciduous Trees Open Space Buildings & Structures Water
Evergreen Trees Bare Trees over Impervious
Shrub Paved Surfaces Other Impervious
36%
trees
46%
imperv.
2% other
16%
open
space
8. 8
Urban Ecosystem Analysis: Bellevue Washington
Ecosystem Values of Green
Infrastructure
A city’s pervious landcover serves as its green infrastructure
that provides many environmental benefits to a community
including slowing stormwater runoff, improving water quality,
protecting soil from erosion, improving air quality, and stor-
ing atmospheric carbon. Green infrastructure includes vege-
tation and their complex interactions with soil, air and water
systems. As defined in this project, green infrastructure
includes the land cover categories of tree canopy, shrub, open
space/grass/scattered trees, bare soil, and water.
Bellevue’s urban forest contributes to its multiple ecosystem ben-
efits(Table3).With7,708acresoftreecanopycitywide,Bellevue’s
urban forest manages 61,644,489 cubic feet of stormwater, valued
at $123.3 million, removes 687,129 lbs. of air pollutants annually,
valued at $1.6 million per year, stores 331,702 tons of carbon and
sequesters 2,582 tons of carbon annually.
Stormwater Ecosystem Services
Trees reduce the volume of stormwater runoff by capturing
some rain on their leaves and branches, which then evaporates
back into the atmosphere. Other water infiltrates into the soil
rather than running off the land which must be managed.
Bellevue’s urban forest manages 61,644,489 cubic feet of
stormwater, valued at $123.3 million using a conservative $2 per
cubic foot. Anecdotally, based on recent local stormwater con-
struction costs of $10-11 per cubic foot, the value of stormwater
management services could be much higher in Bellevue.
Water Quality Ecosystem Services
Tree roots absorb water pollutants; the impact of eight can be
calculated from the stormwater runoff changes: Biological
Oxygen Demand, Cadmium, Copper, Lead, Nitrogen,
Phosphorus, Suspended Solids, and Zinc. Citywide, water pollu-
tion, as measured in percent change in pollutant loading would
worsen by between 15% and 68% if trees were removed from
the land (a detailed graph of water pollutant loading per land
use resides in the map book that accompanies this report).
Air Quality Ecosystem Services
The ecological value of air quality ecosystem services is based
on the UFORE model developed by the U.S. Forest Service.
The dollar value is calculated based on externality costs to
society of the additional air pollution. Externality values are
established by State Service Commissions. Bellevue’s urban
forest removes 687,129 lbs. of air pollutants annually, valued at
$1.6 million per year.
Trees have a direct impact on the carbon footprint. Trees help
clean the air by storing and sequestering atmospheric carbon
in their wood. Total storage and the rate at which carbon is
stored (known as sequestration) can be measured. Bellevue’s
tree canopy stores 331,702 tons of carbon and annually
sequesters 2,582 lbs. of carbon.
While this analysis does not address tree health per se, it stands
to reason that the healthier the urban forest, the greater its’
potential for maximizing the ecosystem services it provides.
According to forest health sampling conducted by Bellevue
Park Department Forestry staff, the health of Bellevue’s natu-
ral areas and open space varies throughout the City. Site con-
dition range from healthy and sustainable to degraded sites
where new forest regeneration is minimal and forest succes-
sional processes have been disrupted by invasive plants.
American Forests urges the City to continue its aggressive pro-
gram of management of public trees as well as launching a
public education program for tree care on private property to
improve the health of the entire urban forest.
Air Air Pollution Stormwater
2007 Tree Pollution Removal Carbon Carbon Stormwater Value @$2
Area Canopy Removal Value Stored Sequestered Value per cu. ft.
acres acres lbs./ yr dollar value tons tons/ yr cu. ft. dollar value
City of Bellevue 21,377 7,708 687,129 $1,545,150 331,702 2,582 61,644,489 $123,288,978
Urban res. 1,546 456 40,679 $91,476 19,637 153 4,049,992 $8,099,983
Suburban res. 13,948 4,932 439,642 $988,625 212,231 1,652 39,135,381 $78,270,761
Business District 386 28 2,503 $5,629 1,209 9 197,272 $394,544
Commercial & Mixed Use 2,263 465 41,482 $93,280 20,025 156 4,153,951 $8,307,902
Parks 2,530 1,691 150,769 $339,034 72,781 567 10,325,002 $20,650,005
ROW 3,895 763 68,045 $153,014 32,848 256 6,379,182 $12,758,365
Industrial 705 135 12,015 $27,018 5,800 45 1,281,229 $2,562,459
Note that the sum of the land uses stormwater values doesn't total to the citywide value. This is because the each land use has a specified soil type, whereas citywide, soil type must be generalized for the entire area.
Table 3. Bellevue Ecosystem Services
Percent Change in Contaminant Loadings
9. Table 4. Tree Canopy Percentage by Land Use
9
American Forests Report
Modeling Ecosystem Benefits of
Recommended Tree Canopy
Percentages
By increasing tree canopy cover to recommended goals, the
city will increase their environmental services that tree canopy
provides. The additional tree canopy percentage in each land
use category was modeled to demonstrate these added eco-
logical and economic benefits. Table 5 details ecosystem serv-
ices of increasing tree canopy by decreasing impervious paved
surfaces and changing impervious surface under trees to per-
vious surfaces.
If Bellevue increased its canopy cover by 4% overall, the
ecosystem services would add an additional $169,000 in annu-
al air pollutant removal value, an additional 36,000 tons of car-
bon stored and an annual 282 tons of carbon sequestered, as
well as 4.4 million cubic feet of additional managed stormwa-
ter, valued at $8.7 million. If tree canopy were increased in the
ROW from 20% to 25% by reducing impervious surface, the
additional tree canopy would provide an additional 1.9 mil-
lion cubic feet in stormwater management capacity, valued at
$3.7 million.
Modeling demonstrates the benefits of changing impervious
surface to pervious for controlling stormwater runoff. For
example, in the central business district, if the 15.5 acres of
trees with an impervious surface understory were changed so
that the same trees had a pervious understory allowing storm
water to infiltrate into the soil rather than rolling off paved
surfaces, an additional 131,408 cubic feet of stormwater would
be managed, valued at $262,816.
Recommendations
This project has quantified the City of Bellevue’s green infra-
structure—its landcover and corresponding ecosystem servic-
es. This digital data is packaged into a GIS interactive data
layer compatible with existing GIS data so that City staff can
use it in future planning decisions. American Forests recom-
mends that the data and CITYgreen®
software be used to run
landcover scenarios, establish citywide tree canopy goals,
quantify the progress made with current and new tree initia-
tives, and educate the public about the value of protecting and
increasing tree canopy on private property.
Goals for Citywide Tree Cover
Establish unified tree canopy goals for the entire City and stratify
these goals for land use categories. Base these goals on City man-
dates for achieving environmental goals for air and water.
Incorporate these goals into planning and development policies.
Use American Forests’ canopy goals for the Pacific
Northwest as a guide, but the City should develop its own
goals and specific strategies to increase canopy cover and
ecosystem services citywide.
• 40% citywide
• 50% in suburban residential
• 35% in urban residential
• 25% in commercial and mixed use
• 25% in industrial
• 15% in the central business district
If Bellevue land use zones increased Stormwater Air Air Pollution
its canopy cover to recommended Additional Stormwater Value @ $2 Pollution Removal Carbon Carbon
percentages, ecosystem services % Canopy Value per cu. ft. Removal Value Stored Sequestered
would increase by: cu. ft. dollar value lbs./ yr. dollar value tons tons/ yr.
Citywide 4% 4,358,258 $8,716,516 75,112 $168,904 36,259 282
Urban residential 5% 752,822 $1,505,643 8,936 $20,092 4,313 34
Suburban residential 15% 12,188,102 $24,376,204 182,033 $409,337 87,874 684
Business District 8% 342,357 $684,714 2,653 $5,965 1,280 10
Commercial & Mixed Use 4% 858,868 $1,717,735 8,947 $20,119 4,319 34
Industrial 6% 341,551 $683,102 3,691 $8,299 1,782 14
Business District w/ pervious understory 0% 131,408 $262,816 2,475 $5,565 1,195 9
ROW 5% 1,863,351 $3,726,701 18,760 $42,185 9,056 71
Note that Business District w/impervious surface doesn't add tree canopy, it changes the understory to pervious and in doing so, increases its ecosystem benefits as listed.
Note these landuses do not include park land
Table 5. Modeling the Ecosystem Benefits of Increasing Tree Canopy to Recommended Percentages
Citywide Urban Suburban Central Commercial Industrial Parks ROW
Residential Residential Business District & Mixed Use
Canopy % 36% 30% 35% 7% 21% 19% 67% 20%
AF Recommended
Canopy % 40% 35% 50% 15% 25% 25% 25% 25%
Difference in
Canopy % -4% -5% -15% -8% -4% -6% -5% -5%
10. Develop a three pronged approach for increasing tree canopy
cover within three land ownership categories:
1. City Parks and Open Space- Use the green data layer and
CITYgreen to document the ecosystem services provided by existing
forest and tree management programs and new strategies to protect
environmental quality within different city departments
Health of the Urban Forest
• Along with enhancing the size of the urban forest it is also
important to improve the health of the existing urban for-
est to maximize its potential to provide ecosystem services.
• Through aggressive and proactive forest management
practices, raise tree health for all classes of tree canopy to
a healthy and sustainable state.
Share the green data layer provided with this project with
other city departments concerned with related ecosystem
services. For example, Bellevue’s stream buffers play an
important role in providing a non-structural water quality
best management practice. In 2007, Bellevue had 1,291
acres of stream buffers 64% of which was tree canopy. The
combined ecosystem benefits provided $166,241 in air pol-
lution reduction value, stored 35,687 tons of carbon,
sequestered 278 tons of carbon annually, and reduced 6.9
million cubic feet of stormwater runoff, valued at $13.7 mil-
lion.
Use the modeling capabilities of CITYgreen software for
planning. Test the impacts of changing tree canopy, imper-
vious surfaces, and other land covers under different devel-
opment scenarios.
2. Private - Launch a public education campaign to increase public
awareness of the direct relationship between environmental quality
and tree canopy and encourage private citizens to plant trees on pri-
vate property
Use analysis findings in popular media to educate the pub-
lic about the importance of their role in increasing the
urban forest and the positive impact planting on private
property will make.
Incorporate CITYgreen schools program into public
schools to increase awareness of environmental issues, by
teaching practical applications of GIS, math, science and
geography. Curriculum is available through American
Forests.
Implement a pro-active public education program so that
the general public can contribute to protecting and enhanc-
ing the City’s urban forest ecosystem by implementing best
management practices, planting, and maintaining trees on
private property.
3. Public ROW- With almost 4,000 existing acres of land provides a
good opportunity to increase tree canopy on existing public land with
an active planting program.
Provide more pervious paving in areas where there is imper-
vious understory for tree canopy. This will improve the
stormwater reduction function of the existing tree canopy.
For example in the Central Business District, if the 15.5
acres (4%) of existing trees that currently have an impervi-
ous understory were given pervious ground surface, it
would further reduce stormwater runoff by 131,000 cubic
feet, valued at $262,816.
Initiate an active public tree planting program to meet
increased canopy goals within ROW land. A 5% increase in
ROW tree canopy can provide an additional 1.9 million
cubic feet in stormwater runoff mitigation, valued at $3.7
million.
10
Urban Ecosystem Analysis: Bellevue Washington
Strategies for Increasing Canopy Cover and the Benefits of Bellevue’s Urban Forest
11. American Forests Report
11
Right of Way Landcover Classification from 2007 High Resolution Imagery
Deciduous Trees Open Space Buildings & Structures Water
Evergreen Trees Bare Trees over Impervious
Shrub Paved Surfaces Other Impervious
12. American Forests, P.O. Box 2000, Washington D.C. 20013
Phone: 202/737-1944; Fax: 202/737-2457; Web: www.americanforests.org
About the Urban Ecosystem Analysis
American Forests Urban Ecosystem Analysis is based on the
assessment of “ecological structures”—unique combinations
of land use and land cover patterns. Each combination per-
forms ecological functions differently and is therefore
assigned a different value. For example, a site with heavy tree
canopy provides more stormwater reduction benefits than one
with lighter tree canopy and more impervious surface.
Data Used
American Forests calibrated land cover change based on the
USGS 2001 National Landcover Dataset (NLCD) to update
the prior Urban Ecosystem Analysis (UEA) rather than updat-
ing the 1996 data from the original UEA. Imagery and classifi-
cation techniques have changed substantially since the initial
analysis. The U.S. Geological Survey’s data is now the standard
for Landsat-derived land cover change analysis. Imagery of
Bellevue were classified from 1985, 1990, 1996, 2001, and 2006
and land cover change trends were quantified and document-
ed. American Forests classified the imagery into four land
classes: trees, urban, open space, and water.
For the high resolution imagery, Sanborn, American Forests’
geospatial partner, acquired 4-inch resolution, true-color aerial
photography in the late spring of 2007 and resampled the data
to a 2ft. pixel resolution. Sanborn then conducted a knowledge-
based classification to divide the landcover into ten categories:
deciduous trees, evergreen trees, trees over impervious surfaces,
shrubs, open space/grass/scattered trees, other impervious sur-
faces (such as gravel parking lots), impervious surfaces (build-
ings), impervious surfaces (paved), bare soil, and water. Sanborn
also created a separate impervious layer utilizing building and
street data provided by the city of Bellevue. This layer was essen-
tial in identifying tree canopy with impervious understory.
Analysis Formulas
Urban Ecosystem Analyses were conducted using CITYgreen
software. CITYgreen for ArcGIS used the raster data land
cover classification from the high-resolution imagery for the
analysis. The following formulas are incorporated into
CITYgreen software.
TR-55 for Stormwater Runoff: The analysis estimates the amount
of stormwater that runs off a land area during a storm. The
stormwater runoff calculations incorporate volume of runoff
formulas from the Urban Hydrology of Small Watersheds
model (TR-55) developed by the U.S. Natural Resources
Conservation Service (NRCS), formerly known as the U.S. Soil
Conservation Service. Don Woodward, P.E., a hydrologic engi-
neer with NRCS, customized the formulas to determine the
benefits of trees and other urban vegetation with respect to
stormwater management.
L-THIA for Water Quality: Using values from the U.S.
Environmental Protection Agency (EPA) and Purdue
University’s Long-Term Hydrological Impact Assessment (L-
THIA) spreadsheet water quality model, The Natural
Resources Conservation Service (NRCS) developed the
CITYgreen water quality model. This model estimates the
change in the concentration of the pollutants in runoff dur-
ing a typical storm event given the change in the land cover
from existing trees to a no tree condition. This model esti-
mates the event mean concentrations of nitrogen, phospho-
rus, suspended solids, zinc, lead, copper, cadmium,
chromium, chemical oxygen demand (COD), and biological
oxygen demand (BOD). Pollutant values are shown as a per-
centage of change.
UFORE Model for Air Pollution: CITYgreen®
uses formulas from
a model developed by David Nowak, PhD, of the USDA Forest
Service. The model estimates how many pounds of ozone, sul-
fur dioxide, nitrogen dioxide, and carbon monoxide, and par-
ticulate matter less than 10 microns are absorbed and filtered
by tree canopies. The urban forest effects (UFORE) model is
based on data collected in 55 U.S. cities. Dollar values for air
pollutants are based on averaging the externality costs set by
the State Public Service Commission in each state. Externality
costs are the indirect costs to society, such as rising health care
expenditures as a result of air pollutants’ detrimental effects
on human health. The UFORE model also estimates carbon
storage capacity and annual amount of carbon sequestered by
tree canopy in a given area.
Acknowledgements for this Study
We gratefully acknowledge the support of the City of Bellevue
staff in conducting this study.
For More Information
AMERICAN FORESTS, founded in 1875, is the oldest nation-
al nonprofit citizen conservation organization. Its three cen-
ters–Global ReLeaf, Urban Ecosystem Center, and Forest
Policy Center–mobilize people to improve the environment
by planting and caring for trees.
AMERICAN FORESTS’ CITYgreen®
software provides individ-
uals, organizations, and agencies with a powerful tool to eval-
uate development and restoration strategies and impacts on
urban ecosystems. AMERICAN FORESTS offers regional
training, teacher workshops and technical support for
CITYgreen®
and is a certified ESRI developer and reseller of
ArcGIS products.