SlideShare une entreprise Scribd logo
1  sur  15
Télécharger pour lire hors ligne
Tue
Sep 2
2008
ISI INTERNATIONAL STRATEGY & INVESTMENT
Portfolio Strategy Report
1 of 15
François Trahan 212 446 5634 ftrahan@isigrp.com
Kevin Cheng 212 446 5630 kcheng@isigrp.com
Brian J. Herlihy 212 446 9421 bherlihy@isigrp.com
Michael J. Kantrowitz, CFA 212 446 5632 mkantrowitz@isigrp.com
Market Implications of a 28-Year Low in U.S. Real Rates
We have made a big deal of the new cycle lows in Asian equity markets in recent months. Indeed, we
believe this is a sign of things to come for growth in that part of the world and for commodity prices by
the same token. As such, we expect U.S. inflation trends to ease in the coming months, a
development that is likely to support the domestic economy and in turn the stock market. Today, we
highlight another likely influence for U.S. equities ahead: negative real rates. In fact, real rates today
are the most negative they have been in almost three decades! This development is one of significant
importance in our view – one that should not be ignored. Investors should always pay attention when a
measure of monetary policy sits at three-decade extremes. Remember the 1% Fed Funds rate in 2003
and what it did for housing? Well, we expect real rates to have a similar impact ahead.
Deep Negative Real Rates Typically Anchor Economic Prospects
Real rates tend to
foreshadow trends
in leading
indicators …
40
44
48
52
56
60
64
1992 1993 1994 1995 1996 1997 1998 1999 2000 2001 2002 2003 2004 2005 2006 2007 2008 2009 2010 2011
-5%
-4%
-3%
-2%
-1%
0%
1%
2%
3%
4%
5%
6%
7%
Average of Mfg and Services ISMs (L) Real Fed Funds Rate (Inverted, Adv. 12m, R)
?
Real rates most negative in 28 years!
… most
importantly,
equities!
Source: ISI Portfolio Strategy. Real Fed Funds Rate = Fed Funds Target Rate – CPI (YoY % Chg).
Entering September, the overall mood is still a very bearish one. Investors are having trouble seeing
the light at the end of the sub-prime tunnel. We wonder whether the investment community is under-
appreciating the amount of stimulus in the pipeline and what it might mean for growth going forward
(i.e., 2009/2010). The U.S. yield curve is now the steepest of the industrialized world while real rates,
a great long-term leading indicator of growth, sit at 28 year lows! It is quite remarkable and
something we plan to highlight more of in the coming weeks. The chart above shows the historic
relationship between real rates and U.S leading indicators. Real rates tend to lead economic
prospects by roughly a year. This argues that economic prospects, and equities by the same token,
are about to find a footing and possibly a sustained rally. If you are going to read just one report from
us for the remainder of 2008, this is the one to read.
2
9/2 ISI Group
The Underpinnings Of Real Rate Theory
The underlying driver behind “real rate theory” begins with the spending choices of both
businesses and consumers alike. Each day consumers and businesses face the decision
whether to save or spend money. As the chart below shows, in negative real rate environments
the incentive differential between spending and saving are significant.
In the following example we begin with a simplistic case that consumers (or businesses) can
either spend or save $100. We’ll first begin with the savings side of the equation. On that $100, a
consumer can earn about $2 of interest over the course of the year, resulting in about $102
worth of nominal value by the end of the year. However, after accounting for the differences in
inflation of roughly 5%, the real purchasing power of that $102 actually decreases overall.
The Economic Dynamic Of Negative Real Rates
Disincentive
to save!
*Assumes: inflation = 5%, interest rates = 2%
t(1): $102 (nominal) t(1): $105 (nominal)
own 1 widgetcan purchase 0.97 widget
t(0): $100
(Purchase widget)
t(1): $100 (real)
t(0): $100
Interest: +$2
Inflation: -$5
t(1): $97 (real)
<
Save
Spend
(Purchase Goods)
Business / Consumer
t(0): $100
Interest: +$2
Inflation: -$5
t(1): $97 (real)
t(1): $102 (nominal)
can purchase 0.97 widgets
t(0): $100
(Purchase widget)
t(1): $100 (real)
t(1): $105 (nominal)
own 1 widget
Incentive
To spend!
Source: ISI Portfolio Strategy.
In contrast, if a consumer decides to purchase a ok, per say a $100 widget, then in one year’s
time that consumer would still have $100 of real value represented by the ownership of the
widget (assuming no depreciation). However, the difference here is that the same widget that the
consumer “could” have bought last year now costs $105 due to the effects of inflation.
Overall the consumer, who chose to save rather than spend, now cannot purchase a widget
outright as any gains on interest have been entirely offset by the effects of inflation. When
analyzing both these scenario outcomes, it is clear that the consumer is actually better off
spending rather than saving. In negative real rate environments, consumers typically increase
consumption and prefer “hard assets” as their real purchasing power otherwise erodes over time.
In short, this shifts consumption forward as consumers buy more goods in the present (versus
future consumption) as those goods are likely to cost more (due to the effects of inflation) if they
were to delay those purchases into the future.
3
9/2 ISI Group
As the diagram below illustrates, businesses also have choices similar to consumers. In negative
real rate environments, businesses are likely to increase inventories as they will expect costs to
rise in the coming quarter. By increasing their inventories they have a potential to expand
operating margins, holding all else equal. Moreover, there is not much incentive to hold much
cash on the balance sheet as the negative real rate environment erodes the value of it. In
addition, because interest costs are typically low during these times, businesses have an
incentive to take on debt and increase capital expenditures.
Negative Real Rates Historically Followed By An Increased Appetite For Hard Assets
Typical Reaction To
Negative Real Rates
Consumers Businesses
Decrease
Savings
Increase
Consumption
Increase
Inventories
Increase Capital
Expenditures
Source: ISI Portfolio Strategy.
The chart below demonstrates the consumer side of the negative real rates equation. As illustrated,
two of the largest consumer-sensitive sectors, namely the auto and housing industries, both
performed exceptionally well in the wake of prior negative real rates environments. This reinforces
the view that negative real rates are positive for overall consumption and spending and moreover,
increases demand for hard assets. This dynamic has worked well for nearly the past two decades,
and we think that it is likely to be maintained going forward. In short, the real rate environment
suggests a rebound in leading consumption indicators in the near term.
Consumption Typically Recovers Following A Decline In Real Rates
-10
-6
-2
2
6
10
14
18
1989 1991 1993 1995 1997 1999 2001 2003 2005 2007 2009 2011
-6%
-4%
-2%
0%
2%
4%
6%
LEI Mfg new orders: consumer goods and materials (YoY % chg, 3-mth m.a., L)
Real Fed Funds Rate (Inverted, Adv. 12m, R)
?
Auto Boom! Housing Boom! ____ Boom!?
Leading
consumption
indicators about
to bottom?
Source: ISI Portfolio Strategy.
4
9/2 ISI Group
From a business perspective, one of the incentives to increasing inventory levels during negative
real rate environments is margin expansion. Businesses can accomplish this by stockpiling raw
materials in order to avoid future price increases (thus effectively reducing their cost of goods
sold). Referring to our previous example, widget producers could stock pile rubber in their
inventory in order to avoid future cost increases. Thus the increase in inventory combined with
higher revenues (due to inflation) would in turn result in margin expansion (assuming all else
equal). As the chart below demonstrates, businesses have typically increased inventories in the
past during times when real rates have become increasingly negative.
Inventories Frequently Rise Following A Decline In Real Rates
36
41
46
51
56
1988 1990 1992 1994 1996 1998 2000 2002 2004 2006 2008 2010
-5%
-4%
-3%
-2%
-1%
0%
1%
2%
3%
4%
5%
6%
ISM: Business Inventories (3-mth m.a.) Real Fed Funds Rate (Inverted, Adv. 12m, R)
Inventories peaked about a year
past the low in real rates!
?
Corporations
often hedge
against negative
real rates by
holding inventory.
Source: ISI Portfolio Strategy.
Another benefit for businesses, during negative rate environments, is the relatively cheap cost of
financing as well as an incentive to improve firm efficiency through capital expenditures. As the
chart below demonstrates, this correlation has also held up well since 1990. Overall, the
relatively long lead time between capital expenditures and real rates implies that capex is likely
to find a footing sometime in 2009 and recover in 2010.
Capex Also Responds To Negative Real Rates But With A Longer Lag
-16
-12
-8
-4
0
4
8
12
16
20
24
1990 1992 1994 1996 1998 2000 2002 2004 2006 2008 2010
-4%
-3%
-2%
-1%
0%
1%
2%
3%
4%
5%
Nonresidential Investment ex-tech (YoY % chg, L) Real Fed Funds Rate (Inverted, Adv. 24m, R)
Look for Capex to
recover in 2010
Capex typically peaks two years
following the low in real rates!
?
Capex to find a
footing in 2009
and recover in
2010?
Source: ISI Portfolio Strategy.
5
9/2 ISI Group
Negative Real Rates: An Upcoming Catalyst For Equity Markets?
As the chart below demonstrates, the sharp change in real rates (into negative territory) implies
that leading economic indicators are likely to find their footing in the coming months. In the past,
leading indicators have shown a fairly close correlation to real rates and have typically recovered
about 12 months following a decline in real rates. On balance, negative real rates are a catalyst
for both business and consumer spending alike, which is especially important given that the U.S.
consumer accounts for roughly 70% of GDP growth. Overall, this implies a pickup in leading
indicators ahead of the eventual recovery in economic growth.
Lower Real Rates Eventually Create A Tailwind For Leading Indicators
-8
-6
-4
-2
0
2
4
6
8
10
12
14
1988 1990 1992 1994 1996 1998 2000 2002 2004 2006 2008 2010
-5%
-3%
-1%
1%
3%
5%
LEI (YoY % chg, L) Real Fed Funds Rate (Inverted, Adv. 12m, R)
Leading indicators typically recover a
year following a decline in real rates
Negative real
rates argue for an
upcoming
inflection point in
leading economic
indicators.
Source: ISI Portfolio Strategy.
In the diagram below, we have laid out the pathway towards a better economy … it all begins
with real rates! As we have previously demonstrated, a negative real rate environment typically
spurs consumer and business spending. The uptick in spending then helps drive an increase in
inventories and capex spending which eventually results in an improvement in the economy.
Negative Real Rates and Their Impact on the Equity Market
leads to… leads to… discount …
Negative Real Rates ▼  U.S. Leading Index ▲ U.S. Equity Multiples ▲
Better Economy
in H209 / 2010
The improvement in leading indicators is representative of future growth which is likely to be
simultaneously reflected in equity multiple expansion. After all, higher future growth rates are
typically justified by higher multiples. Overall both of these indicators suggest a better economy
in the 2nd
half of 2009 and 2010. For the equity investor, negative real rates is a catalyst that will
likely lift equity markets over the next 12 months as markets begin to look beyond the current
slowdown and into the recovery ahead.
6
9/2 ISI Group
Given that the negative real rate environment suggests a rebound in leading indicators, we went
back through to the last business cycle trough to see how leading indicators trended against
S&P forward multiples. As the chart below demonstrates, during the most recent cycle the peak
and trough of the series correlated very closely to S&P forward multiples. Accordingly, we expect
this relationship to be maintained as both indicators begin to trend higher.
Economic Prospects and P/E Multiples Go Hand In Hand
-6%
-4%
-2%
0%
2%
4%
6%
8%
10%
12%
2003 2004 2005 2006 2007 2008 2009 2010
12.0x
12.5x
13.0x
13.5x
14.0x
14.5x
15.0x
15.5x
16.0x
16.5x
17.0x
17.5x
18.0x
18.5x
19.0x
Leading Index (YoY % Chg, L) S&P 500 12-Month Forward P/E Multiple (R)
?
Will multiples / LEI follow the
path laid by real rates?
Multiples and leading
indicators likely to peak
and trough in tandem.
Improving
economic
prospects
typically lead to
higher equity
multiples.
Source: ISI Portfolio Strategy.
One of the primary drivers behind this tight relationship between real rates and forward multiples
stems from the strong correlation between real rates and operating earnings growth. As the chart
below demonstrates, real rates have typically served as a robust leading indicator (by roughly 15
months) for earnings growth. In short, a more constructive earnings growth environment
warrants higher multiples – both messages which are reinforced by the current negative real rate
environment.
Lower Real Rates… A Harbinger Of Stronger Earnings Growth!
-40
-30
-20
-10
0
10
20
30
40
50
1992 1994 1996 1998 2000 2002 2004 2006 2008 2010 2012
-4%
-3%
-2%
-1%
0%
1%
2%
3%
4%
5%
S&P 500 Operating EPS (LTM, YoY % chg, L) Real Fed Funds Rate (Inverted, Adv. 15m, R)
?
An end to the
earnings growth
deterioration
ahead?
Source: ISI Portfolio Strategy.
7
9/2 ISI Group
Sector Implications: Rotation From Late-Stage to Rate-Sensitives
In light of our analysis on real rates and the economy, the question that portfolio managers may
want answered is – which sectors are the primary beneficiary of a negative real rate
environments? To answer this we analyzed the S&P 500 to find stocks whose relative
performance has closely moved with trends in real rates. We then constructed a portfolio of
stocks with the strongest past relationships. The chart below highlights the sectors exposures in
our Real Rates Portfolio (RRP), or those likely to see the biggest relative gains in a post-negative
real rate environment. The charts below contrast the weightings in the RRP versus the S&P 500.
S&P 500 Sector Exposure Real Rates Portfolio Sector Exposure
Discretionary
8%
Financial
14%
Health Care
13%
Staples
12%
Technology
17%
Telecom
3%
Materials
4%
Industrials
11%
Utilities
4%
Energy
14%
Discretionary
40%
Financial
21%
Health Care
14%
Staples
14%
Energy
0%
Utilities
0%
Industrials
0%
Materials
0%
Telecom
0%
Technology
11%
Source: ISI Portfolio Strategy.
Overall, our analysis concluded that in negative real rate environments, early cyclicals and rate
sensitive sectors typically benefit the most, namely consumer discretionary and financials. In the
table below, we ranked the absolute sector weightings in our real rate portfolio against those of
of the S&P 500. Two notable observations from our RRP are that there is a zero weighting given
to late-stage cyclicals such as Materials and Energy, while Consumer Discretionary and
Financials account for 60% of the optimal real rate portfolio.
Sector Weights In The Real Rates Portfolio (RRP)
The Real Rates
Portfolio is
heavily weighted
towards Early
Cyclical sectors.
Rank
S&P 500
Weight
Real Rate
Portfolio
Discretionary 1 8.4% 39.3%
Financial 2 14.4% 21.4%
Health Care 3 12.9% 14.3%
Staples 4 11.5% 14.3%
Technology 5 16.8% 10.7%
Materials 6 3.7% 0.0%
Telecom 7 3.1% 0.0%
Industrials 8 11.4% 0.0%
Utilities 9 3.7% 0.0%
Energy 10 14.0% 0.0%
Source: ISI Portfolio Strategy.
Real Rates
Portfolio heavily
weighted towards
rate sensitives
Discretionary and
Financials make up
60% of the RRP.
Zero weight is
given to late-stage
cyclicals!
8
9/2 ISI Group
In essence the real rate environment suggests that investors overweight early cyclicals and
underweight late-stage cyclicals. Moreover, this relationship is also exemplified within sectors as
well. In the chart below, we illustrate this thematic trade with the relative performance of both the
Discretionary and Utilities sectors. As you can see from the performance, the thematic trade from
defense to offense follows the path of the real rates very closely.
This Thematic Trade Suggests Switch From Defense To Offense
Real Rates
inter-sector
trade idea:
Overweight
Discretionary
+
Underweight
Utilities 0.80
1.00
1.20
1.40
1.60
1.80
2.00
2.20
2.40
2.60
1990 1992 1994 1996 1998 2000 2002 2004 2006 2008 2010 2012
-4%
-3%
-2%
-1%
0%
1%
2%
3%
4%
5%
6%
Discretionary vs. Utilities Real Fed Funds Rate (Inverted, Adv 12m, R)
?
Negative real rate
environment
typically favor
early cyclicals
between sectors.
Source: ISI Portfolio Strategy.
Furthermore, not only does this thematic trade work on a sector to sector basis but also on an
intra-sector basis. In the following chart, we’ve highlighted two sub-industry groupings within the
industrials complex, namely the Trucking and Railroads industries. As one can see, the negative
real rate environment is exceptionally conducive to Trucking outperformance versus Railroads –
thus reinforcing the thematic trade suggested by the current real rate environment (i.e., early
cyclicals versus late-stage cyclicals).
Real Rates Current Path Suggests Trucking To Outperform Railroads
Real Rates
intra-sector
trade idea:
Overweight
Trucking
+
Underweight
Railroads 0.30
0.40
0.50
0.60
0.70
0.80
0.90
1.00
1993 1995 1997 1999 2001 2003 2005 2007 2009 2011
-4%
-3%
-2%
-1%
0%
1%
2%
3%
4%
5%
Trucking vs. Railroads Real Fed Funds Rate (Inverted, Adv 12m, R)
Trucking typically outperform Railroads
following a decline in real rates!
?
Negative real rate
environment
typically favor
early cyclicals
within sectors.
Source: ISI Portfolio Strategy.
9
9/2 ISI Group
Introducing The Real Rates Portfolio
The usefulness of the negative real rate environment remains extremely interesting as a stock
screening / selection tool. The list below contains S&P 500 stocks whose relative performance
has most closely moved with trends in real rates. If these historic relationships hold, the list
below contains some of the likeliest outperformers over the next 12 months.
Symbol Company Name
Price
($, 8/29)
PE
(TTM)
Price to
Book
Market
Value (M)
Consumer Discretionary
CTX Centex Corp 16.22 N/A 0.8 $1,813.9
FDO Family Dollar Stores 24.92 16.1 2.7 $3,254.9
HAR Harman International Inds 34.03 19.6 1.8 $2,399.0
HRB Block H & R Inc 25.54 18.3 8.0 $7,931.8
JNY Jones Apparel Group Inc 19.86 26.8 0.7 $1,396.1
KBH Kb Home 20.80 N/A 1.1 $1,363.5
LIZ Liz Claiborne Inc 16.21 N/A 0.9 $1,238.5
ODP Office Depot Inc 7.04 9.5 0.6 $1,869.9
PHM Pulte Homes Inc 14.51 N/A 0.9 $3,143.0
STZ Constellation Brands 21.11 N/A 1.6 $4,683.4
WEN Wendy'S International Inc 24.27 32.6 2.5 $2,021.8
Financials
GGP General Growth Pptys Inc 25.93 103.8 3.7 $7,337.0
MCO Moody's Corp 40.66 19.7 N/A $8,481.6
PGR Progressive Corp-Ohio 18.47 12.7 2.8 $13,676.8
SOV Sovereign Bancorp Inc 9.66 N/A 0.8 $6,308.3
SPG Simon Property Group Inc 94.88 45.8 7.9 $20,845.7
VNO Vornado Realty Trust 99.46 29.8 2.6 $14,630.2
Health Care
CVH Coventry Health Care Inc 35.02 9.6 1.6 $5,364.9
DGX Quest Diagnostics Inc 54.05 17.3 2.8 $10,370.5
PDCO Patterson Companies Inc 32.54 19.4 3.8 $3,821.2
UNH Unitedhealth Group Inc 30.45 10.0 1.8 $33,976.8
Consumer Staples
DF Dean Foods Co 25.17 30.2 5.7 $3,244.5
MKC Mccormick & Company Inc 40.45 21.0 4.2 $5,171.1
SYY Sysco Corp 31.83 17.5 5.0 $17,018.4
WFMI Whole Foods Market Inc 18.31 17.4 2.1 $3,110.1
Information Technology
NSM National Semiconductor Corp 21.43 16.7 24.7 4,873$
SNDK Sandisk Corp 14.46 24.5 0.6 3,173$
SYMC Symantec Corp 22.31 34.8 1.6 17,650$
Real Rates Portfolio
As we had previously mentioned, the real rate portfolio is heavily weighted towards Consumer
Discretionary names and Financials. Drilling down further within those two sectors, the industries
with the highest exposure include household durables (notably homebuilding), textiles apparel &
luxury goods and real estate investment trusts.
Within Financials, we have found that negative real rates are supportive of the REITs and
Insurance industries while they tend to be a headwind to money center banks (note the
constituents of the Real Rate Portfolio). Therefore, we are creating a barbell approach to sector
positioning within Financials by upgrading the REITs and Insurance industries to market weight,
while leaving money-center banks at an underweight position.
S&P 500 stocks
whose relative
performance has
closely moved with
trends in real rates.
10
9/2 ISI Group
Select Stocks From The Real Rates Portfolio
The following page contains select stocks within the S&P 500 that have the best correlation to
negative real rates, in our opinion. Nearly every one of these companies has been
underperforming for a number of months. Given the historic relationship with real rates, many of
these stocks have the potential to be among the strongest performers over the next year.
KB Home. (KBH) Office Depot Inc. (ODP))
1988 1990 1992 1994 1996 1998 2000 2002 2004 2006 2008 2010
-4
-3
-2
-1
0
1
2
3
4
5
-2.2
-2.1
-2.0
-1.9
-1.8
-1.7
-1.6
-1.5
-1.4
-1.3
-1.2
KB Home (KBH) Consumer Discretionary - Household Durables
Real Rates (inverted, advanced 12 months) (Left) KBH Relative Performance to S&P 500 (EW) (Right)
1988 1990 1992 1994 1996 1998 2000 2002 2004 2006 2008 2010
-4
-3
-2
-1
0
1
2
3
4
5
-2.4
-2.2
-2.0
-1.8
-1.6
-1.4
Office Depot Inc. (ODP) Consumer Discretionary - Specialty Retail
Real Rates (inverted, advanced 12 months) (Left) ODP Relative Performance to S&P 500 (EW) (Right)
Source: ISI Portfolio Strategy.
Symantec Corp. (SYMC) SanDisk Corp. (SNDK)
1988 1990 1992 1994 1996 1998 2000 2002 2004 2006 2008 2010
-4
-3
-2
-1
0
1
2
3
4
5
-2.8
-2.6
-2.4
-2.2
-2.0
-1.8
-1.6
Symantec Corp. (SYMC) Information Technology - Software
Real Rates (inverted, advanced 12 months) (Left) SYMC Relative Performance to S&P 500 (EW) (Right)
1988 1990 1992 1994 1996 1998 2000 2002 2004 2006 2008 2010
-4
-3
-2
-1
0
1
2
3
4
5
-2.8
-2.6
-2.4
-2.2
-2.0
-1.8
-1.6
-1.4
-1.2
SanDisk Corp. (SNDK) Information Technology - Computers & Peripherals
Real Rates (inverted, advanced 12 months) (Left) SNDK Relative Performance to S&P 500 (EW) (Right)
Source: ISI Portfolio Strategy.
Coventry Health Care (CVH) UnitedHealth Group (UNH)
1988 1990 1992 1994 1996 1998 2000 2002 2004 2006 2008 2010
-4
-3
-2
-1
0
1
2
3
4
5
-2.6
-2.4
-2.2
-2.0
-1.8
-1.6
-1.4
Coventry Health Care Inc. (CVH) Health Care - Health Care Providers & Services
Real Rates (inverted, advanced 12 months) (Left) CVH Relative Performance to S&P 500 (EW) (Right)
1988 1990 1992 1994 1996 1998 2000 2002 2004 2006 2008 2010
-4
-3
-2
-1
0
1
2
3
4
5
-3.2
-3.0
-2.8
-2.6
-2.4
-2.2
-2.0
-1.8
-1.6
-1.4
UnitedHealth Group Inc. (UNH) Health Care - Health Care Providers & Services
Real Rates (inverted, advanced 12 months) (Left) UNH Relative Performance to S&P 500 (EW) (Right)
Source: ISI Portfolio Strategy.
?
?
?
?
?
?
11
9/2 ISI Group
We Know You Are Going To Ask About The Bearish Real Rates Portfolio
As with any view, there is always going to be two sides to the coin. In the table below, we
illustrate that other side of the real rates story as it outlines those sectors that are adversely
impacted (i.e., underperform) in negative real rate environments. Notably, there is a distinct
weighting towards late-stage cyclical stocks and defensive stocks in general, namely the Utilities,
Health Care and Telecom sectors. We believe that these sectors and stocks are likely to
underperform over the next several months, in tandem with the performance of negative real
rates.
Symbol Company Name
Price
($, 8/29)
PE
(TTM)
Price to
Book
Market
Value (M) Symbol Company Name
Price
($, 8/29) PE (TTM)
Price to
Book
Market
Value (M)
Energy Health Care
XOM Exxon Mobil Corp 80.47 9.8 3.3 $417,753.4 MRK Merck & Co 35.73 15.5 3.5 $70,487.4
#N/A #N/A #N/A #N/A SGP Schering-Plough 19.56 N/A 3.9 $34,255.0
Materials #N/A #N/A #N/A #N/A
AKS Ak Steel Holding Corp 52.06 12.5 5.5 $7,125.1 Financials
AOC Aon Corp 47.81 21.2 2.0 $12,717.3
Industrials JPM Jpmorgan Chase & Co 37.14 11.8 1.1 $139,594.5
EMR Emerson Electric Co 45.99 15.1 3.9 $37,906.2 L Loews Corp 43.00 13.2 1.2 $19,440.1
HON Honeywell International Inc 49.14 13.7 3.7 $37,847.1 #N/A #N/A #N/A #N/A
#N/A #N/A #N/A #N/A Telecommunication Services
Consumer Discretionary T At&T Inc 31.20 14.0 1.6 $181,563.3
DRI Darden Restaurants Inc 28.12 10.7 3.2 $4,576.1 CTL Centurytel Inc 38.08 10.0 1.1 $3,855.7
MCD Mcdonald'S Corp 62.08 16.3 4.6 $67,245.8 Q Qwest Communication Intl Inc 3.70 2.4 13.3 $6,682.7
#N/A #N/A #N/A #N/A Utilities
Consumer Staples FE Firstenergy Corp 73.65 18.4 2.4 $22,420.6
KR Kroger Co 27.69 15.2 3.7 $18,438.6 FPL Fpl Group Inc 60.73 19.9 2.5 $26,359.9
SWY Safeway Inc 25.94 12.4 1.7 $11,633.9 PPL Ppl Corp 44.98 17.1 3.4 $17,610.0
#N/A #N/A #N/A #N/A PEG Public Service Entrp Grp Inc 41.27 21.8 3.2 $21,254.5
#N/A #N/A #N/A #N/A
Real Rates Short Portfolio
Drilling down to the company level, we examined two specific stocks that correlate well with the
current negative real rate environment. Similar to the long portfolio, our analysis uses a 12-
month lead on the negative real rate portfolios against these specific stocks. The stocks we
chose to highlight compared to the short portfolio are JP Morgan Chase (JPM) and Merck
(MRK). As the charts below reveal, the correlations between these two names make for an
impressive fit against the real rate backdrop. In our view, we believe that these names are likely
to underperform in the near term, in line with the path outlined by the real rate environment.
JP Morgan Chase (JPM) Merck (MRK)
1992 1994 1996 1998 2000 2002 2004 2006 2008 2010
-4
-3
-2
-1
0
1
2
3
4
-1.8
-1.7
-1.6
-1.5
-1.4
-1.3
-1.2
JPMorgan Chase & Co. (JPM) Financials - Diversified Financial Services
Real Rates (advanced 12 months) (Left) JPM Relative Performance to S&P 500 (EW) (Right)
1992 1994 1996 1998 2000 2002 2004 2006 2008 2010
-4
-3
-2
-1
0
1
2
3
4
-1.9
-1.8
-1.7
-1.6
-1.5
-1.4
-1.3
-1.2
-1.1
-1.0
Merck & Co. Inc. (MRK) Health Care - Pharmaceuticals
Real Rates (advanced 12 months) (Left) MRK Relative Performance to S&P 500 (EW) (Right)
Source: ISI Portfolio Strategy.
12
9/2 ISI Group
Real Rates’ Take On Asset Allocation
Furthermore, the negative real rate environment has other significant implications on asset
classes within investors’ portfolios. In the diagram below, we highlight which asset classes that
we expect to outperform in negative real rate environments. As we’ve previously mentioned,
negative real rates are not only positive for early cyclicals, but also for small cap equities, value
stocks and corporate bonds (each relative to their respective counterpart noted below). In the
following pages we highlight these individual correlations with real rates in more detail.
One of the primary reasons investors purchase bonds is to insure against a slowing economy
(i.e., lower bond yields). However, in a post-negative real rate environment, a pickup in economic
activity is likely to send yields higher, thus sending bond prices lower. As the subsequent chart
highlights, a negative relationship exists between real rates (advanced) and bond yields. As we
have highlighted, leading indicators of economic activity typically recover roughly 12 months
following a decline in real rates. Historically, this has also corresponded with a backup in bond
yields as investors shift allocations to hard assets or those set to benefit from the increase in
business/consumer activity (e.g., early cyclical equities).
Bond Yields Likely To Recover As Economic Prospect Improve
Equities likely to
outperform bonds.
-4%
-3%
-2%
-1%
0%
1%
2%
3%
4%
5%
1994 1996 1998 2000 2002 2004 2006 2008 2010 2012
-250
-200
-150
-100
-50
0
50
100
150
200
250
300
Real Fed Funds Rate (Inverted, Adv 12m, L) 10 Year Treasury Yield (YoY BP Chg, R)
? Risks to bond
yields are skewed
to the upside.
Source: ISI Portfolio Strategy.
Small
vs.
Large
Value
vs.
Growth
Corporate
vs.
Treasuries
Equities
vs.
Bonds
Lower
Volatility
Negative Real Rates
Asset Allocation
Preferences
13
9/2 ISI Group
Again looking at the fixed income side of the investment allocation equation, one of the results of
a negative real rate environment is that credit spreads are likely to narrow. As the chart below
demonstrates, credit spreads have a strong positive correlation to real rates. Overall, as
consumption rebounds and economic prospects improve, the risk of bankruptcies or defaults
diminishes, thus likely causing credit spreads to narrow.
Credit Spreads Eventually Tighten Following A Decline In Real Rates
Corporates likely
to outperform
Treasuries.
-4%
-3%
-2%
-1%
0%
1%
2%
3%
4%
5%
1991 1993 1995 1997 1999 2001 2003 2005 2007 2009 2011
-2.0
-1.5
-1.0
-0.5
0.0
0.5
1.0
1.5
2.0
2.5
Real Fed Funds Rate (Adv 12m, L) BAA Credit Spreads (YoY BP Chg, ppts, R)
Real rates argue
that credit
spreads are likely
tighten from here.
Source: ISI Portfolio Strategy.
In addition, one of the other market implications that real negative rates has is its effects on
volatility. As one can see in the chart below, volatility movements has typically coincided with
real rate movements (with a lag). In general, volatility has troughed when real rates are deeply
negative and vice versa. Thus, the recent downswing in real rates suggests that volatility is likely
to continue to decline in the coming quarters on the back of lower real rates.
Volatility Is Likely To Abate In The Coming Year
Volatility likely to
decline.
-5%
-4%
-3%
-2%
-1%
1%
2%
3%
4%
5%
6%
1990 1992 1994 1996 1998 2000 2002 2004 2006 2008 2010 2012
0
5
10
15
20
25
30
35
40
45
Real Fed Funds Rate (Adv 12m, L) VIX (R)
New low in the VIX
index coming up?
Source: ISI Portfolio Strategy.
14
9/2 ISI Group
By examining market cap mix-shifts, we also determined that negative real rates have also
historically correlated well with movements in the “size trade”. As the figure below shows, small
cap to large cap relative performance has shown a high positive correlation to movements in real
rates. Overall, the negative trend in real rates is suggestive of small cap outperformance relative
to large cap names, in the near term.
Negative Real Rates Typically A Boon For Smaller Cap Equities!
Small caps likely
to outperform
large caps.
-5%
-3%
-1%
1%
3%
5%
7%
1990 1992 1994 1996 1998 2000 2002 2004 2006 2008 2010 2012
0.7
0.8
0.9
1.0
1.1
1.2
1.3
1.4
1.5
Real Fed Funds Rate (Inverted, Adv 12m, L) Small to Large Cap Relative Performance (R)
Small caps set to
continue their
dominance?
Source: ISI Portfolio Strategy.
In tandem with the size analysis, styles shifts have also occurred following a change in real
rates. As the chart below demonstrates, real negative rates have typically served as a leading
indicator for when style shifts are likely to occur. Also, as real rates become more negative, value
stocks tend to outperform their growth counterparts. Accordingly, if this relationship holds, we
can expect value stocks to outperform growth stocks in the near-term.
The Trend In Real Rates Suggests A Style Rotation Back To Value
-4%
-3%
-2%
-1%
0%
1%
2%
3%
4%
5%
6%
1990 1992 1994 1996 1998 2000 2002 2004 2006 2008 2010 2012
-40%
-30%
-20%
-10%
0%
10%
20%
30%
40%
Real Fed Funds Rate (Inverted, Adv 12m, L) Value to Growth Relative Performance (YoY % Chg, R)
Styles come and
go … will Value
make a comeback
in 2009?
Source: ISI Portfolio Strategy.
15
9/2 ISI Group
ANALYST CERTIFICATION: The views expressed in this Report accurately reflect the personal
views of those preparing the Report about any and all of the subjects or issuers referenced in
this Report. No part of the compensation of any person involved in the preparation of this Report
was, is, or will be directly or indirectly related to the specific recommendations or views
expressed by research analysts in this Report.
DISCLOSURE: Neither ISI nor its affiliates beneficially own 1% or more of any class of
common equity securities of the subject companies referenced in this Report. No person(s)
responsible for preparing this report or a member of his/her household serve as an officer,
director or advisory board member of any of the subject companies. Neither ISI nor its affiliates
have any investment banking or market making operations. At various times these reports
mention clients of ISI from whom ISI has received non-investment banking securities related
compensation in the past 12 months.
DISCLAIMER: This material is based upon information that we consider to be reliable, but
neither ISI nor its affiliates guarantee its completeness or accuracy. Assumptions, opinions and
recommendations contained herein are subject to change without notice, and ISI is not obligated
to update the information contained herein. Past performance is not necessarily indicative of
future performance. This material is not intended as an offer or solicitation for the purchase or
sale of any security.

Contenu connexe

Tendances

Putnam Perspectives: Fixed Income Outlook Q1 2014
Putnam Perspectives: Fixed Income Outlook Q1 2014Putnam Perspectives: Fixed Income Outlook Q1 2014
Putnam Perspectives: Fixed Income Outlook Q1 2014Putnam Investments
 
Finlight Research - Market Perspectives - Mar 2016
Finlight Research - Market Perspectives - Mar 2016Finlight Research - Market Perspectives - Mar 2016
Finlight Research - Market Perspectives - Mar 2016FinLight Research
 
Finlight Research - Market Perspectives - Aug 2016
Finlight Research - Market Perspectives - Aug 2016Finlight Research - Market Perspectives - Aug 2016
Finlight Research - Market Perspectives - Aug 2016FinLight Research
 
Finlight Research - Market Perspectives - Mar 2015
Finlight Research - Market Perspectives - Mar 2015Finlight Research - Market Perspectives - Mar 2015
Finlight Research - Market Perspectives - Mar 2015Zouheir Ben Tamarout
 
LBS - Asset Allocation Model – February Update
LBS - Asset Allocation Model – February UpdateLBS - Asset Allocation Model – February Update
LBS - Asset Allocation Model – February UpdateMark MacIsaac
 
The Southern Oregon University 2015 Economic Forecast (1)
The Southern Oregon University 2015 Economic Forecast (1)The Southern Oregon University 2015 Economic Forecast (1)
The Southern Oregon University 2015 Economic Forecast (1)Sophia Panacy
 
Finlight Research - Market Perspectives - Nov 2016
Finlight Research - Market Perspectives - Nov 2016Finlight Research - Market Perspectives - Nov 2016
Finlight Research - Market Perspectives - Nov 2016FinLight Research
 
Finlight Research - Market perspectives - Jan 2015
Finlight Research - Market perspectives - Jan 2015Finlight Research - Market perspectives - Jan 2015
Finlight Research - Market perspectives - Jan 2015Zouheir Ben Tamarout
 
Monetary policy & inflation@ ppt
Monetary policy & inflation@ pptMonetary policy & inflation@ ppt
Monetary policy & inflation@ pptBabasab Patil
 
The Business Cycle and Economic Growth
The Business Cycle and Economic GrowthThe Business Cycle and Economic Growth
The Business Cycle and Economic Growthtutor2u
 
Advice for the Wise - February 2013
Advice for the Wise - February 2013Advice for the Wise - February 2013
Advice for the Wise - February 2013Karvy Private Wealth
 
Finlight Research - Market Perspectives - Oct 2014
Finlight Research - Market Perspectives - Oct 2014Finlight Research - Market Perspectives - Oct 2014
Finlight Research - Market Perspectives - Oct 2014Zouheir Ben Tamarout
 
Effective Measures Against the Recession
Effective Measures Against the RecessionEffective Measures Against the Recession
Effective Measures Against the RecessionMadrid Network
 
Finlight Research - Market perspectives - Dec 2015
Finlight Research - Market perspectives - Dec 2015Finlight Research - Market perspectives - Dec 2015
Finlight Research - Market perspectives - Dec 2015FinLight Research
 
Capital Market 1st Quarter 2010
Capital Market 1st Quarter 2010Capital Market 1st Quarter 2010
Capital Market 1st Quarter 2010pospime
 
Recession depression and despair
Recession depression and despairRecession depression and despair
Recession depression and despairAdam Jones
 
WHAT IS RECESSION - A SMALL UNDERSTANDING / MEANING
WHAT IS RECESSION - A SMALL UNDERSTANDING / MEANING WHAT IS RECESSION - A SMALL UNDERSTANDING / MEANING
WHAT IS RECESSION - A SMALL UNDERSTANDING / MEANING Amit Jhunjhunwala
 

Tendances (20)

Putnam Perspectives: Fixed Income Outlook Q1 2014
Putnam Perspectives: Fixed Income Outlook Q1 2014Putnam Perspectives: Fixed Income Outlook Q1 2014
Putnam Perspectives: Fixed Income Outlook Q1 2014
 
Finlight Research - Market Perspectives - Mar 2016
Finlight Research - Market Perspectives - Mar 2016Finlight Research - Market Perspectives - Mar 2016
Finlight Research - Market Perspectives - Mar 2016
 
Finlight Research - Market Perspectives - Aug 2016
Finlight Research - Market Perspectives - Aug 2016Finlight Research - Market Perspectives - Aug 2016
Finlight Research - Market Perspectives - Aug 2016
 
Finlight Research - Market Perspectives - Mar 2015
Finlight Research - Market Perspectives - Mar 2015Finlight Research - Market Perspectives - Mar 2015
Finlight Research - Market Perspectives - Mar 2015
 
LBS - Asset Allocation Model – February Update
LBS - Asset Allocation Model – February UpdateLBS - Asset Allocation Model – February Update
LBS - Asset Allocation Model – February Update
 
The Southern Oregon University 2015 Economic Forecast (1)
The Southern Oregon University 2015 Economic Forecast (1)The Southern Oregon University 2015 Economic Forecast (1)
The Southern Oregon University 2015 Economic Forecast (1)
 
Finlight Research - Market Perspectives - Nov 2016
Finlight Research - Market Perspectives - Nov 2016Finlight Research - Market Perspectives - Nov 2016
Finlight Research - Market Perspectives - Nov 2016
 
Agf market outlook
Agf market outlookAgf market outlook
Agf market outlook
 
Finlight Research - Market perspectives - Jan 2015
Finlight Research - Market perspectives - Jan 2015Finlight Research - Market perspectives - Jan 2015
Finlight Research - Market perspectives - Jan 2015
 
Monetary policy & inflation@ ppt
Monetary policy & inflation@ pptMonetary policy & inflation@ ppt
Monetary policy & inflation@ ppt
 
The Business Cycle and Economic Growth
The Business Cycle and Economic GrowthThe Business Cycle and Economic Growth
The Business Cycle and Economic Growth
 
General question
General questionGeneral question
General question
 
Monetary policy
Monetary policyMonetary policy
Monetary policy
 
Advice for the Wise - February 2013
Advice for the Wise - February 2013Advice for the Wise - February 2013
Advice for the Wise - February 2013
 
Finlight Research - Market Perspectives - Oct 2014
Finlight Research - Market Perspectives - Oct 2014Finlight Research - Market Perspectives - Oct 2014
Finlight Research - Market Perspectives - Oct 2014
 
Effective Measures Against the Recession
Effective Measures Against the RecessionEffective Measures Against the Recession
Effective Measures Against the Recession
 
Finlight Research - Market perspectives - Dec 2015
Finlight Research - Market perspectives - Dec 2015Finlight Research - Market perspectives - Dec 2015
Finlight Research - Market perspectives - Dec 2015
 
Capital Market 1st Quarter 2010
Capital Market 1st Quarter 2010Capital Market 1st Quarter 2010
Capital Market 1st Quarter 2010
 
Recession depression and despair
Recession depression and despairRecession depression and despair
Recession depression and despair
 
WHAT IS RECESSION - A SMALL UNDERSTANDING / MEANING
WHAT IS RECESSION - A SMALL UNDERSTANDING / MEANING WHAT IS RECESSION - A SMALL UNDERSTANDING / MEANING
WHAT IS RECESSION - A SMALL UNDERSTANDING / MEANING
 

Similaire à U.S. Real Rates

Outlook For Commodities
Outlook For CommoditiesOutlook For Commodities
Outlook For CommoditiesRusNewton
 
Measuring the market
Measuring the marketMeasuring the market
Measuring the marketSocial MEDIA
 
Allocator November 2010
Allocator November 2010Allocator November 2010
Allocator November 2010bruno_nautilus
 
Rules of Thumb for a Volatile Market
Rules of Thumb for a Volatile MarketRules of Thumb for a Volatile Market
Rules of Thumb for a Volatile MarketMarqus J Freeman
 
Dragon Fund_Sector Update
Dragon Fund_Sector UpdateDragon Fund_Sector Update
Dragon Fund_Sector UpdateSara Golshahr
 
InvestmentCommitteeResearch_AlchemyCapital_March2008
InvestmentCommitteeResearch_AlchemyCapital_March2008InvestmentCommitteeResearch_AlchemyCapital_March2008
InvestmentCommitteeResearch_AlchemyCapital_March2008Jean-Marc Bloch-Lambert
 
10 key trends changing investment management
10 key trends changing investment management10 key trends changing investment management
10 key trends changing investment managementtessat97
 
Avant garde wealth mgmt - Quarterly letter - 1306
Avant garde wealth mgmt - Quarterly letter - 1306Avant garde wealth mgmt - Quarterly letter - 1306
Avant garde wealth mgmt - Quarterly letter - 1306Gaurav Jalan
 
Skirting the Abyss: From Economic Downturn to Financial Crisis to Long-term M...
Skirting the Abyss: From Economic Downturn to Financial Crisis to Long-term M...Skirting the Abyss: From Economic Downturn to Financial Crisis to Long-term M...
Skirting the Abyss: From Economic Downturn to Financial Crisis to Long-term M...Llinlithgow Associates
 
Real Estate Capital Markets Are Alive, If Not Quite Well
Real Estate Capital Markets Are Alive, If Not Quite WellReal Estate Capital Markets Are Alive, If Not Quite Well
Real Estate Capital Markets Are Alive, If Not Quite WellDan Hutchins
 
1 St Qtr. 2008 Pri Retail Analytics
1 St Qtr. 2008 Pri Retail Analytics1 St Qtr. 2008 Pri Retail Analytics
1 St Qtr. 2008 Pri Retail Analyticsdigital.signage
 
FINANCIAL ANALYSISHow Fast Should Your CompanyGrowb
FINANCIAL ANALYSISHow Fast Should Your CompanyGrowbFINANCIAL ANALYSISHow Fast Should Your CompanyGrowb
FINANCIAL ANALYSISHow Fast Should Your CompanyGrowbAlysonDuongtw
 
Robert L. Reynolds: New thinking, new solutions
Robert L. Reynolds: New thinking, new solutionsRobert L. Reynolds: New thinking, new solutions
Robert L. Reynolds: New thinking, new solutionsPutnam Investments
 
Seminar 8 creating an investment recommendation
Seminar 8   creating an investment recommendationSeminar 8   creating an investment recommendation
Seminar 8 creating an investment recommendationpvalantagul
 

Similaire à U.S. Real Rates (20)

Outlook For Commodities
Outlook For CommoditiesOutlook For Commodities
Outlook For Commodities
 
2009 Market Outlook
2009 Market Outlook2009 Market Outlook
2009 Market Outlook
 
Measuring the market
Measuring the marketMeasuring the market
Measuring the market
 
Allocator November 2010
Allocator November 2010Allocator November 2010
Allocator November 2010
 
Rules of Thumb for a Volatile Market
Rules of Thumb for a Volatile MarketRules of Thumb for a Volatile Market
Rules of Thumb for a Volatile Market
 
Dragon Fund_Sector Update
Dragon Fund_Sector UpdateDragon Fund_Sector Update
Dragon Fund_Sector Update
 
InvestmentCommitteeResearch_AlchemyCapital_March2008
InvestmentCommitteeResearch_AlchemyCapital_March2008InvestmentCommitteeResearch_AlchemyCapital_March2008
InvestmentCommitteeResearch_AlchemyCapital_March2008
 
10 key trends changing investment management
10 key trends changing investment management10 key trends changing investment management
10 key trends changing investment management
 
Monthly Perspectives - Volatility - June 2016
Monthly Perspectives - Volatility - June 2016Monthly Perspectives - Volatility - June 2016
Monthly Perspectives - Volatility - June 2016
 
Avant garde wealth mgmt - Quarterly letter - 1306
Avant garde wealth mgmt - Quarterly letter - 1306Avant garde wealth mgmt - Quarterly letter - 1306
Avant garde wealth mgmt - Quarterly letter - 1306
 
Skirting the Abyss: From Economic Downturn to Financial Crisis to Long-term M...
Skirting the Abyss: From Economic Downturn to Financial Crisis to Long-term M...Skirting the Abyss: From Economic Downturn to Financial Crisis to Long-term M...
Skirting the Abyss: From Economic Downturn to Financial Crisis to Long-term M...
 
Acca Notes
Acca NotesAcca Notes
Acca Notes
 
Real Estate Capital Markets Are Alive, If Not Quite Well
Real Estate Capital Markets Are Alive, If Not Quite WellReal Estate Capital Markets Are Alive, If Not Quite Well
Real Estate Capital Markets Are Alive, If Not Quite Well
 
1 St Qtr. 2008 Pri Retail Analytics
1 St Qtr. 2008 Pri Retail Analytics1 St Qtr. 2008 Pri Retail Analytics
1 St Qtr. 2008 Pri Retail Analytics
 
FINANCIAL ANALYSISHow Fast Should Your CompanyGrowb
FINANCIAL ANALYSISHow Fast Should Your CompanyGrowbFINANCIAL ANALYSISHow Fast Should Your CompanyGrowb
FINANCIAL ANALYSISHow Fast Should Your CompanyGrowb
 
Robert L. Reynolds: New thinking, new solutions
Robert L. Reynolds: New thinking, new solutionsRobert L. Reynolds: New thinking, new solutions
Robert L. Reynolds: New thinking, new solutions
 
Fm unit-2-part-1 (1)
Fm unit-2-part-1 (1)Fm unit-2-part-1 (1)
Fm unit-2-part-1 (1)
 
CASPAR BENSONGETTY IMA
CASPAR BENSONGETTY IMACASPAR BENSONGETTY IMA
CASPAR BENSONGETTY IMA
 
MBA Macroeconomics
MBA MacroeconomicsMBA Macroeconomics
MBA Macroeconomics
 
Seminar 8 creating an investment recommendation
Seminar 8   creating an investment recommendationSeminar 8   creating an investment recommendation
Seminar 8 creating an investment recommendation
 

Plus de Kevin Cheng, CFA

Equity Strategy - Consumer Staples
Equity Strategy - Consumer StaplesEquity Strategy - Consumer Staples
Equity Strategy - Consumer StaplesKevin Cheng, CFA
 
Brookfield Office Properties - BPO - Quarterly Earnings
Brookfield Office Properties - BPO - Quarterly EarningsBrookfield Office Properties - BPO - Quarterly Earnings
Brookfield Office Properties - BPO - Quarterly EarningsKevin Cheng, CFA
 
First Capital Realty - FCR
First Capital Realty - FCRFirst Capital Realty - FCR
First Capital Realty - FCRKevin Cheng, CFA
 
CXP initiation - Office REIT
CXP initiation - Office REITCXP initiation - Office REIT
CXP initiation - Office REITKevin Cheng, CFA
 
Canadian Asset Managers - Initiation Report
Canadian Asset Managers - Initiation ReportCanadian Asset Managers - Initiation Report
Canadian Asset Managers - Initiation ReportKevin Cheng, CFA
 
Equity Strategy - Staying Defensive
Equity Strategy - Staying DefensiveEquity Strategy - Staying Defensive
Equity Strategy - Staying DefensiveKevin Cheng, CFA
 
Asset Managers - Recession risks, Trust Banks & Asset Mgrs
Asset Managers - Recession risks, Trust Banks & Asset MgrsAsset Managers - Recession risks, Trust Banks & Asset Mgrs
Asset Managers - Recession risks, Trust Banks & Asset MgrsKevin Cheng, CFA
 
Asset Managers - Defensive But Not Immune
Asset Managers - Defensive But Not ImmuneAsset Managers - Defensive But Not Immune
Asset Managers - Defensive But Not ImmuneKevin Cheng, CFA
 

Plus de Kevin Cheng, CFA (13)

Equity Strategy - Consumer Staples
Equity Strategy - Consumer StaplesEquity Strategy - Consumer Staples
Equity Strategy - Consumer Staples
 
Brookfield Office Properties - BPO - Quarterly Earnings
Brookfield Office Properties - BPO - Quarterly EarningsBrookfield Office Properties - BPO - Quarterly Earnings
Brookfield Office Properties - BPO - Quarterly Earnings
 
First Capital Realty - FCR
First Capital Realty - FCRFirst Capital Realty - FCR
First Capital Realty - FCR
 
Equity Strategy - TSX
Equity Strategy - TSXEquity Strategy - TSX
Equity Strategy - TSX
 
Focus - Economic Research
Focus - Economic ResearchFocus - Economic Research
Focus - Economic Research
 
DEA Initiation Report
DEA Initiation ReportDEA Initiation Report
DEA Initiation Report
 
CXP initiation - Office REIT
CXP initiation - Office REITCXP initiation - Office REIT
CXP initiation - Office REIT
 
Canadian Asset Managers - Initiation Report
Canadian Asset Managers - Initiation ReportCanadian Asset Managers - Initiation Report
Canadian Asset Managers - Initiation Report
 
Equity Strategy - Staying Defensive
Equity Strategy - Staying DefensiveEquity Strategy - Staying Defensive
Equity Strategy - Staying Defensive
 
Asset Managers - Recession risks, Trust Banks & Asset Mgrs
Asset Managers - Recession risks, Trust Banks & Asset MgrsAsset Managers - Recession risks, Trust Banks & Asset Mgrs
Asset Managers - Recession risks, Trust Banks & Asset Mgrs
 
Asset Managers - Defensive But Not Immune
Asset Managers - Defensive But Not ImmuneAsset Managers - Defensive But Not Immune
Asset Managers - Defensive But Not Immune
 
The deleveraging cycle
The deleveraging cycleThe deleveraging cycle
The deleveraging cycle
 
Market Strategy
Market StrategyMarket Strategy
Market Strategy
 

Dernier

The Economic History of the U.S. Lecture 21.pdf
The Economic History of the U.S. Lecture 21.pdfThe Economic History of the U.S. Lecture 21.pdf
The Economic History of the U.S. Lecture 21.pdfGale Pooley
 
03_Emmanuel Ndiaye_Degroof Petercam.pptx
03_Emmanuel Ndiaye_Degroof Petercam.pptx03_Emmanuel Ndiaye_Degroof Petercam.pptx
03_Emmanuel Ndiaye_Degroof Petercam.pptxFinTech Belgium
 
(DIYA) Bhumkar Chowk Call Girls Just Call 7001035870 [ Cash on Delivery ] Pun...
(DIYA) Bhumkar Chowk Call Girls Just Call 7001035870 [ Cash on Delivery ] Pun...(DIYA) Bhumkar Chowk Call Girls Just Call 7001035870 [ Cash on Delivery ] Pun...
(DIYA) Bhumkar Chowk Call Girls Just Call 7001035870 [ Cash on Delivery ] Pun...ranjana rawat
 
VIP Call Girls Service Dilsukhnagar Hyderabad Call +91-8250192130
VIP Call Girls Service Dilsukhnagar Hyderabad Call +91-8250192130VIP Call Girls Service Dilsukhnagar Hyderabad Call +91-8250192130
VIP Call Girls Service Dilsukhnagar Hyderabad Call +91-8250192130Suhani Kapoor
 
The Economic History of the U.S. Lecture 17.pdf
The Economic History of the U.S. Lecture 17.pdfThe Economic History of the U.S. Lecture 17.pdf
The Economic History of the U.S. Lecture 17.pdfGale Pooley
 
The Economic History of the U.S. Lecture 18.pdf
The Economic History of the U.S. Lecture 18.pdfThe Economic History of the U.S. Lecture 18.pdf
The Economic History of the U.S. Lecture 18.pdfGale Pooley
 
Top Rated Pune Call Girls Viman Nagar ⟟ 6297143586 ⟟ Call Me For Genuine Sex...
Top Rated  Pune Call Girls Viman Nagar ⟟ 6297143586 ⟟ Call Me For Genuine Sex...Top Rated  Pune Call Girls Viman Nagar ⟟ 6297143586 ⟟ Call Me For Genuine Sex...
Top Rated Pune Call Girls Viman Nagar ⟟ 6297143586 ⟟ Call Me For Genuine Sex...Call Girls in Nagpur High Profile
 
Pooja 9892124323 : Call Girl in Juhu Escorts Service Free Home Delivery
Pooja 9892124323 : Call Girl in Juhu Escorts Service Free Home DeliveryPooja 9892124323 : Call Girl in Juhu Escorts Service Free Home Delivery
Pooja 9892124323 : Call Girl in Juhu Escorts Service Free Home DeliveryPooja Nehwal
 
High Class Call Girls Nashik Maya 7001305949 Independent Escort Service Nashik
High Class Call Girls Nashik Maya 7001305949 Independent Escort Service NashikHigh Class Call Girls Nashik Maya 7001305949 Independent Escort Service Nashik
High Class Call Girls Nashik Maya 7001305949 Independent Escort Service NashikCall Girls in Nagpur High Profile
 
Booking open Available Pune Call Girls Shivane 6297143586 Call Hot Indian Gi...
Booking open Available Pune Call Girls Shivane  6297143586 Call Hot Indian Gi...Booking open Available Pune Call Girls Shivane  6297143586 Call Hot Indian Gi...
Booking open Available Pune Call Girls Shivane 6297143586 Call Hot Indian Gi...Call Girls in Nagpur High Profile
 
Dividend Policy and Dividend Decision Theories.pptx
Dividend Policy and Dividend Decision Theories.pptxDividend Policy and Dividend Decision Theories.pptx
Dividend Policy and Dividend Decision Theories.pptxanshikagoel52
 
The Economic History of the U.S. Lecture 19.pdf
The Economic History of the U.S. Lecture 19.pdfThe Economic History of the U.S. Lecture 19.pdf
The Economic History of the U.S. Lecture 19.pdfGale Pooley
 
VIP Call Girls LB Nagar ( Hyderabad ) Phone 8250192130 | ₹5k To 25k With Room...
VIP Call Girls LB Nagar ( Hyderabad ) Phone 8250192130 | ₹5k To 25k With Room...VIP Call Girls LB Nagar ( Hyderabad ) Phone 8250192130 | ₹5k To 25k With Room...
VIP Call Girls LB Nagar ( Hyderabad ) Phone 8250192130 | ₹5k To 25k With Room...Suhani Kapoor
 
Instant Issue Debit Cards - High School Spirit
Instant Issue Debit Cards - High School SpiritInstant Issue Debit Cards - High School Spirit
Instant Issue Debit Cards - High School Spiritegoetzinger
 
Solution Manual for Financial Accounting, 11th Edition by Robert Libby, Patri...
Solution Manual for Financial Accounting, 11th Edition by Robert Libby, Patri...Solution Manual for Financial Accounting, 11th Edition by Robert Libby, Patri...
Solution Manual for Financial Accounting, 11th Edition by Robert Libby, Patri...ssifa0344
 
Call Girls Service Nagpur Maya Call 7001035870 Meet With Nagpur Escorts
Call Girls Service Nagpur Maya Call 7001035870 Meet With Nagpur EscortsCall Girls Service Nagpur Maya Call 7001035870 Meet With Nagpur Escorts
Call Girls Service Nagpur Maya Call 7001035870 Meet With Nagpur Escortsranjana rawat
 
The Economic History of the U.S. Lecture 30.pdf
The Economic History of the U.S. Lecture 30.pdfThe Economic History of the U.S. Lecture 30.pdf
The Economic History of the U.S. Lecture 30.pdfGale Pooley
 
The Economic History of the U.S. Lecture 25.pdf
The Economic History of the U.S. Lecture 25.pdfThe Economic History of the U.S. Lecture 25.pdf
The Economic History of the U.S. Lecture 25.pdfGale Pooley
 
06_Joeri Van Speybroek_Dell_MeetupDora&Cybersecurity.pdf
06_Joeri Van Speybroek_Dell_MeetupDora&Cybersecurity.pdf06_Joeri Van Speybroek_Dell_MeetupDora&Cybersecurity.pdf
06_Joeri Van Speybroek_Dell_MeetupDora&Cybersecurity.pdfFinTech Belgium
 

Dernier (20)

The Economic History of the U.S. Lecture 21.pdf
The Economic History of the U.S. Lecture 21.pdfThe Economic History of the U.S. Lecture 21.pdf
The Economic History of the U.S. Lecture 21.pdf
 
03_Emmanuel Ndiaye_Degroof Petercam.pptx
03_Emmanuel Ndiaye_Degroof Petercam.pptx03_Emmanuel Ndiaye_Degroof Petercam.pptx
03_Emmanuel Ndiaye_Degroof Petercam.pptx
 
(DIYA) Bhumkar Chowk Call Girls Just Call 7001035870 [ Cash on Delivery ] Pun...
(DIYA) Bhumkar Chowk Call Girls Just Call 7001035870 [ Cash on Delivery ] Pun...(DIYA) Bhumkar Chowk Call Girls Just Call 7001035870 [ Cash on Delivery ] Pun...
(DIYA) Bhumkar Chowk Call Girls Just Call 7001035870 [ Cash on Delivery ] Pun...
 
VIP Call Girls Service Dilsukhnagar Hyderabad Call +91-8250192130
VIP Call Girls Service Dilsukhnagar Hyderabad Call +91-8250192130VIP Call Girls Service Dilsukhnagar Hyderabad Call +91-8250192130
VIP Call Girls Service Dilsukhnagar Hyderabad Call +91-8250192130
 
The Economic History of the U.S. Lecture 17.pdf
The Economic History of the U.S. Lecture 17.pdfThe Economic History of the U.S. Lecture 17.pdf
The Economic History of the U.S. Lecture 17.pdf
 
The Economic History of the U.S. Lecture 18.pdf
The Economic History of the U.S. Lecture 18.pdfThe Economic History of the U.S. Lecture 18.pdf
The Economic History of the U.S. Lecture 18.pdf
 
Top Rated Pune Call Girls Viman Nagar ⟟ 6297143586 ⟟ Call Me For Genuine Sex...
Top Rated  Pune Call Girls Viman Nagar ⟟ 6297143586 ⟟ Call Me For Genuine Sex...Top Rated  Pune Call Girls Viman Nagar ⟟ 6297143586 ⟟ Call Me For Genuine Sex...
Top Rated Pune Call Girls Viman Nagar ⟟ 6297143586 ⟟ Call Me For Genuine Sex...
 
Pooja 9892124323 : Call Girl in Juhu Escorts Service Free Home Delivery
Pooja 9892124323 : Call Girl in Juhu Escorts Service Free Home DeliveryPooja 9892124323 : Call Girl in Juhu Escorts Service Free Home Delivery
Pooja 9892124323 : Call Girl in Juhu Escorts Service Free Home Delivery
 
High Class Call Girls Nashik Maya 7001305949 Independent Escort Service Nashik
High Class Call Girls Nashik Maya 7001305949 Independent Escort Service NashikHigh Class Call Girls Nashik Maya 7001305949 Independent Escort Service Nashik
High Class Call Girls Nashik Maya 7001305949 Independent Escort Service Nashik
 
Booking open Available Pune Call Girls Shivane 6297143586 Call Hot Indian Gi...
Booking open Available Pune Call Girls Shivane  6297143586 Call Hot Indian Gi...Booking open Available Pune Call Girls Shivane  6297143586 Call Hot Indian Gi...
Booking open Available Pune Call Girls Shivane 6297143586 Call Hot Indian Gi...
 
Dividend Policy and Dividend Decision Theories.pptx
Dividend Policy and Dividend Decision Theories.pptxDividend Policy and Dividend Decision Theories.pptx
Dividend Policy and Dividend Decision Theories.pptx
 
The Economic History of the U.S. Lecture 19.pdf
The Economic History of the U.S. Lecture 19.pdfThe Economic History of the U.S. Lecture 19.pdf
The Economic History of the U.S. Lecture 19.pdf
 
VIP Call Girls LB Nagar ( Hyderabad ) Phone 8250192130 | ₹5k To 25k With Room...
VIP Call Girls LB Nagar ( Hyderabad ) Phone 8250192130 | ₹5k To 25k With Room...VIP Call Girls LB Nagar ( Hyderabad ) Phone 8250192130 | ₹5k To 25k With Room...
VIP Call Girls LB Nagar ( Hyderabad ) Phone 8250192130 | ₹5k To 25k With Room...
 
Instant Issue Debit Cards - High School Spirit
Instant Issue Debit Cards - High School SpiritInstant Issue Debit Cards - High School Spirit
Instant Issue Debit Cards - High School Spirit
 
Solution Manual for Financial Accounting, 11th Edition by Robert Libby, Patri...
Solution Manual for Financial Accounting, 11th Edition by Robert Libby, Patri...Solution Manual for Financial Accounting, 11th Edition by Robert Libby, Patri...
Solution Manual for Financial Accounting, 11th Edition by Robert Libby, Patri...
 
Call Girls Service Nagpur Maya Call 7001035870 Meet With Nagpur Escorts
Call Girls Service Nagpur Maya Call 7001035870 Meet With Nagpur EscortsCall Girls Service Nagpur Maya Call 7001035870 Meet With Nagpur Escorts
Call Girls Service Nagpur Maya Call 7001035870 Meet With Nagpur Escorts
 
The Economic History of the U.S. Lecture 30.pdf
The Economic History of the U.S. Lecture 30.pdfThe Economic History of the U.S. Lecture 30.pdf
The Economic History of the U.S. Lecture 30.pdf
 
(Vedika) Low Rate Call Girls in Pune Call Now 8250077686 Pune Escorts 24x7
(Vedika) Low Rate Call Girls in Pune Call Now 8250077686 Pune Escorts 24x7(Vedika) Low Rate Call Girls in Pune Call Now 8250077686 Pune Escorts 24x7
(Vedika) Low Rate Call Girls in Pune Call Now 8250077686 Pune Escorts 24x7
 
The Economic History of the U.S. Lecture 25.pdf
The Economic History of the U.S. Lecture 25.pdfThe Economic History of the U.S. Lecture 25.pdf
The Economic History of the U.S. Lecture 25.pdf
 
06_Joeri Van Speybroek_Dell_MeetupDora&Cybersecurity.pdf
06_Joeri Van Speybroek_Dell_MeetupDora&Cybersecurity.pdf06_Joeri Van Speybroek_Dell_MeetupDora&Cybersecurity.pdf
06_Joeri Van Speybroek_Dell_MeetupDora&Cybersecurity.pdf
 

U.S. Real Rates

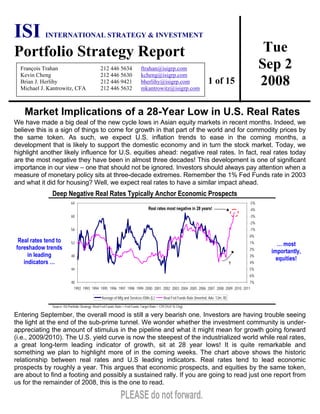
  • 1. Tue Sep 2 2008 ISI INTERNATIONAL STRATEGY & INVESTMENT Portfolio Strategy Report 1 of 15 François Trahan 212 446 5634 ftrahan@isigrp.com Kevin Cheng 212 446 5630 kcheng@isigrp.com Brian J. Herlihy 212 446 9421 bherlihy@isigrp.com Michael J. Kantrowitz, CFA 212 446 5632 mkantrowitz@isigrp.com Market Implications of a 28-Year Low in U.S. Real Rates We have made a big deal of the new cycle lows in Asian equity markets in recent months. Indeed, we believe this is a sign of things to come for growth in that part of the world and for commodity prices by the same token. As such, we expect U.S. inflation trends to ease in the coming months, a development that is likely to support the domestic economy and in turn the stock market. Today, we highlight another likely influence for U.S. equities ahead: negative real rates. In fact, real rates today are the most negative they have been in almost three decades! This development is one of significant importance in our view – one that should not be ignored. Investors should always pay attention when a measure of monetary policy sits at three-decade extremes. Remember the 1% Fed Funds rate in 2003 and what it did for housing? Well, we expect real rates to have a similar impact ahead. Deep Negative Real Rates Typically Anchor Economic Prospects Real rates tend to foreshadow trends in leading indicators … 40 44 48 52 56 60 64 1992 1993 1994 1995 1996 1997 1998 1999 2000 2001 2002 2003 2004 2005 2006 2007 2008 2009 2010 2011 -5% -4% -3% -2% -1% 0% 1% 2% 3% 4% 5% 6% 7% Average of Mfg and Services ISMs (L) Real Fed Funds Rate (Inverted, Adv. 12m, R) ? Real rates most negative in 28 years! … most importantly, equities! Source: ISI Portfolio Strategy. Real Fed Funds Rate = Fed Funds Target Rate – CPI (YoY % Chg). Entering September, the overall mood is still a very bearish one. Investors are having trouble seeing the light at the end of the sub-prime tunnel. We wonder whether the investment community is under- appreciating the amount of stimulus in the pipeline and what it might mean for growth going forward (i.e., 2009/2010). The U.S. yield curve is now the steepest of the industrialized world while real rates, a great long-term leading indicator of growth, sit at 28 year lows! It is quite remarkable and something we plan to highlight more of in the coming weeks. The chart above shows the historic relationship between real rates and U.S leading indicators. Real rates tend to lead economic prospects by roughly a year. This argues that economic prospects, and equities by the same token, are about to find a footing and possibly a sustained rally. If you are going to read just one report from us for the remainder of 2008, this is the one to read.
  • 2. 2 9/2 ISI Group The Underpinnings Of Real Rate Theory The underlying driver behind “real rate theory” begins with the spending choices of both businesses and consumers alike. Each day consumers and businesses face the decision whether to save or spend money. As the chart below shows, in negative real rate environments the incentive differential between spending and saving are significant. In the following example we begin with a simplistic case that consumers (or businesses) can either spend or save $100. We’ll first begin with the savings side of the equation. On that $100, a consumer can earn about $2 of interest over the course of the year, resulting in about $102 worth of nominal value by the end of the year. However, after accounting for the differences in inflation of roughly 5%, the real purchasing power of that $102 actually decreases overall. The Economic Dynamic Of Negative Real Rates Disincentive to save! *Assumes: inflation = 5%, interest rates = 2% t(1): $102 (nominal) t(1): $105 (nominal) own 1 widgetcan purchase 0.97 widget t(0): $100 (Purchase widget) t(1): $100 (real) t(0): $100 Interest: +$2 Inflation: -$5 t(1): $97 (real) < Save Spend (Purchase Goods) Business / Consumer t(0): $100 Interest: +$2 Inflation: -$5 t(1): $97 (real) t(1): $102 (nominal) can purchase 0.97 widgets t(0): $100 (Purchase widget) t(1): $100 (real) t(1): $105 (nominal) own 1 widget Incentive To spend! Source: ISI Portfolio Strategy. In contrast, if a consumer decides to purchase a ok, per say a $100 widget, then in one year’s time that consumer would still have $100 of real value represented by the ownership of the widget (assuming no depreciation). However, the difference here is that the same widget that the consumer “could” have bought last year now costs $105 due to the effects of inflation. Overall the consumer, who chose to save rather than spend, now cannot purchase a widget outright as any gains on interest have been entirely offset by the effects of inflation. When analyzing both these scenario outcomes, it is clear that the consumer is actually better off spending rather than saving. In negative real rate environments, consumers typically increase consumption and prefer “hard assets” as their real purchasing power otherwise erodes over time. In short, this shifts consumption forward as consumers buy more goods in the present (versus future consumption) as those goods are likely to cost more (due to the effects of inflation) if they were to delay those purchases into the future.
  • 3. 3 9/2 ISI Group As the diagram below illustrates, businesses also have choices similar to consumers. In negative real rate environments, businesses are likely to increase inventories as they will expect costs to rise in the coming quarter. By increasing their inventories they have a potential to expand operating margins, holding all else equal. Moreover, there is not much incentive to hold much cash on the balance sheet as the negative real rate environment erodes the value of it. In addition, because interest costs are typically low during these times, businesses have an incentive to take on debt and increase capital expenditures. Negative Real Rates Historically Followed By An Increased Appetite For Hard Assets Typical Reaction To Negative Real Rates Consumers Businesses Decrease Savings Increase Consumption Increase Inventories Increase Capital Expenditures Source: ISI Portfolio Strategy. The chart below demonstrates the consumer side of the negative real rates equation. As illustrated, two of the largest consumer-sensitive sectors, namely the auto and housing industries, both performed exceptionally well in the wake of prior negative real rates environments. This reinforces the view that negative real rates are positive for overall consumption and spending and moreover, increases demand for hard assets. This dynamic has worked well for nearly the past two decades, and we think that it is likely to be maintained going forward. In short, the real rate environment suggests a rebound in leading consumption indicators in the near term. Consumption Typically Recovers Following A Decline In Real Rates -10 -6 -2 2 6 10 14 18 1989 1991 1993 1995 1997 1999 2001 2003 2005 2007 2009 2011 -6% -4% -2% 0% 2% 4% 6% LEI Mfg new orders: consumer goods and materials (YoY % chg, 3-mth m.a., L) Real Fed Funds Rate (Inverted, Adv. 12m, R) ? Auto Boom! Housing Boom! ____ Boom!? Leading consumption indicators about to bottom? Source: ISI Portfolio Strategy.
  • 4. 4 9/2 ISI Group From a business perspective, one of the incentives to increasing inventory levels during negative real rate environments is margin expansion. Businesses can accomplish this by stockpiling raw materials in order to avoid future price increases (thus effectively reducing their cost of goods sold). Referring to our previous example, widget producers could stock pile rubber in their inventory in order to avoid future cost increases. Thus the increase in inventory combined with higher revenues (due to inflation) would in turn result in margin expansion (assuming all else equal). As the chart below demonstrates, businesses have typically increased inventories in the past during times when real rates have become increasingly negative. Inventories Frequently Rise Following A Decline In Real Rates 36 41 46 51 56 1988 1990 1992 1994 1996 1998 2000 2002 2004 2006 2008 2010 -5% -4% -3% -2% -1% 0% 1% 2% 3% 4% 5% 6% ISM: Business Inventories (3-mth m.a.) Real Fed Funds Rate (Inverted, Adv. 12m, R) Inventories peaked about a year past the low in real rates! ? Corporations often hedge against negative real rates by holding inventory. Source: ISI Portfolio Strategy. Another benefit for businesses, during negative rate environments, is the relatively cheap cost of financing as well as an incentive to improve firm efficiency through capital expenditures. As the chart below demonstrates, this correlation has also held up well since 1990. Overall, the relatively long lead time between capital expenditures and real rates implies that capex is likely to find a footing sometime in 2009 and recover in 2010. Capex Also Responds To Negative Real Rates But With A Longer Lag -16 -12 -8 -4 0 4 8 12 16 20 24 1990 1992 1994 1996 1998 2000 2002 2004 2006 2008 2010 -4% -3% -2% -1% 0% 1% 2% 3% 4% 5% Nonresidential Investment ex-tech (YoY % chg, L) Real Fed Funds Rate (Inverted, Adv. 24m, R) Look for Capex to recover in 2010 Capex typically peaks two years following the low in real rates! ? Capex to find a footing in 2009 and recover in 2010? Source: ISI Portfolio Strategy.
  • 5. 5 9/2 ISI Group Negative Real Rates: An Upcoming Catalyst For Equity Markets? As the chart below demonstrates, the sharp change in real rates (into negative territory) implies that leading economic indicators are likely to find their footing in the coming months. In the past, leading indicators have shown a fairly close correlation to real rates and have typically recovered about 12 months following a decline in real rates. On balance, negative real rates are a catalyst for both business and consumer spending alike, which is especially important given that the U.S. consumer accounts for roughly 70% of GDP growth. Overall, this implies a pickup in leading indicators ahead of the eventual recovery in economic growth. Lower Real Rates Eventually Create A Tailwind For Leading Indicators -8 -6 -4 -2 0 2 4 6 8 10 12 14 1988 1990 1992 1994 1996 1998 2000 2002 2004 2006 2008 2010 -5% -3% -1% 1% 3% 5% LEI (YoY % chg, L) Real Fed Funds Rate (Inverted, Adv. 12m, R) Leading indicators typically recover a year following a decline in real rates Negative real rates argue for an upcoming inflection point in leading economic indicators. Source: ISI Portfolio Strategy. In the diagram below, we have laid out the pathway towards a better economy … it all begins with real rates! As we have previously demonstrated, a negative real rate environment typically spurs consumer and business spending. The uptick in spending then helps drive an increase in inventories and capex spending which eventually results in an improvement in the economy. Negative Real Rates and Their Impact on the Equity Market leads to… leads to… discount … Negative Real Rates ▼ U.S. Leading Index ▲ U.S. Equity Multiples ▲ Better Economy in H209 / 2010 The improvement in leading indicators is representative of future growth which is likely to be simultaneously reflected in equity multiple expansion. After all, higher future growth rates are typically justified by higher multiples. Overall both of these indicators suggest a better economy in the 2nd half of 2009 and 2010. For the equity investor, negative real rates is a catalyst that will likely lift equity markets over the next 12 months as markets begin to look beyond the current slowdown and into the recovery ahead.
  • 6. 6 9/2 ISI Group Given that the negative real rate environment suggests a rebound in leading indicators, we went back through to the last business cycle trough to see how leading indicators trended against S&P forward multiples. As the chart below demonstrates, during the most recent cycle the peak and trough of the series correlated very closely to S&P forward multiples. Accordingly, we expect this relationship to be maintained as both indicators begin to trend higher. Economic Prospects and P/E Multiples Go Hand In Hand -6% -4% -2% 0% 2% 4% 6% 8% 10% 12% 2003 2004 2005 2006 2007 2008 2009 2010 12.0x 12.5x 13.0x 13.5x 14.0x 14.5x 15.0x 15.5x 16.0x 16.5x 17.0x 17.5x 18.0x 18.5x 19.0x Leading Index (YoY % Chg, L) S&P 500 12-Month Forward P/E Multiple (R) ? Will multiples / LEI follow the path laid by real rates? Multiples and leading indicators likely to peak and trough in tandem. Improving economic prospects typically lead to higher equity multiples. Source: ISI Portfolio Strategy. One of the primary drivers behind this tight relationship between real rates and forward multiples stems from the strong correlation between real rates and operating earnings growth. As the chart below demonstrates, real rates have typically served as a robust leading indicator (by roughly 15 months) for earnings growth. In short, a more constructive earnings growth environment warrants higher multiples – both messages which are reinforced by the current negative real rate environment. Lower Real Rates… A Harbinger Of Stronger Earnings Growth! -40 -30 -20 -10 0 10 20 30 40 50 1992 1994 1996 1998 2000 2002 2004 2006 2008 2010 2012 -4% -3% -2% -1% 0% 1% 2% 3% 4% 5% S&P 500 Operating EPS (LTM, YoY % chg, L) Real Fed Funds Rate (Inverted, Adv. 15m, R) ? An end to the earnings growth deterioration ahead? Source: ISI Portfolio Strategy.
  • 7. 7 9/2 ISI Group Sector Implications: Rotation From Late-Stage to Rate-Sensitives In light of our analysis on real rates and the economy, the question that portfolio managers may want answered is – which sectors are the primary beneficiary of a negative real rate environments? To answer this we analyzed the S&P 500 to find stocks whose relative performance has closely moved with trends in real rates. We then constructed a portfolio of stocks with the strongest past relationships. The chart below highlights the sectors exposures in our Real Rates Portfolio (RRP), or those likely to see the biggest relative gains in a post-negative real rate environment. The charts below contrast the weightings in the RRP versus the S&P 500. S&P 500 Sector Exposure Real Rates Portfolio Sector Exposure Discretionary 8% Financial 14% Health Care 13% Staples 12% Technology 17% Telecom 3% Materials 4% Industrials 11% Utilities 4% Energy 14% Discretionary 40% Financial 21% Health Care 14% Staples 14% Energy 0% Utilities 0% Industrials 0% Materials 0% Telecom 0% Technology 11% Source: ISI Portfolio Strategy. Overall, our analysis concluded that in negative real rate environments, early cyclicals and rate sensitive sectors typically benefit the most, namely consumer discretionary and financials. In the table below, we ranked the absolute sector weightings in our real rate portfolio against those of of the S&P 500. Two notable observations from our RRP are that there is a zero weighting given to late-stage cyclicals such as Materials and Energy, while Consumer Discretionary and Financials account for 60% of the optimal real rate portfolio. Sector Weights In The Real Rates Portfolio (RRP) The Real Rates Portfolio is heavily weighted towards Early Cyclical sectors. Rank S&P 500 Weight Real Rate Portfolio Discretionary 1 8.4% 39.3% Financial 2 14.4% 21.4% Health Care 3 12.9% 14.3% Staples 4 11.5% 14.3% Technology 5 16.8% 10.7% Materials 6 3.7% 0.0% Telecom 7 3.1% 0.0% Industrials 8 11.4% 0.0% Utilities 9 3.7% 0.0% Energy 10 14.0% 0.0% Source: ISI Portfolio Strategy. Real Rates Portfolio heavily weighted towards rate sensitives Discretionary and Financials make up 60% of the RRP. Zero weight is given to late-stage cyclicals!
  • 8. 8 9/2 ISI Group In essence the real rate environment suggests that investors overweight early cyclicals and underweight late-stage cyclicals. Moreover, this relationship is also exemplified within sectors as well. In the chart below, we illustrate this thematic trade with the relative performance of both the Discretionary and Utilities sectors. As you can see from the performance, the thematic trade from defense to offense follows the path of the real rates very closely. This Thematic Trade Suggests Switch From Defense To Offense Real Rates inter-sector trade idea: Overweight Discretionary + Underweight Utilities 0.80 1.00 1.20 1.40 1.60 1.80 2.00 2.20 2.40 2.60 1990 1992 1994 1996 1998 2000 2002 2004 2006 2008 2010 2012 -4% -3% -2% -1% 0% 1% 2% 3% 4% 5% 6% Discretionary vs. Utilities Real Fed Funds Rate (Inverted, Adv 12m, R) ? Negative real rate environment typically favor early cyclicals between sectors. Source: ISI Portfolio Strategy. Furthermore, not only does this thematic trade work on a sector to sector basis but also on an intra-sector basis. In the following chart, we’ve highlighted two sub-industry groupings within the industrials complex, namely the Trucking and Railroads industries. As one can see, the negative real rate environment is exceptionally conducive to Trucking outperformance versus Railroads – thus reinforcing the thematic trade suggested by the current real rate environment (i.e., early cyclicals versus late-stage cyclicals). Real Rates Current Path Suggests Trucking To Outperform Railroads Real Rates intra-sector trade idea: Overweight Trucking + Underweight Railroads 0.30 0.40 0.50 0.60 0.70 0.80 0.90 1.00 1993 1995 1997 1999 2001 2003 2005 2007 2009 2011 -4% -3% -2% -1% 0% 1% 2% 3% 4% 5% Trucking vs. Railroads Real Fed Funds Rate (Inverted, Adv 12m, R) Trucking typically outperform Railroads following a decline in real rates! ? Negative real rate environment typically favor early cyclicals within sectors. Source: ISI Portfolio Strategy.
  • 9. 9 9/2 ISI Group Introducing The Real Rates Portfolio The usefulness of the negative real rate environment remains extremely interesting as a stock screening / selection tool. The list below contains S&P 500 stocks whose relative performance has most closely moved with trends in real rates. If these historic relationships hold, the list below contains some of the likeliest outperformers over the next 12 months. Symbol Company Name Price ($, 8/29) PE (TTM) Price to Book Market Value (M) Consumer Discretionary CTX Centex Corp 16.22 N/A 0.8 $1,813.9 FDO Family Dollar Stores 24.92 16.1 2.7 $3,254.9 HAR Harman International Inds 34.03 19.6 1.8 $2,399.0 HRB Block H & R Inc 25.54 18.3 8.0 $7,931.8 JNY Jones Apparel Group Inc 19.86 26.8 0.7 $1,396.1 KBH Kb Home 20.80 N/A 1.1 $1,363.5 LIZ Liz Claiborne Inc 16.21 N/A 0.9 $1,238.5 ODP Office Depot Inc 7.04 9.5 0.6 $1,869.9 PHM Pulte Homes Inc 14.51 N/A 0.9 $3,143.0 STZ Constellation Brands 21.11 N/A 1.6 $4,683.4 WEN Wendy'S International Inc 24.27 32.6 2.5 $2,021.8 Financials GGP General Growth Pptys Inc 25.93 103.8 3.7 $7,337.0 MCO Moody's Corp 40.66 19.7 N/A $8,481.6 PGR Progressive Corp-Ohio 18.47 12.7 2.8 $13,676.8 SOV Sovereign Bancorp Inc 9.66 N/A 0.8 $6,308.3 SPG Simon Property Group Inc 94.88 45.8 7.9 $20,845.7 VNO Vornado Realty Trust 99.46 29.8 2.6 $14,630.2 Health Care CVH Coventry Health Care Inc 35.02 9.6 1.6 $5,364.9 DGX Quest Diagnostics Inc 54.05 17.3 2.8 $10,370.5 PDCO Patterson Companies Inc 32.54 19.4 3.8 $3,821.2 UNH Unitedhealth Group Inc 30.45 10.0 1.8 $33,976.8 Consumer Staples DF Dean Foods Co 25.17 30.2 5.7 $3,244.5 MKC Mccormick & Company Inc 40.45 21.0 4.2 $5,171.1 SYY Sysco Corp 31.83 17.5 5.0 $17,018.4 WFMI Whole Foods Market Inc 18.31 17.4 2.1 $3,110.1 Information Technology NSM National Semiconductor Corp 21.43 16.7 24.7 4,873$ SNDK Sandisk Corp 14.46 24.5 0.6 3,173$ SYMC Symantec Corp 22.31 34.8 1.6 17,650$ Real Rates Portfolio As we had previously mentioned, the real rate portfolio is heavily weighted towards Consumer Discretionary names and Financials. Drilling down further within those two sectors, the industries with the highest exposure include household durables (notably homebuilding), textiles apparel & luxury goods and real estate investment trusts. Within Financials, we have found that negative real rates are supportive of the REITs and Insurance industries while they tend to be a headwind to money center banks (note the constituents of the Real Rate Portfolio). Therefore, we are creating a barbell approach to sector positioning within Financials by upgrading the REITs and Insurance industries to market weight, while leaving money-center banks at an underweight position. S&P 500 stocks whose relative performance has closely moved with trends in real rates.
  • 10. 10 9/2 ISI Group Select Stocks From The Real Rates Portfolio The following page contains select stocks within the S&P 500 that have the best correlation to negative real rates, in our opinion. Nearly every one of these companies has been underperforming for a number of months. Given the historic relationship with real rates, many of these stocks have the potential to be among the strongest performers over the next year. KB Home. (KBH) Office Depot Inc. (ODP)) 1988 1990 1992 1994 1996 1998 2000 2002 2004 2006 2008 2010 -4 -3 -2 -1 0 1 2 3 4 5 -2.2 -2.1 -2.0 -1.9 -1.8 -1.7 -1.6 -1.5 -1.4 -1.3 -1.2 KB Home (KBH) Consumer Discretionary - Household Durables Real Rates (inverted, advanced 12 months) (Left) KBH Relative Performance to S&P 500 (EW) (Right) 1988 1990 1992 1994 1996 1998 2000 2002 2004 2006 2008 2010 -4 -3 -2 -1 0 1 2 3 4 5 -2.4 -2.2 -2.0 -1.8 -1.6 -1.4 Office Depot Inc. (ODP) Consumer Discretionary - Specialty Retail Real Rates (inverted, advanced 12 months) (Left) ODP Relative Performance to S&P 500 (EW) (Right) Source: ISI Portfolio Strategy. Symantec Corp. (SYMC) SanDisk Corp. (SNDK) 1988 1990 1992 1994 1996 1998 2000 2002 2004 2006 2008 2010 -4 -3 -2 -1 0 1 2 3 4 5 -2.8 -2.6 -2.4 -2.2 -2.0 -1.8 -1.6 Symantec Corp. (SYMC) Information Technology - Software Real Rates (inverted, advanced 12 months) (Left) SYMC Relative Performance to S&P 500 (EW) (Right) 1988 1990 1992 1994 1996 1998 2000 2002 2004 2006 2008 2010 -4 -3 -2 -1 0 1 2 3 4 5 -2.8 -2.6 -2.4 -2.2 -2.0 -1.8 -1.6 -1.4 -1.2 SanDisk Corp. (SNDK) Information Technology - Computers & Peripherals Real Rates (inverted, advanced 12 months) (Left) SNDK Relative Performance to S&P 500 (EW) (Right) Source: ISI Portfolio Strategy. Coventry Health Care (CVH) UnitedHealth Group (UNH) 1988 1990 1992 1994 1996 1998 2000 2002 2004 2006 2008 2010 -4 -3 -2 -1 0 1 2 3 4 5 -2.6 -2.4 -2.2 -2.0 -1.8 -1.6 -1.4 Coventry Health Care Inc. (CVH) Health Care - Health Care Providers & Services Real Rates (inverted, advanced 12 months) (Left) CVH Relative Performance to S&P 500 (EW) (Right) 1988 1990 1992 1994 1996 1998 2000 2002 2004 2006 2008 2010 -4 -3 -2 -1 0 1 2 3 4 5 -3.2 -3.0 -2.8 -2.6 -2.4 -2.2 -2.0 -1.8 -1.6 -1.4 UnitedHealth Group Inc. (UNH) Health Care - Health Care Providers & Services Real Rates (inverted, advanced 12 months) (Left) UNH Relative Performance to S&P 500 (EW) (Right) Source: ISI Portfolio Strategy. ? ? ? ? ? ?
  • 11. 11 9/2 ISI Group We Know You Are Going To Ask About The Bearish Real Rates Portfolio As with any view, there is always going to be two sides to the coin. In the table below, we illustrate that other side of the real rates story as it outlines those sectors that are adversely impacted (i.e., underperform) in negative real rate environments. Notably, there is a distinct weighting towards late-stage cyclical stocks and defensive stocks in general, namely the Utilities, Health Care and Telecom sectors. We believe that these sectors and stocks are likely to underperform over the next several months, in tandem with the performance of negative real rates. Symbol Company Name Price ($, 8/29) PE (TTM) Price to Book Market Value (M) Symbol Company Name Price ($, 8/29) PE (TTM) Price to Book Market Value (M) Energy Health Care XOM Exxon Mobil Corp 80.47 9.8 3.3 $417,753.4 MRK Merck & Co 35.73 15.5 3.5 $70,487.4 #N/A #N/A #N/A #N/A SGP Schering-Plough 19.56 N/A 3.9 $34,255.0 Materials #N/A #N/A #N/A #N/A AKS Ak Steel Holding Corp 52.06 12.5 5.5 $7,125.1 Financials AOC Aon Corp 47.81 21.2 2.0 $12,717.3 Industrials JPM Jpmorgan Chase & Co 37.14 11.8 1.1 $139,594.5 EMR Emerson Electric Co 45.99 15.1 3.9 $37,906.2 L Loews Corp 43.00 13.2 1.2 $19,440.1 HON Honeywell International Inc 49.14 13.7 3.7 $37,847.1 #N/A #N/A #N/A #N/A #N/A #N/A #N/A #N/A Telecommunication Services Consumer Discretionary T At&T Inc 31.20 14.0 1.6 $181,563.3 DRI Darden Restaurants Inc 28.12 10.7 3.2 $4,576.1 CTL Centurytel Inc 38.08 10.0 1.1 $3,855.7 MCD Mcdonald'S Corp 62.08 16.3 4.6 $67,245.8 Q Qwest Communication Intl Inc 3.70 2.4 13.3 $6,682.7 #N/A #N/A #N/A #N/A Utilities Consumer Staples FE Firstenergy Corp 73.65 18.4 2.4 $22,420.6 KR Kroger Co 27.69 15.2 3.7 $18,438.6 FPL Fpl Group Inc 60.73 19.9 2.5 $26,359.9 SWY Safeway Inc 25.94 12.4 1.7 $11,633.9 PPL Ppl Corp 44.98 17.1 3.4 $17,610.0 #N/A #N/A #N/A #N/A PEG Public Service Entrp Grp Inc 41.27 21.8 3.2 $21,254.5 #N/A #N/A #N/A #N/A Real Rates Short Portfolio Drilling down to the company level, we examined two specific stocks that correlate well with the current negative real rate environment. Similar to the long portfolio, our analysis uses a 12- month lead on the negative real rate portfolios against these specific stocks. The stocks we chose to highlight compared to the short portfolio are JP Morgan Chase (JPM) and Merck (MRK). As the charts below reveal, the correlations between these two names make for an impressive fit against the real rate backdrop. In our view, we believe that these names are likely to underperform in the near term, in line with the path outlined by the real rate environment. JP Morgan Chase (JPM) Merck (MRK) 1992 1994 1996 1998 2000 2002 2004 2006 2008 2010 -4 -3 -2 -1 0 1 2 3 4 -1.8 -1.7 -1.6 -1.5 -1.4 -1.3 -1.2 JPMorgan Chase & Co. (JPM) Financials - Diversified Financial Services Real Rates (advanced 12 months) (Left) JPM Relative Performance to S&P 500 (EW) (Right) 1992 1994 1996 1998 2000 2002 2004 2006 2008 2010 -4 -3 -2 -1 0 1 2 3 4 -1.9 -1.8 -1.7 -1.6 -1.5 -1.4 -1.3 -1.2 -1.1 -1.0 Merck & Co. Inc. (MRK) Health Care - Pharmaceuticals Real Rates (advanced 12 months) (Left) MRK Relative Performance to S&P 500 (EW) (Right) Source: ISI Portfolio Strategy.
  • 12. 12 9/2 ISI Group Real Rates’ Take On Asset Allocation Furthermore, the negative real rate environment has other significant implications on asset classes within investors’ portfolios. In the diagram below, we highlight which asset classes that we expect to outperform in negative real rate environments. As we’ve previously mentioned, negative real rates are not only positive for early cyclicals, but also for small cap equities, value stocks and corporate bonds (each relative to their respective counterpart noted below). In the following pages we highlight these individual correlations with real rates in more detail. One of the primary reasons investors purchase bonds is to insure against a slowing economy (i.e., lower bond yields). However, in a post-negative real rate environment, a pickup in economic activity is likely to send yields higher, thus sending bond prices lower. As the subsequent chart highlights, a negative relationship exists between real rates (advanced) and bond yields. As we have highlighted, leading indicators of economic activity typically recover roughly 12 months following a decline in real rates. Historically, this has also corresponded with a backup in bond yields as investors shift allocations to hard assets or those set to benefit from the increase in business/consumer activity (e.g., early cyclical equities). Bond Yields Likely To Recover As Economic Prospect Improve Equities likely to outperform bonds. -4% -3% -2% -1% 0% 1% 2% 3% 4% 5% 1994 1996 1998 2000 2002 2004 2006 2008 2010 2012 -250 -200 -150 -100 -50 0 50 100 150 200 250 300 Real Fed Funds Rate (Inverted, Adv 12m, L) 10 Year Treasury Yield (YoY BP Chg, R) ? Risks to bond yields are skewed to the upside. Source: ISI Portfolio Strategy. Small vs. Large Value vs. Growth Corporate vs. Treasuries Equities vs. Bonds Lower Volatility Negative Real Rates Asset Allocation Preferences
  • 13. 13 9/2 ISI Group Again looking at the fixed income side of the investment allocation equation, one of the results of a negative real rate environment is that credit spreads are likely to narrow. As the chart below demonstrates, credit spreads have a strong positive correlation to real rates. Overall, as consumption rebounds and economic prospects improve, the risk of bankruptcies or defaults diminishes, thus likely causing credit spreads to narrow. Credit Spreads Eventually Tighten Following A Decline In Real Rates Corporates likely to outperform Treasuries. -4% -3% -2% -1% 0% 1% 2% 3% 4% 5% 1991 1993 1995 1997 1999 2001 2003 2005 2007 2009 2011 -2.0 -1.5 -1.0 -0.5 0.0 0.5 1.0 1.5 2.0 2.5 Real Fed Funds Rate (Adv 12m, L) BAA Credit Spreads (YoY BP Chg, ppts, R) Real rates argue that credit spreads are likely tighten from here. Source: ISI Portfolio Strategy. In addition, one of the other market implications that real negative rates has is its effects on volatility. As one can see in the chart below, volatility movements has typically coincided with real rate movements (with a lag). In general, volatility has troughed when real rates are deeply negative and vice versa. Thus, the recent downswing in real rates suggests that volatility is likely to continue to decline in the coming quarters on the back of lower real rates. Volatility Is Likely To Abate In The Coming Year Volatility likely to decline. -5% -4% -3% -2% -1% 1% 2% 3% 4% 5% 6% 1990 1992 1994 1996 1998 2000 2002 2004 2006 2008 2010 2012 0 5 10 15 20 25 30 35 40 45 Real Fed Funds Rate (Adv 12m, L) VIX (R) New low in the VIX index coming up? Source: ISI Portfolio Strategy.
  • 14. 14 9/2 ISI Group By examining market cap mix-shifts, we also determined that negative real rates have also historically correlated well with movements in the “size trade”. As the figure below shows, small cap to large cap relative performance has shown a high positive correlation to movements in real rates. Overall, the negative trend in real rates is suggestive of small cap outperformance relative to large cap names, in the near term. Negative Real Rates Typically A Boon For Smaller Cap Equities! Small caps likely to outperform large caps. -5% -3% -1% 1% 3% 5% 7% 1990 1992 1994 1996 1998 2000 2002 2004 2006 2008 2010 2012 0.7 0.8 0.9 1.0 1.1 1.2 1.3 1.4 1.5 Real Fed Funds Rate (Inverted, Adv 12m, L) Small to Large Cap Relative Performance (R) Small caps set to continue their dominance? Source: ISI Portfolio Strategy. In tandem with the size analysis, styles shifts have also occurred following a change in real rates. As the chart below demonstrates, real negative rates have typically served as a leading indicator for when style shifts are likely to occur. Also, as real rates become more negative, value stocks tend to outperform their growth counterparts. Accordingly, if this relationship holds, we can expect value stocks to outperform growth stocks in the near-term. The Trend In Real Rates Suggests A Style Rotation Back To Value -4% -3% -2% -1% 0% 1% 2% 3% 4% 5% 6% 1990 1992 1994 1996 1998 2000 2002 2004 2006 2008 2010 2012 -40% -30% -20% -10% 0% 10% 20% 30% 40% Real Fed Funds Rate (Inverted, Adv 12m, L) Value to Growth Relative Performance (YoY % Chg, R) Styles come and go … will Value make a comeback in 2009? Source: ISI Portfolio Strategy.
  • 15. 15 9/2 ISI Group ANALYST CERTIFICATION: The views expressed in this Report accurately reflect the personal views of those preparing the Report about any and all of the subjects or issuers referenced in this Report. No part of the compensation of any person involved in the preparation of this Report was, is, or will be directly or indirectly related to the specific recommendations or views expressed by research analysts in this Report. DISCLOSURE: Neither ISI nor its affiliates beneficially own 1% or more of any class of common equity securities of the subject companies referenced in this Report. No person(s) responsible for preparing this report or a member of his/her household serve as an officer, director or advisory board member of any of the subject companies. Neither ISI nor its affiliates have any investment banking or market making operations. At various times these reports mention clients of ISI from whom ISI has received non-investment banking securities related compensation in the past 12 months. DISCLAIMER: This material is based upon information that we consider to be reliable, but neither ISI nor its affiliates guarantee its completeness or accuracy. Assumptions, opinions and recommendations contained herein are subject to change without notice, and ISI is not obligated to update the information contained herein. Past performance is not necessarily indicative of future performance. This material is not intended as an offer or solicitation for the purchase or sale of any security.