(Best) ENJOY Call Girls in Faridabad Ex | 8377087607
Irb infrastructure developers ltd q2 fy12 result update
1. K E Y N O T E
INSTITUTIONAL RESEARCH
IRB Infrastructure Developer Ltd.
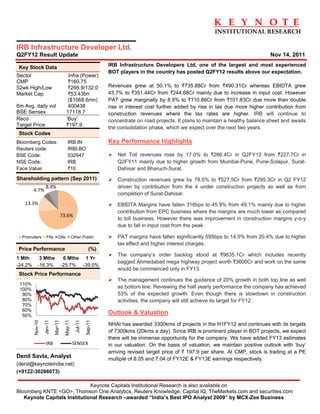
Q2FY12 Result Update Nov 14, 2011
Key Stock Data IRB Infrastructure Developers Ltd, one of the largest and most experienced
BOT players in the country has posted Q2FY12 results above our expectation.
Sector Infra (Power)
CMP `160.75
52wk High/Low `266.9/132.0 Revenues grew at 50.1% to `735.88Cr from `490.31Cr whereas EBIDTA grew
Market Cap `53.43bn 43.7% to `351.44Cr from `244.68Cr mainly due to increase in input cost. However
($1068.6mn) PAT grew marginally by 8.9% to `110.86Cr from `101.83Cr due more than double
6m Avg. daily vol 400438 rise in interest cost further added by rise in tax due more higher contribution from
BSE Sensex 17118.7 construction revenues where the tax rates are higher. IRB will continue to
Reco ‘Buy’ concentrate on road projects. It plans to maintain a healthy balance sheet and awaits
Target Price `197.9
the consolidation phase, which we expect over the next two years.
Stock Codes
Bloomberg Codes: IRB.IN Key Performance Highlights
Reuters code: IRBI.BO
BSE Code: 532947 Net Toll revenues rose by 17.0% to `266.4Cr in Q2FY12 from `227.7Cr in
NSE Code: IRB Q2FY11 mainly due to higher growth from Mumbai-Pune, Pune-Solapur, Surat-
Face Value: `10 Dahisar and Bharuch-Surat.
Shareholding pattern (Sep 2011) Construction revenues grew by 78.6% to `527.5Cr from `295.3Cr in Q2 FY12
8.4% driven by contribution from the 4 under construction projects as well as from
4.7%
completion of Surat-Dahisar.
13.3% EBIDTA Margins have fallen 316bps to 45.9% from 49.1% mainly due to higher
contribution from EPC business where the margins are much lower as compared
73.6%
to toll business. However there was improvement in construction margins y-o-y
due to fall in input cost from the peak.
Promoters FIIs DIIs Other Public PAT margins have fallen significantly 595bps to 14.5% from 20.4% due to higher
tax effect and higher interest charges.
Price Performance (%)
The company’s order backlog stood at `9635.1Cr which includes recently
1 Mth 3 Mths 6 Mths 1 Yr
bagged Ahmedabad mega highway project worth `3600Cr and work on the same
-24.2% -16.3% -25.7% -39.0%
would be commenced only in FY13.
Stock Price Performance
The management continues the guidance of 20% growth in both top line as well
110%
100%
as bottom line. Reviewing the half yearly performance the company has achieved
90% 53% of the expected growth. Even though there is slowdown in construction
80% activities, the company will still achieve its target for FY12.
70%
60%
50%
Outlook & Valuation
Nov-10
Jan-11
Mar-11
Jul-11
Sep-11
May-11
NHAI has awarded 3300kms of projects in the H1FY12 and continues with its targets
of 7300kms (20kms a day). Since IRB is prominent player in BOT projects, we expect
there will be immense opportunity for the company. We have added FY13 estimates
IRB SENSEX in our valuation. On the basis of valuation, we maintain positive outlook with ‘buy’
arriving revised target price of ` 197.9 per share. At CMP, stock is trading at a PE
Denil Savla, Analyst multiple of 8.05 and 7.04 of FY12E & FY13E earnings respectively.
(denil@keynoteindia.net)
(+9122-30266073)
Keynote Capitals Institutional Research is also available on
Bloomberg KNTE <GO>, Thomson One Analytics, Reuters Knowledge, Capital IQ, TheMarkets.com and securities.com
Keynote Capitals Institutional Research –awarded “India’s Best IPO Analyst 2009” by MCX-Zee Business
2. IRB Infrastructure Developer Ltd. – Q4FY11 Result Update
Our Analysis
Rising cost of interest – Not a threat
General concern for infrastructure companies is rise in interest rate. IRB is well
hedged portfolio has fixed interest rates for next 3 yrs. Its prime project Pune-Mumbai
expressway has outstanding debt of around `1040Cr which has fixed interest rate of
10.6% for the rest of the tenure i.e. for 8Years
Improvement in execution of E&C business
As the company currently has 4 new projects on which construction has already
started, major revenues are likely to be booked from these projects. The company
expects 15-20% growth in the E&C business in FY12 whereas major growth would
be in FY13 & FY14 as construction of the newly bagged project Ahmedabad-
Vadodara Expressway worth `3600Cr would start only in FY13.
Expecting substantial projects in another one year
Last 6 to 9 months NHAI announced considerable amounts of bids worth ~`36000Cr
and prequalification documents have been submitted but dates are not confirmed for
putting up financial bids. However, these bids are expected in H2 FY12 or in
H1FY13. IRB is confident of bagging new projects worth ~`4500Cr in FY12.
Surat-Dahisar expressway to be completed by this fiscal year
95% of the work is been completed and application of substantial completion
certificate is be send to NHAI. We expect the complete COD by end of this fiscal
year. However there won’t be any substantial rise in the revenue as the traffic is
diverted through Bhiwandi-Thane route. We expect normal growth of 10-12% Y-o-Y.
Daily gross toll collection of `3.04Cr
There has been substantial increase in the daily toll collection to `3.04Cr per day
from `2.4Cr per day mainly due to the rise in the toll rate in Pune-Mumbai of about
18%, toll revenue from Tumkur-chitradurg and rise in Thane-Bhiwandi traffic growth.
Project wise toll revenue growth (` Cr)
Projects Q2FY11 Q1FY12 Q2FY12 Y-o-Y Q-o-Q
TBB – 4 Mumbra 13.05 13.80 15.02 15.1% 8.8%
Kharpada 1.70 1.92 2.10 23.5% 9.4%
Nagar Karmala Tembhurni 3.60 3.59 3.70 2.8% 3.1%
Mohol Mandrup Kamptee 1.40 1.90 2.05 46.4% 7.9%
Pune Solapur 3.50 3.54 4.20 20.0% 18.6%
Pune Nashik 4.80 5.55 5.50 14.6% -0.9%
Mumbai Pune 76.10 80.87 80.20 5.4% -0.8%
Thane Ghodbandur 7.00 7.28 7.40 5.7% 1.6%
Surat Dahisar 90.70 95.46 98.20 8.3% 2.9%
Bharuch Surat 31.70 34.78 35.10 10.7% 0.9%
Tumkur Chitradurga - 11.40 38.70 - 239.5%
Gross Toll Revenues 227.7 266.927 305.1 34.0% 14.3%
(Source: Company and Keynote Capitals Institutional Research)
Page 2 Keynote Capitals Institutional Research
3. K E Y N O T E
INSTITUTIONAL RESEARCH
Equity Infused till date is `481Cr
The company has infused total equity of `481Cr in their 4 under construction
projects out of `1366Cr. It will also infuse around full equity in 2 of their projects so
that they could avail the government grant which will help them to execute projects
in faster manner. The company doesn’t expect any delay in the completion of the
under construction projects till date. All equity requirements would be funded
through internal accruals only. The company has already infused 35% of the equity
where as only 10-15% of work is completed on these projects as time taken for the
earth evacuation is longer.
Vadodara-Ahmedabad 1st Mega highways project bagged by IRB
The company has bagged Vadodara Ahmedabad mega highway project worth
`3678Cr with the concession of 25 year including 3 years of construction at a
premium of `309.6Cr in 1st year and thereafter 5% increase every year. We have
not included this project in our valuation due to lack of clarity. However we may add
it in FY13 as the construction work would only start in FY13.
Revision of order book
The company has revised its order book and has deleted the Panji-Goa project
worth `833Cr due to the land acquisition issues faced by NHAI and the government
has not given appointed date. Therefore we have also deleted the Panji-Goa
projects from our valuation as the project is expected to be cancelled.
Recent Bulk Deal happened
The promoter group sold about 10% of the stake and reduced their holding to
7.5%.Out of this 10% sell Mr. Virendra Mhaiskar has coulgght about 1.6% taking its
holding to 60% and rest were bought by FIIs as well as DIIs. The proceedings from
the sale were used for their own business plan. Currently, the promoters and its
group holding is 67.5% of which 10.65% of shares are pledge. As this happened
post Sept 2011 the effect would appear in Q3FY12.
Toll collection from Tumkur started and Kolhapur City project is expected in
Q3 FY12
Toll collection started from Tumkur-Chitradurg project from June 2011 as expected
and the toll collection for the Q2FY12 was `38.7Cr. Due to some procedural delay
Kolhapur City Roads would start somewhere in Q3FY12. The company expects
first full year operational revenue in the range `35-40Cr.
Quarterly Results P&L (` Cr)
Particulars Q2FY11 Q1FY12 Q2FY12 Y-o-Y Q-o-Q H1 FY11 H1 FY12 Y-o-Y
Net Sales 490.31 801.33 735.88 50.1% -8.2% 1002.34 1537.22 53.4%
Total Expenditure 253.94 471.89 414.40 63.2% -12.2% 516.67 886.28 71.5%
PBIDT (Excl OI) 236.37 329.44 321.48 36.0% -2.4% 485.67 650.94 34.0%
Other Income 8.22 28.22 30.07 265.8% 6.6% 29.89 58.28 95.0%
Operating Profit 244.59 357.66 351.55 43.7% -1.7% 515.56 709.22 37.6%
Interest 69.30 117.43 141.15 103.7% 20.2% 135.42 258.58 90.9%
PBDT 175.29 240.23 210.40 20.0% -12.4% 380.14 450.64 18.5%
Depreciation 54.43 60.23 62.85 15.5% 4.3% 108.11 123.08 13.8%
PBT 120.86 180.00 147.55 22.1% -18.0% 272.03 327.56 20.4%
Tax 19.03 44.26 36.69 92.8% -17.1% 49.37 80.94 63.9%
Profit After Tax 101.83 135.74 110.86 8.9% -18.3% 222.66 246.62 10.8%
Source: Company and Keynote Capitals Institutional Research
Keynote Capitals Institutional Research Page 3
4. IRB Infrastructure Developer Ltd. – Q4FY11 Result Update
Consolidated P&L (` Cr)
Particulars FY09 FY10 FY11 FY12E FY13E
Net Sales 991.90 1704.80 2438.11 3169.55 3699.31
Total Expenditure 553.00 905.80 1344.20 1655.01 1993.16
PBIDT (Excl OI) 438.90 799.00 1093.91 1514.54 1706.15
Other Income 28.20 48.90 64.49 80.00 75.00
Operating Profit 467.10 847.90 1158.40 1594.54 1781.15
Interest 137.70 249.40 357.20 452.46 481.11
PBDT 329.40 598.50 801.20 1142.08 1300.04
Depreciation 114.40 181.90 225.40 332.73 380.92
PBT 215.00 416.60 575.80 809.35 919.12
Tax 37.80 13.30 111.70 146.41 160.28
Profit After Tax 177.20 403.30 464.10 662.95 758.85
(E: Keynote Capitals Institutional Research Estimates)
Consolidated Balance sheet (` Cr)
Particulars FY09 FY10 FY11 FY12E FY13E
Share Capital 332.4 332.4 332.4 332.4 333.4
Total Reserves 1397.7 1707.5 2163.1 2814.8 3562.0
Shareholder's Funds 1730.1 2039.9 2495.5 3147.2 3895.4
Minority Interest 59.9 77.9 95.0 110.0 118.0
Deferred Liabilities 18.2 26.7 30.0 26.4 27.2
Total Debts 2485.9 2915.2 3379.9 4963.4 6091.3
Total Liabilities 4294.1 5059.7 6000.4 8246.9 10131.9
Net Block 2016.2 3467.4 4052.0 5301.8 6464.6
Capital Work in Progress 1454.5 880.2 897.6 1300.8 1380.9
Total Fixed Assets 3470.7 4347.6 4949.6 6602.6 7845.4
Investments 110.8 45.1 50.0 80.0 81.0
Total Current Assets 1018.1 1147.7 1630.5 2238.5 2896.4
Total Current Liabilities 306.5 481.6 630.5 675.6 693.3
Net Current Assets 711.6 666.1 1000.0 1562.9 2203.1
Total Assets 4294.1 5059.7 6000.4 8246.9 10131.9
(E: Keynote Capitals Institutional Research Estimates)
Consolidated Cash Flow (` Cr)
Particulars FY09 FY10 FY11 FY12E FY13E
Profit Before Tax 215.00 416.60 575.80 809.35 919.12
Add: Depreciation 114.40 181.90 225.40 332.73 380.92
Add: Interest Expenses 115.90 214.40 357.20 452.46 481.11
Changes In working Capital -140.10 185.00 50.16 -268.38 -526.53
Cash Flow after changes in WC 304.00 984.52 1208.56 1326.16 1255.63
Less:Tax Paid 42.40 81.20 111.70 146.41 160.28
Cash from Operating Activities 261.60 903.32 1096.86 1179.75 1095.35
Cash from Investing Activities -604.70 -1022.30 -782.31 -1938.45 -1547.45
Cash from Financing Activities 330.90 142.60 257.27 1053.24 565.74
Net Cash Inflow / Outflow -12.20 23.62 571.82 294.54 113.65
Opening Cash balance 111.02 98.82 122.44 694.26 988.80
Closing Cash balance 98.82 122.44 694.26 988.80 1102.45
(E: Keynote Capitals Institutional Research Estimates)
Page 4 Keynote Capitals Institutional Research
5. K E Y N O T E
INSTITUTIONAL RESEARCH
Ratios
Turnover Ratios FY08 FY09 FY10 FY11E FY12E
Total Assets Turnover 0.2 0.2 0.3 0.4 0.4
Fixed Assets Turnover 0.3 0.3 0.4 0.5 0.5
Net sales to net working capital 1.0 1.4 2.6 2.4 1.9
Net Working Capital Days 348.1 261.9 142.6 149.7 194.8
Inventory Turnover 14.6 4.8 10.0 12.0 12.0
Inventory Days 25.0 75.6 36.4 30.4 30.4
Advances Turnover 2.0 2.6 3.9 3.7 3.5
Advances Days 186.7 141.6 93.8 100.0 105.0
Debtors Turnover 62.1 76.3 57.4 40.2 42.9
Debtors Days 5.9 4.8 6.4 9.1 8.5
Creditors Turnover 3.1 4.2 5.7 5.5 6.6
Creditors Days 119.4 86.0 63.9 66.0 55.0
Valuation Ratios FY08 FY09 FY10 FY11E FY12E
Market Price (` ) 147.6 147.6 147.6 147.6 147.6
EPS (x) 3.8 5.3 12.1 14.0 17.3
Book Value Per Share 48.8 52.0 61.4 75.1 92.0
PE ( x) 38.8 27.7 12.2 10.6 8.5
P/BV (x) 3.0 2.8 2.4 2.0 1.6
EV/EBIDTA (x) 16.0 15.9 8.8 6.4 5.4
Market cap/Sales (x) 6.9 5.1 2.9 2.1 1.7
Return Ratios (%) FY08 FY09 FY10 FY11E FY12E
ROCE 9.9% 8.2% 13.2% 15.7% 13.3%
ROE 7.8% 10.2% 19.8% 18.6% 18.8%
Margins (%) FY08 FY09 FY10 FY11E FY12E
PBIDTA 63.3% 47.1% 49.7% 47.5% 46.5%
PBT 22.7% 21.7% 24.4% 23.6% 21.8%
PAT 17.3% 17.9% 23.7% 19.0% 19.5%
Other Ratios FY08 FY09 FY10 FY11E FY12E
Payout Ratio (%) 0.0% 28.1% 12.4% 10.7% 11.6%
Interest Cover (x) 1.9 2.6 2.7 2.6 2.6
EPS Growth (%) 0.0% 40.1% 127.6% 15.1% 23.9%
(E: Keynote Capitals Institutional Research Estimates)
Keynote Capitals Institutional Research Page 5
6. IRB Infrastructure Developer Ltd. – Q4FY11 Result Update
Institutional Equity Team
Rakesh Chaudhary
(CEO ) rakesh@keynotecapitals.net
Analysts / Associates
Denil Savla denil@keynoteindia.net +91 22 3026 6073
Deepak Kolhe deepak@keynotecapitals.net +9122 3026 6084
Rohan Admane rohan@keynoteindia.net +91 22 2269 6059
Rajesh Sinha rajesh@keynotecapitals.net +91 22 30266088
Mamta Singh mamta.singh@keynotecapitals.net +91 22 3026 6057
Technical Analyst
Sanjay Bhatia sanjay@keynotecapitals.net +91 22 3026 6065
Dealing / Sales
Nilesh Dhruv nilesh@keynoteindia.net +91 22 3026 6040
Puja Shah puja.shah@keynoteindia.net +91 22 3026 6072
Nisha Sharma nisha@keynoteindia.net +91 22 3026 6057
KEYNOTE CAPITALS LTD.
Member
Stock Exchange, Mumbai (INB 010930556)
National Stock Exchange of India Ltd. (INB 230930539)
Over the Counter Exchange of India Ltd. (INB 200930535)
Central Depository Services Ltd. (IN-DP-CDSL-152-2001)
4th Floor, Balmer Lawrie Building, 5, J. N. Heredia Marg, Ballard Estate, Mumbai 400 001. INDIA
Tel. : 9122-2269 4322 / 24 / 25 • www.keynoteindia.net
DISCLAIMER
• This report has been prepared and issued by Keynote Capitals Limited, based solely on public information and sources believed to be reliable.
• Neither the information nor any opinion expressed herein, constitutes an offer, or an invitation to make an offer, to buy or sell any securities or any
options, futures or other derivatives related to such securities and also for the purpose of trading activities.
• Keynote Capitals Limited makes no guarantee, representation or warranty, express or implied and accepts no responsibility or liability as to the
accuracy or completeness or correctness of the information in this report.
• Keynote Capitals and its affiliates and their respective officers, directors and employees may hold positions in any securities mentioned in this
Report (or in any related investment) and may from time to time add to or dispose of any securities or investments.
• Keynote Capitals may also have proprietary trading positions in securities covered in this report or in related instruments.
• An affiliate of Keynote Capitals Limited may also perform or seek to perform broking, investment banking and other banking services for the
company under coverage.
• If ‘Buy’, ‘Sell’, or ‘Hold’ recommendation is made in this Report, such recommendation or view or opinion expressed on investments in this Report
is not intended to constitute investment advice and should not be intended or treated as a substitute for necessary review or validation or any
professional advice. The views expressed in this Report are those of the analyst which are subject to change and do not represent to be an
authority on the subject. Keynote Capitals may or may not subscribe to any and/ or all the views expressed herein.
• The opinions presented herein are liable to change without any notice.
• Though due care has been taken in the preparation of this report, Keynote Capitals limited or any of its directors, officers or employees shall be in
any way be responsible for any loss arising from the use thereof.
• Investors are advised to apply their judgment before acting on the contents of this report.
• This report or any portion hereof may not be reprinted, sold or redistributed without the written consent of Keynote Capitals Limited.
Page 6 Keynote Capitals Institutional Research