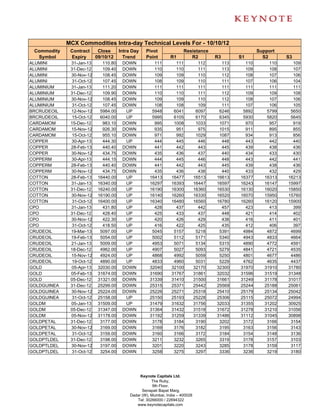
2. MCX Commodities Intra-day Technical Levels For - 10/10/12
Commodity Contract Close Intra Day Pivot Resistance Support
Symbol Expiry 09/10/12 Trend Point R1 R2 R3 S1 S2 S3
KAPAS 30-Apr-13 957.50 UP 949 969 980 1011 938 918 887
KAPAS 30-Mar-13 932.60 UP 923 945 957 990 911 890 857
KAPASKHALI 30-Apr-13 1513.00 UP 1511 1523 1534 1556 1501 1489 1466
KAPASKHALI 30-Mar-13 1506.00 UP 1505 1515 1523 1542 1496 1486 1468
KAPASKHALI 28-Feb-13 1505.00 UP 1493 1520 1536 1579 1477 1450 1407
KAPASKHALI 31-Jan-13 1486.50 UP 1475 1503 1520 1565 1458 1430 1385
KAPASKHALI 31-Dec-12 1472.50 UP 1462 1490 1508 1555 1444 1415 1369
LEAD 31-Jan-13 118.85 DOWN 119 119 119 120 119 118 118
LEAD 31-Dec-12 118.65 DOWN 119 119 119 120 118 118 118
LEAD 30-Nov-12 118.55 DOWN 119 119 119 120 118 118 117
LEAD 31-Oct-12 118.45 DOWN 119 119 119 120 118 118 117
LEADMINI 31-Jan-13 118.90 DOWN 119 119 119 120 119 118 118
LEADMINI 31-Dec-12 118.70 DOWN 119 119 120 120 118 118 117
LEADMINI 30-Nov-12 118.60 DOWN 119 119 120 120 118 118 117
LEADMINI 31-Oct-12 118.40 DOWN 119 119 119 120 118 118 117
MENTHAOIL 31-Jan-13 1212.10 UP 1204 1222 1231 1258 1195 1177 1150
MENTHAOIL 31-Dec-12 1199.90 UP 1194 1210 1220 1245 1185 1169 1144
MENTHAOIL 30-Nov-12 1188.20 UP 1182 1199 1209 1236 1171 1154 1127
MENTHAOIL 31-Oct-12 1173.70 UP 1167 1185 1196 1225 1155 1137 1108
NATURALGAS 26-Dec-12 208.50 UP 207 211 214 222 204 199 191
NATURALGAS 27-Nov-12 200.00 UP 198 203 206 215 195 190 182
NATURALGAS 26-Oct-12 184.40 UP 182 188 191 201 179 173 164
NICKEL 31-Jan-13 972.90 UP 972 976 980 987 969 965 958
NICKEL 31-Dec-12 961.60 DOWN 964 969 977 991 956 950 937
NICKEL 30-Nov-12 954.30 DOWN 957 963 972 986 949 943 928
NICKEL 31-Oct-12 947.60 DOWN 950 956 965 979 942 936 921
NICKELM 31-Jan-13 968.20 DOWN 970 974 979 989 964 960 951
NICKELM 31-Dec-12 960.30 DOWN 964 968 977 989 956 951 938
NICKELM 30-Nov-12 954.50 DOWN 957 963 971 985 949 943 929
NICKELM 31-Oct-12 947.60 DOWN 950 956 965 979 942 936 922
POTATO 15-Apr-13 705.20 UP 704 709 712 720 701 696 688
POTATO 15-Mar-13 733.80 UP 732 738 743 754 727 721 710
POTATO 15-Oct-12 766.10 DOWN 767 771 775 783 763 759 751
POTATOTRWR 15-Oct-12 905.70 DOWN 908 913 920 931 901 897 885
SILVER 04-May-13 64712.00 UP 64676 64916 65121 65566 64471 64231 63786
SILVER 05-Mar-13 63391.00 UP 63243 63635 63880 64517 62998 62606 61969
SILVER 05-Dec-12 61675.00 UP 61525 61931 62186 62847 61270 60864 60203
SILVER1000 31-Dec-12 61917.00 DOWN 61917 61917 61917 61917 61917 61917 61917
SILVER1000 30-Nov-12 61658.00 UP 61562 61868 62077 62592 61353 61047 60532
SILVER1000 31-Oct-12 61343.00 UP 61214 61629 61914 62614 60929 60514 59814
SILVERM 30-Apr-13 64947.00 UP 64822 65190 65433 66044 64579 64211 63600
SILVERM 28-Feb-13 63406.00 UP 63257 63663 63920 64583 63000 62594 61931
SILVERM 30-Nov-12 61692.00 UP 61547 61944 62195 62843 61296 60899 60251
SILVERMIC 30-Apr-13 64953.00 UP 64807 65184 65415 66023 64576 64199 63591
SILVERMIC 28-Feb-13 63406.00 UP 63260 63656 63905 64550 63011 62615 61970
SILVERMIC 30-Nov-12 61692.00 UP 61547 61940 62188 62829 61299 60906 60265
SUGARMKOL 20-Dec-12 3555.00 UP 1185 2370 1185 1185 2370 1185 1185
SUGARMKOL 20-Nov-12 3522.00 UP 1174 2348 1174 1174 2348 1174 1174
SUGARMKOL 19-Oct-12 3546.00 UP 1182 2364 1182 1182 2364 1182 1182
Keynote Capitals Ltd.
The Ruby,
9th Floor,
Senapati Bapat Marg,
Dadar (W), Mumbai, India – 400028
Tel: 30266000 / 22694322
www.keynotecapitals.com
3. MCX Commodities Intra-day Technical Levels For - 10/10/12
Commodity Contract Close Intra Day Pivot Resistance Support
Symbol Expiry 09/10/12 Trend Point R1 R2 R3 S1 S2 S3
WHEAT 20-Dec-12 1603.30 UP 534 1069 534 534 1069 534 534
WHEAT 20-Nov-12 1606.00 UP 535 1071 535 535 1071 535 535
WHEAT 19-Oct-12 1584.10 UP 528 1056 528 528 1056 528 528
ZINC 31-Jan-13 107.65 DOWN 108 108 108 108 108 107 107
ZINC 31-Dec-12 107.10 DOWN 107 108 109 110 107 106 105
ZINC 30-Nov-12 106.25 DOWN 107 107 108 110 106 105 104
ZINC 31-Oct-12 105.30 DOWN 106 106 107 109 105 104 103
ZINCMINI 31-Jan-13 108.00 DOWN 108 109 110 111 107 107 105
ZINCMINI 31-Dec-12 107.00 DOWN 107 108 109 110 107 106 105
ZINCMINI 30-Nov-12 106.25 DOWN 107 107 108 110 106 105 104
ZINCMINI 31-Oct-12 105.30 DOWN 106 106 107 109 105 104 103
Sanjay Bhatia (AVP – Technical Research),
Email Id sanjay@keynotecapitals.net
Pivot Point: Intra- Day Trading Tool. - The key to the use of this tool is the use of Stop Loss
Intra Day Trend: It is valid only till the point where Price trades above Pivot Point. For Eg. “UP” would be valid till Price
remains above Pivot Point. It would become “DOWN” in event Price trades below Pivot Point.
Pivot Point (PP): This is a trigger point for Intra Day Buy / Sell based on the price range of the previous day.
R1: Resistance 1: 1st Resistance level over Pivot Point, R2: Resistance 2: Next Resistance level after R1.
R3: Resistance 3: Next Resistance level after R2.
S1: Support 1: 1st Support level after Pivot Point, S2: Support 2: Next Support level after S1.
S3: Support 3: Next Support level after S2.
Note: As per this tool, the trader should take BUY position just above the Pivot Point and keep the Pivot Point level as stop
loss and the first target would be R1 level (Resistance 1). If R1 is crossed then R2 (Resistance 2) becomes the next target
with the stop loss placed at R1 level. If R2 is crossed then R3 (Resistance 3) becomes the next target with the stop loss
placed at R2 level.
Similarly if price goes below the Pivot Point the trader should take a SELL position and keep the Pivot Point level as the
stop loss and the first target would be S1 level (Support 1). If S1 level is breached then S2 level (Support 2) becomes the
next target with the stop loss placed at S1 level. If S2 level is breached then S3 level (Support 3) becomes the next target
with the stop loss placed at S2 level.
Disclaimer: This document is not for public distribution and has been furnished to you solely for your information and must not be reproduced or
redistributed to any other person. Persons into whose possession this document may come are required to observe these restrictions. This material is
for the personal information of the authorized recipient, and we are not soliciting any action based upon it. This report is not to be construed as an offer
to sell or the solicitation of an offer to buy any security in any jurisdiction where such an offer or solicitation would be illegal. It is for the general
information of clients of Keynote Capitals Ltd. It does not constitute a personal recommendation or take into account the particular investment
objectives, financial situations, or needs of individual clients. We have reviewed the report, and in so far as it includes current or historical information,
it is believed to be reliable though its accuracy or completeness cannot be guaranteed. Neither Keynote Capitals Ltd., nor any person connected with
it, accepts any liability arising from the use of this document. The recipients of this material should rely on their own investigations and take their own
professional advice. Price and value of the investments referred to in this material may go up or down. Past performance is not a guide for future
performance. Certain transactions -including those involving futures, options and other derivatives as well as non-investment grade securities - involve
substantial risk and are not suitable for all investors. Reports based on technical analysis centers on studying charts of a stock’s price movement and
trading volume, as opposed to focusing on a company’s fundamentals and as such, may not match with a report on a company’s fundamentals.
Opinions expressed are our current opinions as of the date appearing on this material only. While we endeavor to update on a reasonable basis the
information discussed in this material, there may be regulatory, compliance, or other reasons that prevent us from doing so. Prospective investors and
others are cautioned that any forward-looking statements are not predictions and may be subject to change without notice. Our proprietary trading and
investment businesses may make investment decisions that are inconsistent with the recommendations expressed herein. We and our affiliates,
officers, directors, and employees world wide may: (a) from time to time, have long or short positions in, and buy or sell the securities thereof, of
company (ies) mentioned herein or (b) be engaged in any other transaction involving such securities and earn brokerage or other compensation or act
as a market maker in the financial instruments of the company (ies) discussed herein or act as advisor or lender / borrower to such company (ies) or
have other potential conflict of interest with respect to any recommendation and related information and opinions. The analyst for this report certifies
that all of the views expressed in this report accurately reflect his or her personal views about the subject company or companies and its or their
securities, and no part of his or her compensation was, is or will be, directly or indirectly related to specific recommendations or views expressed in this
report. No part of this material may be duplicated in any form and/or redistributed without Keynote Capitals Ltd’s., prior written consent.
Keynote Capitals Ltd.
The Ruby,
9th Floor,
Senapati Bapat Marg,
Dadar (W), Mumbai, India – 400028
Tel: 30266000 / 22694322
www.keynotecapitals.com