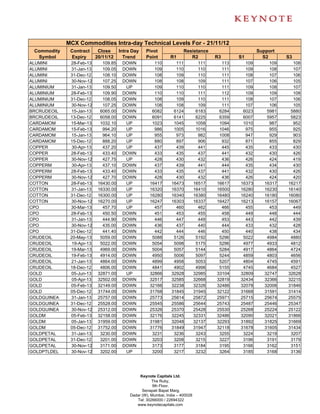
2. MCX Commodities Intra-day Technical Levels For - 21/11/12
Commodity Contract Close Intra Day Pivot Resistance Support
Symbol Expiry 20/11/12 Trend Point R1 R2 R3 S1 S2 S3
GOLDPTLDEL 31-Dec-12 3220.00 DOWN 3223 3247 3273 3323 3197 3173 3123
GOLDPTLDEL 31-Jan-13 3259.00 DOWN 3264 3282 3306 3348 3240 3222 3180
KAPAS 30-Apr-13 981.70 DOWN 983 987 992 1001 978 974 965
KAPAS 30-Mar-13 964.60 UP 963 969 973 984 958 952 941
KAPASKHALI 30-Apr-13 1505.00 DOWN 1505 1505 1505 1505 1505 1505 1505
KAPASKHALI 30-Mar-13 1503.50 DOWN 1510 1519 1535 1560 1494 1485 1460
KAPASKHALI 28-Feb-13 1484.50 UP 1483 1492 1499 1515 1476 1467 1451
KAPASKHALI 31-Jan-13 1462.00 UP 1462 1470 1477 1493 1454 1446 1431
KAPASKHALI 31-Dec-12 1449.50 UP 1447 1455 1460 1472 1442 1435 1422
LEAD 28-Feb-13 119.75 UP 120 120 120 121 120 119 119
LEAD 31-Jan-13 119.45 DOWN 120 120 121 122 119 119 117
LEAD 31-Dec-12 119.60 DOWN 120 120 121 122 119 119 117
LEAD 30-Nov-12 119.60 DOWN 120 121 122 123 119 119 117
LEADMINI 28-Feb-13 119.40 DOWN 120 120 121 122 119 119 118
LEADMINI 31-Jan-13 119.45 DOWN 120 120 121 122 119 119 118
LEADMINI 31-Dec-12 119.60 DOWN 120 120 121 123 119 119 117
LEADMINI 30-Nov-12 119.60 DOWN 120 121 122 123 119 119 117
MENTHAOIL 28-Feb-13 1270.40 DOWN 1276 1293 1315 1353 1254 1238 1199
MENTHAOIL 31-Jan-13 1274.40 UP 1274 1288 1301 1328 1261 1247 1220
MENTHAOIL 31-Dec-12 1265.00 UP 1265 1280 1295 1325 1250 1235 1205
MENTHAOIL 30-Nov-12 1250.90 DOWN 1252 1267 1282 1312 1236 1222 1191
NATURALGAS 28-Jan-13 219.00 UP 218 220 222 225 217 214 211
NATURALGAS 26-Dec-12 217.00 UP 216 219 220 224 214 212 207
NATURALGAS 27-Nov-12 209.90 UP 209 212 213 218 207 204 199
NICKEL 28-Feb-13 935.40 DOWN 936 945 955 975 926 917 897
NICKEL 31-Jan-13 925.50 UP 925 933 941 957 917 909 893
NICKEL 31-Dec-12 917.10 UP 916 926 934 952 908 898 880
NICKEL 30-Nov-12 909.50 UP 909 919 928 948 899 889 869
NICKELM 28-Feb-13 938.10 UP 936 944 950 963 931 923 910
NICKELM 31-Jan-13 925.20 UP 924 933 941 958 916 907 890
NICKELM 31-Dec-12 917.10 UP 916 926 934 952 907 898 880
NICKELM 30-Nov-12 909.50 UP 909 919 928 948 899 889 869
POTATO 15-Apr-13 705.50 UP 705 707 709 712 704 702 698
POTATO 15-May-13 724.20 UP 723 726 728 733 721 718 713
POTATO 15-Mar-13 737.40 UP 737 740 742 748 734 732 726
SILVER 04-May-13 64888.00 DOWN 64999 65168 65449 65899 64718 64549 64099
SILVER 05-Mar-13 63474.00 DOWN 63548 63776 64078 64608 63246 63018 62488
SILVER 05-Dec-12 61536.00 DOWN 61644 61863 62190 62736 61317 61098 60552
SILVER1000 31-Jan-13 61990.00 DOWN 61990 61990 61990 61990 61990 61990 61990
SILVER1000 31-Dec-12 61868.00 DOWN 61898 61997 62125 62352 61770 61671 61444
SILVER1000 30-Nov-12 61417.00 DOWN 61519 61698 61980 62441 61237 61058 60597
SILVERM 30-Apr-13 64902.00 DOWN 64984 65218 65534 66084 64668 64434 63884
SILVERM 28-Feb-13 63485.00 DOWN 63569 63789 64092 64615 63266 63046 62523
SILVERM 30-Nov-12 61542.00 DOWN 61648 61864 62185 62722 61327 61111 60574
SILVERMIC 30-Apr-13 64903.00 DOWN 64985 65193 65483 65981 64695 64487 63989
SILVERMIC 28-Feb-13 63474.00 DOWN 63563 63777 64079 64595 63261 63047 62531
Keynote Capitals Ltd.
The Ruby,
9th Floor,
Senapati Bapat Marg,
Dadar (W), Mumbai, India – 400028
Tel: 30266000 / 22694322
www.keynotecapitals.com
3. MCX Commodities Intra-day Technical Levels For - 21/11/12
Commodity Contract Close Intra Day Pivot Resistance Support
Symbol Expiry 20/11/12 Trend Point R1 R2 R3 S1 S2 S3
SILVERMIC 30-Nov-12 61545.00 DOWN 61650 61870 62195 62740 61325 61105 60560
STEELRPR 20-Dec-12 30180.00 DOWN 30190 30270 30360 30530 30100 30020 29850
STEELRPR 18-Jan-13 30390.00 DOWN 30427 30503 30617 30807 30313 30237 30047
ZINC 31-Jan-13 107.45 UP 107 108 108 109 107 107 106
ZINC 31-Dec-12 106.20 DOWN 106 107 107 108 106 105 105
ZINC 30-Nov-12 105.05 DOWN 105 106 106 107 105 104 103
ZINCMINI 28-Feb-13 107.75 DOWN 108 108 109 109 107 107 106
ZINCMINI 31-Jan-13 107.10 DOWN 107 108 108 109 107 106 106
ZINCMINI 31-Dec-12 106.20 DOWN 106 107 107 108 106 105 105
ZINCMINI 30-Nov-12 105.05 DOWN 105 106 106 108 105 104 103
Sanjay Bhatia (AVP – Technical Research),
Email Id sanjay@keynotecapitals.net
Pivot Point: Intra- Day Trading Tool. - The key to the use of this tool is the use of Stop Loss
Intra Day Trend: It is valid only till the point where Price trades above Pivot Point. For Eg. “UP” would be valid till Price
remains above Pivot Point. It would become “DOWN” in event Price trades below Pivot Point.
Pivot Point (PP): This is a trigger point for Intra Day Buy / Sell based on the price range of the previous day.
R1: Resistance 1: 1st Resistance level over Pivot Point, R2: Resistance 2: Next Resistance level after R1.
R3: Resistance 3: Next Resistance level after R2.
S1: Support 1: 1st Support level after Pivot Point, S2: Support 2: Next Support level after S1.
S3: Support 3: Next Support level after S2.
Note: As per this tool, the trader should take BUY position just above the Pivot Point and keep the Pivot Point level as stop
loss and the first target would be R1 level (Resistance 1). If R1 is crossed then R2 (Resistance 2) becomes the next target
with the stop loss placed at R1 level. If R2 is crossed then R3 (Resistance 3) becomes the next target with the stop loss
placed at R2 level.
Similarly if price goes below the Pivot Point the trader should take a SELL position and keep the Pivot Point level as the
stop loss and the first target would be S1 level (Support 1). If S1 level is breached then S2 level (Support 2) becomes the
next target with the stop loss placed at S1 level. If S2 level is breached then S3 level (Support 3) becomes the next target
with the stop loss placed at S2 level.
Disclaimer: This document is not for public distribution and has been furnished to you solely for your information and must not be reproduced or
redistributed to any other person. Persons into whose possession this document may come are required to observe these restrictions. This material is
for the personal information of the authorized recipient, and we are not soliciting any action based upon it. This report is not to be construed as an offer
to sell or the solicitation of an offer to buy any security in any jurisdiction where such an offer or solicitation would be illegal. It is for the general
information of clients of Keynote Capitals Ltd. It does not constitute a personal recommendation or take into account the particular investment
objectives, financial situations, or needs of individual clients. We have reviewed the report, and in so far as it includes current or historical information,
it is believed to be reliable though its accuracy or completeness cannot be guaranteed. Neither Keynote Capitals Ltd., nor any person connected with
it, accepts any liability arising from the use of this document. The recipients of this material should rely on their own investigations and take their own
professional advice. Price and value of the investments referred to in this material may go up or down. Past performance is not a guide for future
performance. Certain transactions -including those involving futures, options and other derivatives as well as non-investment grade securities - involve
substantial risk and are not suitable for all investors. Reports based on technical analysis centers on studying charts of a stock’s price movement and
trading volume, as opposed to focusing on a company’s fundamentals and as such, may not match with a report on a company’s fundamentals.
Opinions expressed are our current opinions as of the date appearing on this material only. While we endeavor to update on a reasonable basis the
information discussed in this material, there may be regulatory, compliance, or other reasons that prevent us from doing so. Prospective investors and
others are cautioned that any forward-looking statements are not predictions and may be subject to change without notice. Our proprietary trading and
investment businesses may make investment decisions that are inconsistent with the recommendations expressed herein. We and our affiliates,
officers, directors, and employees world wide may: (a) from time to time, have long or short positions in, and buy or sell the securities thereof, of
company (ies) mentioned herein or (b) be engaged in any other transaction involving such securities and earn brokerage or other compensation or act
as a market maker in the financial instruments of the company (ies) discussed herein or act as advisor or lender / borrower to such company (ies) or
have other potential conflict of interest with respect to any recommendation and related information and opinions. The analyst for this report certifies
that all of the views expressed in this report accurately reflect his or her personal views about the subject company or companies and its or their
securities, and no part of his or her compensation was, is or will be, directly or indirectly related to specific recommendations or views expressed in this
report. No part of this material may be duplicated in any form and/or redistributed without Keynote Capitals Ltd’s., prior written consent.
Keynote Capitals Ltd.
The Ruby,
9th Floor,
Senapati Bapat Marg,
Dadar (W), Mumbai, India – 400028
Tel: 30266000 / 22694322
www.keynotecapitals.com