MCX Commodity Technical Levels
•
0 j'aime•453 vues

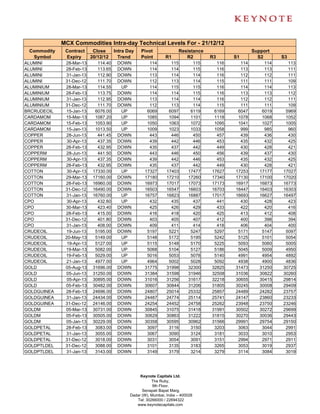
The document provides intraday technical levels for various commodities trading on the MCX exchange in India on December 21, 2012. It lists the commodity, contract expiration, previous day's close price, intraday trend, pivot point, and resistance and support levels. Technical analysis is used to identify levels that traders can reference to determine potential resistance and support levels for each commodity on an intraday basis.

Recommandé
Recommandé
Contenu connexe
Tendances
Tendances (20)
En vedette
En vedette (20)
Similaire à MCX Commodity Technical Levels
Similaire à MCX Commodity Technical Levels (10)
Plus de Keynote Capitals Ltd.
Plus de Keynote Capitals Ltd. (20)
MCX Commodity Technical Levels
- 1. MCX Commodities Intra-day Technical Levels For - 21/12/12 Commodity Contract Close Intra Day Pivot Resistance Support Symbol Expiry 20/12/12 Trend Point R1 R2 R3 S1 S2 S3 ALUMINI 28-Mar-13 114.40 DOWN 114 115 115 116 114 114 113 ALUMINI 28-Feb-13 113.65 DOWN 114 114 115 116 113 113 111 ALUMINI 31-Jan-13 112.90 DOWN 113 114 114 116 112 112 111 ALUMINI 31-Dec-12 111.70 DOWN 112 113 114 115 111 111 109 ALUMINIUM 28-Mar-13 114.55 UP 114 115 115 116 114 114 113 ALUMINIUM 28-Feb-13 113.75 DOWN 114 114 115 116 113 113 112 ALUMINIUM 31-Jan-13 112.95 DOWN 113 114 114 116 112 112 111 ALUMINIUM 31-Dec-12 111.70 DOWN 112 113 114 115 111 111 109 BRCRUDEOIL 15-Jan-13 6076.00 UP 6069 6097 6119 6169 6047 6019 5969 CARDAMOM 15-Mar-13 1087.20 UP 1085 1094 1101 1118 1078 1068 1052 CARDAMOM 15-Feb-13 1053.90 UP 1050 1063 1072 1095 1041 1027 1005 CARDAMOM 15-Jan-13 1013.50 UP 1009 1023 1033 1058 999 985 960 COPPER 28-Jun-13 441.45 DOWN 443 446 450 457 439 436 430 COPPER 30-Apr-13 437.35 DOWN 439 442 446 453 435 432 425 COPPER 28-Feb-13 432.95 DOWN 435 437 442 449 430 428 421 COPPERM 28-Jun-13 441.50 DOWN 443 446 450 456 439 437 430 COPPERM 30-Apr-13 437.35 DOWN 439 442 446 453 435 432 425 COPPERM 28-Feb-13 432.95 DOWN 435 437 442 449 430 428 421 COTTON 30-Apr-13 17330.00 UP 17327 17403 17477 17627 17253 17177 17027 COTTON 29-Mar-13 17160.00 DOWN 17180 17210 17260 17340 17130 17100 17020 COTTON 28-Feb-13 16960.00 DOWN 16973 17017 17073 17173 16917 16873 16773 COTTON 31-Dec-12 16490.00 DOWN 16503 16547 16603 16703 16447 16403 16303 COTTON 31-Jan-13 16760.00 UP 16757 16823 16887 17017 16693 16627 16497 CPO 30-Apr-13 432.60 UP 432 435 437 441 430 428 423 CPO 30-Mar-13 423.40 DOWN 425 426 429 433 422 420 416 CPO 28-Feb-13 415.00 DOWN 416 418 420 425 413 412 408 CPO 31-Dec-12 401.80 DOWN 403 405 407 412 400 398 394 CPO 31-Jan-13 408.00 DOWN 409 411 414 418 406 404 400 CRUDEOIL 19-Jun-13 5195.00 DOWN 5197 5221 5247 5297 5171 5147 5097 CRUDEOIL 20-May-13 5149.00 UP 5148 5172 5195 5242 5125 5101 5054 CRUDEOIL 19-Apr-13 5127.00 UP 5115 5148 5170 5225 5093 5060 5005 CRUDEOIL 19-Mar-13 5082.00 UP 5068 5104 5127 5186 5045 5009 4950 CRUDEOIL 19-Feb-13 5029.00 UP 5016 5053 5078 5140 4991 4954 4892 CRUDEOIL 21-Jan-13 4977.00 UP 4964 5002 5028 5092 4938 4900 4836 GOLD 05-Aug-13 31696.00 DOWN 31775 31998 32300 32825 31473 31250 30725 GOLD 05-Jun-13 31250.00 DOWN 31384 31598 31946 32508 31036 30822 30260 GOLD 05-Apr-13 30895.00 DOWN 31016 31256 31617 32218 30655 30415 29814 GOLD 05-Feb-13 30482.00 DOWN 30607 30844 31206 31805 30245 30008 29409 GOLDGUINEA 28-Feb-13 24696.00 DOWN 24807 25014 25332 25857 24489 24282 23757 GOLDGUINEA 31-Jan-13 24434.00 DOWN 24487 24774 25114 25741 24147 23860 23233 GOLDGUINEA 31-Dec-12 24146.00 DOWN 24254 24452 24758 25262 23948 23750 23246 GOLDM 05-Mar-13 30731.00 DOWN 30845 31075 31418 31991 30502 30272 29699 GOLDM 05-Feb-13 30505.00 DOWN 30629 30863 31222 31815 30270 30036 29443 GOLDM 05-Jan-13 30229.00 DOWN 30358 30595 30962 31566 29991 29754 29150 GOLDPETAL 28-Feb-13 3083.00 DOWN 3097 3116 3150 3203 3063 3044 2991 GOLDPETAL 31-Jan-13 3055.00 DOWN 3067 3090 3124 3181 3033 3010 2953 GOLDPETAL 31-Dec-12 3018.00 DOWN 3031 3054 3091 3151 2994 2971 2911 GOLDPTLDEL 31-Dec-12 3088.00 DOWN 3101 3135 3183 3265 3053 3019 2937 GOLDPTLDEL 31-Jan-13 3143.00 DOWN 3149 3179 3214 3279 3114 3084 3019 Keynote Capitals Ltd. The Ruby, 9th Floor, Senapati Bapat Marg, Dadar (W), Mumbai, India – 400028 Tel: 30266000 / 22694322 www.keynotecapitals.com
- 2. MCX Commodities Intra-day Technical Levels For - 21/12/12 Commodity Contract Close Intra Day Pivot Resistance Support Symbol Expiry 20/12/12 Trend Point R1 R2 R3 S1 S2 S3 GOLDPTLDEL 28-Feb-13 3155.00 DOWN 3157 3184 3212 3267 3129 3102 3047 KAPAS 30-Mar-13 1014.80 DOWN 1016 1021 1026 1037 1010 1006 996 KAPAS 30-Apr-13 1025.10 DOWN 1027 1032 1039 1052 1020 1014 1002 KAPASKHALI 30-Apr-13 1565.00 DOWN 1565 1570 1575 1585 1560 1555 1545 KAPASKHALI 30-Mar-13 1527.50 UP 1526 1536 1544 1562 1518 1508 1490 KAPASKHALI 28-Feb-13 1491.50 UP 1489 1502 1512 1534 1479 1467 1444 KAPASKHALI 31-Dec-12 1426.50 UP 1425 1436 1446 1467 1415 1404 1383 KAPASKHALI 31-Jan-13 1453.50 UP 1453 1464 1475 1497 1442 1431 1409 LEAD 28-Mar-13 126.95 DOWN 127 127 128 128 127 126 126 LEAD 28-Feb-13 127.00 UP 127 127 128 129 126 126 125 LEAD 31-Jan-13 126.70 UP 127 127 128 129 126 126 125 LEAD 31-Dec-12 126.50 UP 126 127 128 129 126 125 124 LEADMINI 28-Mar-13 126.75 DOWN 127 127 128 129 126 126 125 LEADMINI 28-Feb-13 126.80 UP 127 127 128 129 126 126 125 LEADMINI 31-Jan-13 126.60 UP 127 127 127 128 126 126 125 LEADMINI 31-Dec-12 126.45 UP 126 127 127 129 126 125 124 MENTHAOIL 30-Mar-13 1378.20 DOWN 1383 1390 1403 1422 1371 1364 1344 MENTHAOIL 28-Feb-13 1382.50 DOWN 1384 1392 1402 1419 1375 1367 1349 MENTHAOIL 31-Jan-13 1377.40 DOWN 1380 1389 1400 1420 1369 1360 1340 MENTHAOIL 31-Dec-12 1362.90 DOWN 1365 1375 1387 1410 1353 1343 1321 NATURALGAS 25-Feb-13 194.20 UP 193 197 200 206 190 186 180 NATURALGAS 28-Jan-13 192.20 UP 191 195 198 205 188 184 177 NATURALGAS 26-Dec-12 188.70 UP 188 192 195 203 184 180 172 NICKEL 28-Mar-13 976.00 DOWN 976 982 987 998 971 965 955 NICKEL 28-Feb-13 967.50 DOWN 970 976 984 999 961 955 940 NICKEL 31-Jan-13 962.40 DOWN 963 971 979 994 955 948 933 NICKEL 31-Dec-12 956.60 DOWN 958 966 976 994 948 939 921 NICKELM 28-Mar-13 976.40 UP 976 982 987 998 971 965 954 NICKELM 28-Feb-13 968.70 DOWN 970 976 984 998 962 956 942 NICKELM 31-Jan-13 962.40 DOWN 964 971 979 995 955 948 933 NICKELM 31-Dec-12 956.60 DOWN 958 966 975 992 949 941 924 POTATO 15-Apr-13 679.70 UP 677 683 686 696 674 668 659 POTATO 15-Mar-13 715.20 UP 713 718 721 730 710 704 696 POTATO 15-May-13 679.40 UP 677 683 687 698 673 667 656 SILVER 05-Jul-13 60149.00 DOWN 60897 61832 63516 66135 59213 58278 55659 SILVER 04-May-13 58660.00 DOWN 59506 60446 62233 64960 57719 56779 54052 SILVER 05-Mar-13 57351.00 DOWN 58163 59102 60854 63545 56411 55472 52781 SILVER1000 28-Feb-13 57750.00 DOWN 58250 59499 61248 64246 56501 55252 52254 SILVER1000 31-Jan-13 56844.00 DOWN 57415 59204 61565 65715 55054 53265 49115 SILVER1000 31-Dec-12 56064.00 DOWN 56690 57825 59585 62480 54930 53795 50900 SILVERM 29-Jun-13 60044.00 DOWN 60881 61813 63581 66281 59113 58181 55481 SILVERM 30-Apr-13 58696.00 DOWN 59542 60489 62281 65020 57750 56803 54064 SILVERM 28-Feb-13 57395.00 DOWN 58196 59131 60867 63538 56460 55525 52854 SILVERMIC 29-Jun-13 60067.00 DOWN 60916 61855 63644 66372 59127 58188 55460 SILVERMIC 30-Apr-13 58714.00 DOWN 59545 60489 62265 64985 57769 56825 54105 SILVERMIC 28-Feb-13 57397.00 DOWN 58197 59132 60866 63535 56463 55528 52859 Keynote Capitals Ltd. The Ruby, 9th Floor, Senapati Bapat Marg, Dadar (W), Mumbai, India – 400028 Tel: 30266000 / 22694322 www.keynotecapitals.com
- 3. MCX Commodities Intra-day Technical Levels For - 21/12/12 Commodity Contract Close Intra Day Pivot Resistance Support Symbol Expiry 20/12/12 Trend Point R1 R2 R3 S1 S2 S3 STEELRPR 20-Mar-13 31650.00 DOWN 31693 31997 32343 32993 31347 31043 30393 STEELRPR 20-Dec-12 29560.00 DOWN 29837 30073 30587 31337 29323 29087 28337 STEELRPR 20-Feb-13 31180.00 UP 31177 31403 31627 32077 30953 30727 30277 STEELRPR 18-Jan-13 30760.00 DOWN 30790 30950 31140 31490 30600 30440 30090 ZINC 28-Mar-13 113.40 DOWN 114 114 115 115 113 113 112 ZINC 28-Feb-13 113.10 DOWN 113 114 114 115 113 112 111 ZINC 31-Jan-13 112.70 UP 113 113 114 115 112 112 110 ZINC 31-Dec-12 111.90 UP 112 112 113 114 111 111 109 ZINCMINI 28-Mar-13 113.70 UP 114 114 114 115 113 113 112 ZINCMINI 28-Feb-13 113.15 DOWN 113 114 114 115 113 112 111 ZINCMINI 31-Jan-13 112.70 UP 113 113 114 115 112 112 111 ZINCMINI 31-Dec-12 111.90 UP 112 112 113 114 111 111 109 Sanjay Bhatia (AVP – Technical Research), Email Id sanjay@keynotecapitals.net Pivot Point: Intra- Day Trading Tool. - The key to the use of this tool is the use of Stop Loss Intra Day Trend: It is valid only till the point where Price trades above Pivot Point. For Eg. “UP” would be valid till Price remains above Pivot Point. It would become “DOWN” in event Price trades below Pivot Point. Pivot Point (PP): This is a trigger point for Intra Day Buy / Sell based on the price range of the previous day. R1: Resistance 1: 1st Resistance level over Pivot Point, R2: Resistance 2: Next Resistance level after R1. R3: Resistance 3: Next Resistance level after R2. S1: Support 1: 1st Support level after Pivot Point, S2: Support 2: Next Support level after S1. S3: Support 3: Next Support level after S2. Note: As per this tool, the trader should take BUY position just above the Pivot Point and keep the Pivot Point level as stop loss and the first target would be R1 level (Resistance 1). If R1 is crossed then R2 (Resistance 2) becomes the next target with the stop loss placed at R1 level. If R2 is crossed then R3 (Resistance 3) becomes the next target with the stop loss placed at R2 level. Similarly if price goes below the Pivot Point the trader should take a SELL position and keep the Pivot Point level as the stop loss and the first target would be S1 level (Support 1). If S1 level is breached then S2 level (Support 2) becomes the next target with the stop loss placed at S1 level. If S2 level is breached then S3 level (Support 3) becomes the next target with the stop loss placed at S2 level. Disclaimer: This document is not for public distribution and has been furnished to you solely for your information and must not be reproduced or redistributed to any other person. Persons into whose possession this document may come are required to observe these restrictions. This material is for the personal information of the authorized recipient, and we are not soliciting any action based upon it. This report is not to be construed as an offer to sell or the solicitation of an offer to buy any security in any jurisdiction where such an offer or solicitation would be illegal. It is for the general information of clients of Keynote Capitals Ltd. It does not constitute a personal recommendation or take into account the particular investment objectives, financial situations, or needs of individual clients. We have reviewed the report, and in so far as it includes current or historical information, it is believed to be reliable though its accuracy or completeness cannot be guaranteed. Neither Keynote Capitals Ltd., nor any person connected with it, accepts any liability arising from the use of this document. The recipients of this material should rely on their own investigations and take their own professional advice. Price and value of the investments referred to in this material may go up or down. Past performance is not a guide for future performance. Certain transactions -including those involving futures, options and other derivatives as well as non-investment grade securities - involve substantial risk and are not suitable for all investors. Reports based on technical analysis centers on studying charts of a stock’s price movement and trading volume, as opposed to focusing on a company’s fundamentals and as such, may not match with a report on a company’s fundamentals. Opinions expressed are our current opinions as of the date appearing on this material only. While we endeavor to update on a reasonable basis the information discussed in this material, there may be regulatory, compliance, or other reasons that prevent us from doing so. Prospective investors and others are cautioned that any forward-looking statements are not predictions and may be subject to change without notice. Our proprietary trading and investment businesses may make investment decisions that are inconsistent with the recommendations expressed herein. We and our affiliates, officers, directors, and employees world wide may: (a) from time to time, have long or short positions in, and buy or sell the securities thereof, of company (ies) mentioned herein or (b) be engaged in any other transaction involving such securities and earn brokerage or other compensation or act as a market maker in the financial instruments of the company (ies) discussed herein or act as advisor or lender / borrower to such company (ies) or have other potential conflict of interest with respect to any recommendation and related information and opinions. The analyst for this report certifies that all of the views expressed in this report accurately reflect his or her personal views about the subject company or companies and its or their securities, and no part of his or her compensation was, is or will be, directly or indirectly related to specific recommendations or views expressed in this report. No part of this material may be duplicated in any form and/or redistributed without Keynote Capitals Ltd’s., prior written consent. Keynote Capitals Ltd. The Ruby, 9th Floor, Senapati Bapat Marg, Dadar (W), Mumbai, India – 400028 Tel: 30266000 / 22694322 www.keynotecapitals.com