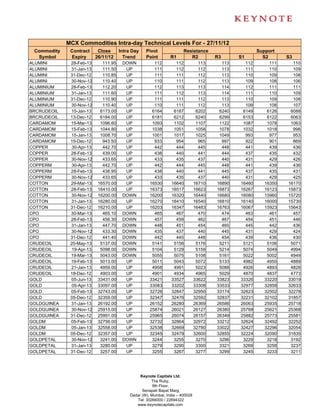
2. MCX Commodities Intra-day Technical Levels For - 27/11/12
Commodity Contract Close Intra Day Pivot Resistance Support
Symbol Expiry 26/11/12 Trend Point R1 R2 R3 S1 S2 S3
GOLDPTLDEL 31-Jan-13 3288.00 UP 3276 3305 3322 3368 3259 3230 3184
GOLDPTLDEL 31-Dec-12 3245.00 DOWN 3248 3277 3308 3368 3217 3188 3128
GOLDPTLDEL 30-Nov-12 3315.00 UP 3290 3344 3374 3458 3260 3206 3122
KAPAS 30-Mar-13 953.20 DOWN 954 958 962 970 949 946 937
KAPAS 30-Apr-13 965.50 UP 965 971 977 989 959 953 941
KAPASKHALI 30-Apr-13 1489.00 DOWN 1490 1509 1529 1568 1470 1451 1412
KAPASKHALI 30-Mar-13 1452.50 DOWN 1463 1475 1497 1531 1441 1429 1395
KAPASKHALI 28-Feb-13 1430.00 DOWN 1437 1446 1461 1485 1422 1413 1389
KAPASKHALI 31-Jan-13 1410.00 DOWN 1418 1427 1445 1472 1400 1391 1364
KAPASKHALI 31-Dec-12 1392.00 DOWN 1402 1413 1434 1467 1381 1369 1337
LEAD 28-Feb-13 121.45 DOWN 122 122 123 125 121 120 119
LEAD 31-Jan-13 121.40 DOWN 122 122 124 125 121 120 118
LEAD 31-Dec-12 121.45 DOWN 122 123 124 125 121 120 118
LEAD 30-Nov-12 121.50 DOWN 122 123 124 126 121 120 118
LEADMINI 28-Feb-13 121.25 DOWN 122 122 123 125 121 120 118
LEADMINI 31-Jan-13 121.35 DOWN 122 122 124 125 121 120 118
LEADMINI 31-Dec-12 121.40 DOWN 122 123 124 126 121 120 118
LEADMINI 30-Nov-12 121.50 DOWN 122 123 124 126 121 120 118
MENTHAOIL 28-Feb-13 1358.10 DOWN 1362 1370 1383 1404 1349 1341 1320
MENTHAOIL 31-Jan-13 1358.30 DOWN 1363 1372 1386 1409 1349 1339 1316
MENTHAOIL 30-Nov-12 1333.90 DOWN 1336 1348 1362 1388 1322 1310 1283
MENTHAOIL 31-Dec-12 1348.30 DOWN 1351 1362 1376 1402 1337 1325 1299
NATURALGAS 28-Jan-13 218.80 DOWN 221 224 228 236 216 213 205
NATURALGAS 26-Dec-12 217.00 DOWN 219 222 227 235 214 211 203
NATURALGAS 27-Nov-12 207.60 DOWN 210 213 218 227 205 202 194
NICKEL 28-Feb-13 945.70 DOWN 946 952 959 972 939 933 920
NICKEL 31-Jan-13 935.80 DOWN 937 944 953 968 929 922 906
NICKEL 31-Dec-12 927.70 DOWN 929 937 946 962 920 913 896
NICKEL 30-Nov-12 918.90 DOWN 921 929 939 957 911 903 884
NICKELM 28-Feb-13 943.80 DOWN 945 950 957 968 939 934 923
NICKELM 31-Jan-13 935.10 DOWN 937 944 953 969 928 921 906
NICKELM 31-Dec-12 927.80 DOWN 930 937 946 962 921 913 897
NICKELM 30-Nov-12 918.80 DOWN 921 929 939 957 911 903 884
POTATO 15-May-13 721.90 UP 721 724 726 732 719 716 711
POTATO 15-Mar-13 733.30 UP 732 736 739 746 729 725 717
POTATO 15-Apr-13 706.70 UP 707 709 711 716 704 702 697
SILVER 04-May-13 67219.00 UP 67182 67626 68032 68882 66776 66332 65482
SILVER 05-Mar-13 65753.00 UP 65671 66197 66640 67609 65228 64702 63733
SILVER 05-Dec-12 63734.00 UP 63700 64176 64617 65534 63259 62783 61866
SILVER1000 31-Jan-13 64815.00 UP 64712 65324 65833 66954 64203 63591 62470
SILVER1000 31-Dec-12 63990.00 UP 63951 64349 64709 65467 63591 63193 62435
SILVER1000 30-Nov-12 63409.00 DOWN 63493 63786 64163 64833 63116 62823 62153
SILVERM 30-Apr-13 67242.00 UP 67208 67670 68099 68990 66779 66317 65426
SILVERM 28-Feb-13 65764.00 UP 65722 66191 66617 67512 65296 64827 63932
SILVERM 30-Nov-12 63726.00 UP 63696 64169 64613 65530 63252 62779 61862
SILVERMIC 30-Apr-13 67248.00 UP 67213 67676 68104 68995 66785 66322 65431
Keynote Capitals Ltd.
The Ruby,
9th Floor,
Senapati Bapat Marg,
Dadar (W), Mumbai, India – 400028
Tel: 30266000 / 22694322
www.keynotecapitals.com
3. MCX Commodities Intra-day Technical Levels For - 27/11/12
Commodity Contract Close Intra Day Pivot Resistance Support
Symbol Expiry 26/11/12 Trend Point R1 R2 R3 S1 S2 S3
SILVERMIC 28-Feb-13 65757.00 UP 65713 66174 66592 67471 65295 64834 63955
SILVERMIC 30-Nov-12 63723.00 UP 63691 64172 64621 65551 63242 62761 61831
STEELRPR 18-Jan-13 30490.00 UP 30380 30660 30830 31280 30210 29930 29480
STEELRPR 20-Dec-12 30180.00 UP 30087 30343 30507 30927 29923 29667 29247
ZINC 28-Feb-13 111.35 UP 111 112 112 113 111 110 110
ZINC 31-Jan-13 110.85 UP 111 111 112 113 110 109 108
ZINC 31-Dec-12 110.05 UP 110 111 112 114 109 108 106
ZINC 30-Nov-12 109.35 UP 109 110 111 114 108 107 104
ZINCMINI 28-Feb-13 111.40 UP 111 112 112 114 111 110 109
ZINCMINI 31-Jan-13 110.75 UP 111 112 112 114 110 109 107
ZINCMINI 31-Dec-12 110.05 UP 110 111 112 114 109 108 106
ZINCMINI 30-Nov-12 109.30 UP 109 110 111 114 108 107 104
Sanjay Bhatia (AVP – Technical Research),
Email Id sanjay@keynotecapitals.net
Pivot Point: Intra- Day Trading Tool. - The key to the use of this tool is the use of Stop Loss
Intra Day Trend: It is valid only till the point where Price trades above Pivot Point. For Eg. “UP” would be valid till Price
remains above Pivot Point. It would become “DOWN” in event Price trades below Pivot Point.
Pivot Point (PP): This is a trigger point for Intra Day Buy / Sell based on the price range of the previous day.
R1: Resistance 1: 1st Resistance level over Pivot Point, R2: Resistance 2: Next Resistance level after R1.
R3: Resistance 3: Next Resistance level after R2.
S1: Support 1: 1st Support level after Pivot Point, S2: Support 2: Next Support level after S1.
S3: Support 3: Next Support level after S2.
Note: As per this tool, the trader should take BUY position just above the Pivot Point and keep the Pivot Point level as stop
loss and the first target would be R1 level (Resistance 1). If R1 is crossed then R2 (Resistance 2) becomes the next target
with the stop loss placed at R1 level. If R2 is crossed then R3 (Resistance 3) becomes the next target with the stop loss
placed at R2 level.
Similarly if price goes below the Pivot Point the trader should take a SELL position and keep the Pivot Point level as the
stop loss and the first target would be S1 level (Support 1). If S1 level is breached then S2 level (Support 2) becomes the
next target with the stop loss placed at S1 level. If S2 level is breached then S3 level (Support 3) becomes the next target
with the stop loss placed at S2 level.
Disclaimer: This document is not for public distribution and has been furnished to you solely for your information and must not be reproduced or
redistributed to any other person. Persons into whose possession this document may come are required to observe these restrictions. This material is
for the personal information of the authorized recipient, and we are not soliciting any action based upon it. This report is not to be construed as an offer
to sell or the solicitation of an offer to buy any security in any jurisdiction where such an offer or solicitation would be illegal. It is for the general
information of clients of Keynote Capitals Ltd. It does not constitute a personal recommendation or take into account the particular investment
objectives, financial situations, or needs of individual clients. We have reviewed the report, and in so far as it includes current or historical information, it
is believed to be reliable though its accuracy or completeness cannot be guaranteed. Neither Keynote Capitals Ltd., nor any person connected with it,
accepts any liability arising from the use of this document. The recipients of this material should rely on their own investigations and take their own
professional advice. Price and value of the investments referred to in this material may go up or down. Past performance is not a guide for future
performance. Certain transactions -including those involving futures, options and other derivatives as well as non-investment grade securities - involve
substantial risk and are not suitable for all investors. Reports based on technical analysis centers on studying charts of a stock’s price movement and
trading volume, as opposed to focusing on a company’s fundamentals and as such, may not match with a report on a company’s fundamentals.
Opinions expressed are our current opinions as of the date appearing on this material only. While we endeavor to update on a reasonable basis the
information discussed in this material, there may be regulatory, compliance, or other reasons that prevent us from doing so. Prospective investors and
others are cautioned that any forward-looking statements are not predictions and may be subject to change without notice. Our proprietary trading and
investment businesses may make investment decisions that are inconsistent with the recommendations expressed herein. We and our affiliates,
officers, directors, and employees world wide may: (a) from time to time, have long or short positions in, and buy or sell the securities thereof, of
company (ies) mentioned herein or (b) be engaged in any other transaction involving such securities and earn brokerage or other compensation or act
as a market maker in the financial instruments of the company (ies) discussed herein or act as advisor or lender / borrower to such company (ies) or
have other potential conflict of interest with respect to any recommendation and related information and opinions. The analyst for this report certifies that
all of the views expressed in this report accurately reflect his or her personal views about the subject company or companies and its or their securities,
and no part of his or her compensation was, is or will be, directly or indirectly related to specific recommendations or views expressed in this report. No
part of this material may be duplicated in any form and/or redistributed without Keynote Capitals Ltd’s., prior written consent.
Keynote Capitals Ltd.
The Ruby,
9th Floor,
Senapati Bapat Marg,
Dadar (W), Mumbai, India – 400028
Tel: 30266000 / 22694322
www.keynotecapitals.com