Daily Technical Outlook
•
0 j'aime•76 vues

- The Indian markets opened higher and gained over 2% mirroring positive global cues, but then lost gains due to weak European markets and sustained selling pressure. - The markets ended the day with handsome gains despite range-bound, listless trading. Key gainers were stocks like Sterlite, Jindal Steel, and Axis Bank. - Technically, market breadth was robust with higher volumes, seen as positive. Global cues were mixed and the domestic markets were expected to have a flat opening.

Recommandé
Recommandé
Contenu connexe
Tendances
Tendances (20)
En vedette
En vedette (7)
Similaire à Daily Technical Outlook
Similaire à Daily Technical Outlook (18)
Plus de Keynote Capitals Ltd.
Plus de Keynote Capitals Ltd. (20)
Dernier
Dernier (20)
Daily Technical Outlook
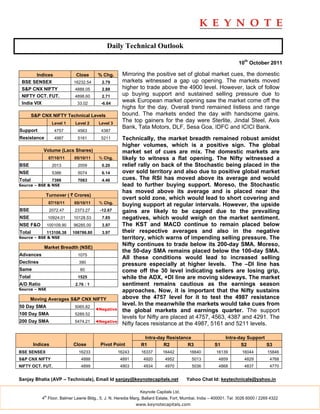
- 1. Daily Technical Outlook 10th October 2011 Indices Close % Chg. Mirroring the positive set of global market cues, the domestic BSE SENSEX 16232.54 2.79 markets witnessed a gap up opening. The markets moved S&P CNX NIFTY 4888.05 2.88 higher to trade above the 4900 level. However, lack of follow NIFTY OCT. FUT. 4898.60 2.71 up buying support and sustained selling pressure due to India VIX 33.02 -6.64 weak European market opening saw the market come off the highs for the day. Overall trend remained listless and range S&P CNX NIFTY Technical Levels bound. The markets ended the day with handsome gains. Level 1 Level 2 Level 3 The top gainers for the day were Sterlite, Jindal Steel, Axis Bank, Tata Motors, DLF, Sesa Goa, IDFC and ICICI Bank. Support 4757 4563 4387 Resistance 4987 5161 5211 Technically, the market breadth remained robust amidst higher volumes, which is a positive sign. The global Volume (Lacs Shares) market set of cues are mix. The domestic markets are 07/10/11 05/10/11 % Chg. likely to witness a flat opening. The Nifty witnessed a BSE 2013 2009 0.20 relief rally on back of the Stochastic being placed in the NSE 5386 5074 6.14 over sold territory and also due to positive global market Total 7399 7083 4.46 cues. The RSI has moved above its average and would Source – BSE & NSE lead to further buying support. Moreso, the Stochastic has moved above its average and is placed near the Turnover ( ` Crores) overt sold zone, which would lead to short covering and 07/10/11 05/10/11 % Chg. buying support at regular intervals. However, the upside BSE 2072.47 2373.27 -12.67 gains are likely to be capped due to the prevailing NSE 10924.01 10128.53 7.85 negatives, which would weigh on the market sentiment. NSE F&O 100109.90 96285.00 3.97 The KST and MACD continue to remain placed below Total 113106.38 108786.80 3.97 their respective averages and also in the negative Source – BSE & NSE territory, which warns of impending selling pressure. The Market Breadth (NSE) Nifty continues to trade below its 200-day SMA. Moreso, the 50-day SMA remains placed below the 100-day SMA. Advances 1075 All these conditions would lead to increased selling Declines 390 pressure especially at higher levels. The –DI line has Same 60 come off the 30 level indicating sellers are losing grip, Total 1525 while the ADX, +DI line are moving sideways. The market A/D Ratio 2.76 : 1 sentiment remains cautious as the earnings season Source – NSE approaches. Now, it is important that the Nifty sustains Moving Averages S&P CNX NIFTY above the 4757 level for it to test the 4987 resistance 50 Day SMA 5065.82 level. In the meanwhile the markets would take cues from ◄Negative the global markets and earnings quarter. The support 100 Day SMA 5289.52 levels for Nifty are placed at 4757, 4563, 4387 and 4291. The 200 Day SMA 5474.21 ◄Negative Nifty faces resistance at the 4987, 5161 and 5211 levels. Intra-day Resistance Intra-day Support Indices Close Pivot Point R1 R2 R3 S1 S2 S3 BSE SENSEX 16233 16243 16337 16442 16640 16139 16044 15846 S&P CNX NIFTY 4888 4891 4920 4952 5013 4859 4829 4768 NIFTY OCT. FUT. 4899 4903 4934 4970 5036 4868 4837 4770 Sanjay Bhatia (AVP – Technicals), Email Id sanjay@keynotecapitals.net Yahoo Chat Id: keytechnicals@yahoo.in Keynote Capitals Ltd. th 4 Floor, Balmer Lawrie Bldg., 5, J. N. Heredia Marg, Ballard Estate, Fort, Mumbai, India – 400001. Tel: 3026 6000 / 2269 4322 www.keynotecapitals.com
- 2. Short Term Trading Ideas Based On Technical Analysis (5 - 7 Days) Stop Initiation Stop Loss Target Stock Close Action Price Loss * (%) Target (%) Remarks Bharti Airtel 354.80 Sell Below 348 361.00 3.74 319 8.33 ITC 199.15 Buy Above 201 198.75 1.12 206 2.49 McDowell 832.40 Buy Above 839 823.00 1.91 875 4.29 * Stop Losses are to be considered on Closing basis only. Keynote Capitals Ltd. th 4 Floor, Balmer Lawrie Bldg., 5, J. N. Heredia Marg, Ballard Estate, Fort, Mumbai, India – 400001. Tel: 3026 6000 / 2269 4322 www.keynotecapitals.com
- 3. Disclaimer This document is not for public distribution and has been furnished to you solely for your information and must not be reproduced or redistributed to any other person. Persons into whose possession this document may come are required to observe these restrictions. This material is for the personal information of the authorized recipient, and we are not soliciting any action based upon it. This report is not to be construed as an offer to sell or the solicitation of an offer to buy any security in any jurisdiction where such an offer or solicitation would be illegal. It is for the general information of clients of Keynote Capitals Ltd. It does not constitute a personal recommendation or take into account the particular investment objectives, financial situations, or needs of individual clients. We have reviewed the report, and in so far as it includes current or historical information, it is believed to be reliable though its accuracy or completeness cannot be guaranteed. Neither Keynote Capitals Ltd., nor any person connected with it, accepts any liability arising from the use of this document. The recipients of this material should rely on their own investigations and take their own professional advice. Price and value of the investments referred to in this material may go up or down. Past performance is not a guide for future performance. Certain transactions -including those involving futures, options and other derivatives as well as non-investment grade securities - involve substantial risk and are not suitable for all investors. Reports based on technical analysis centers on studying charts of a stock’s price movement and trading volume, as opposed to focusing on a company’s fundamentals and as such, may not match with a report on a company’s fundamentals. Opinions expressed are our current opinions as of the date appearing on this material only. While we endeavor to update on a reasonable basis the information discussed in this material, there may be regulatory, compliance, or other reasons that prevent us from doing so. Prospective investors and others are cautioned that any forward-looking statements are not predictions and may be subject to change without notice. Our proprietary trading and investment businesses may make investment decisions that are inconsistent with the recommendations expressed herein. We and our affiliates, officers, directors, and employees world wide may: (a) from time to time, have long or short positions in, and buy or sell the securities thereof, of company (ies) mentioned herein or (b) be engaged in any other transaction involving such securities and earn brokerage or other compensation or act as a market maker in the financial instruments of the company (ies) discussed herein or act as advisor or lender / borrower to such company (ies) or have other potential conflict of interest with respect to any recommendation and related information and opinions. The analyst for this report certifies that all of the views expressed in this report accurately reflect his or her personal views about the subject company or companies and its or their securities, and no part of his or her compensation was, is or will be, directly or indirectly related to specific recommendations or views expressed in this report. No part of this material may be duplicated in any form and/or redistributed without Keynote Capitals Ltd’s., prior written consent. Keynote Capitals Ltd. th 4 Floor, Balmer Lawrie Bldg., 5, J. N. Heredia Marg, Ballard Estate, Fort, Mumbai, India – 400001. Tel: 3026 6000 / 2269 4322 www.keynotecapitals.com