Keynote technicals daily report for 010213
•
0 j'aime•116 vues

The domestic stock markets ended the day with losses amid range-bound trading and lack of buying support. Key indices like the BSE Sensex and NSE Nifty closed over half a percent lower. Technically, most indicators are below their averages, signaling further downside pressure. The markets will take cues from ongoing earnings and global cues in the near term. Support levels are at 5966, 5885 and 5816 for the Nifty, while resistance is at 6158, 6313 and 6358.

Recommandé
Recommandé
Contenu connexe
Tendances
Tendances (20)
En vedette
En vedette (20)
Similaire à Keynote technicals daily report for 010213
Similaire à Keynote technicals daily report for 010213 (18)
Plus de Keynote Capitals Ltd.
Plus de Keynote Capitals Ltd. (20)
Dernier
Dernier (20)
Keynote technicals daily report for 010213
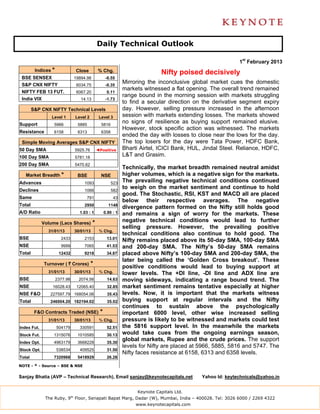
- 1. Daily Technical Outlook 1st February 2013 Indices * Close % Chg. Nifty poised decisively BSE SENSEX 19894.98 -0.55 S&P CNX NIFTY 6034.75 -0.35 Mirroring the inconclusive global market cues the domestic markets witnessed a flat opening. The overall trend remained NIFTY FEB 13 FUT. 6067.20 0.11 range bound in the morning session with markets struggling India VIX 14.13 -1.73 to find a secular direction on the derivative segment expiry S&P CNX NIFTY Technical Levels day. However, selling pressure increased in the afternoon Level 1 Level 2 Level 3 session with markets extending losses. The markets showed Support 5966 5885 5816 no signs of resilience as buying support remained elusive. However, stock specific action was witnessed. The markets Resistance 6158 6313 6358 ended the day with losses to close near the lows for the day. Simple Moving Averages S&P CNX NIFTY The top losers for the day were Tata Power, HDFC Bank, 50 Day SMA 5925.76 ◄Positive Bharti Airtel, ICICI Bank, HUL, Jindal Steel. Reliance, HDFC, 100 Day SMA 5781.18 L&T and Grasim. 200 Day SMA 5470.62 Technically, the market breadth remained neutral amidst Market Breadth * BSE NSE higher volumes, which is a negative sign for the markets. Advances 1093 523 The prevailing negative technical conditions continued Declines 1066 582 to weigh on the market sentiment and continue to hold good. The Stochastic, RSI, KST and MACD all are placed Same 791 43 below their respective averages. The negative Total 2950 1148 divergence pattern formed on the Nifty still holds good A/D Ratio 1.03 : 1 0.90 : 1 and remains a sign of worry for the markets. These Volume (Lacs Shares) * negative technical conditions would lead to further selling pressure. However, the prevailing positive 31/01/13 30/01/13 % Chg. technical conditions also continue to hold good. The BSE 2433 2153 13.01 Nifty remains placed above its 50-day SMA, 100-day SMA NSE 9999 7065 41.53 and 200-day SMA. The Nifty’s 50-day SMA remains Total 12432 9218 34.87 placed above Nifty’s 100-day SMA and 200-day SMA, the later being called the ‘Golden Cross breakout’. These Turnover ( ` Crores) * positive conditions would lead to buying support at 31/01/13 30/01/13 % Chg. lower levels. The +DI line, -DI line and ADX line are BSE 2377.98 2074.56 14.63 moving sideways, indicating a range bound trend. The NSE 16028.43 12065.40 32.85 market sentiment remains tentative especially at higher NSE F&O 227597.79 168054.06 35.43 levels. Now, it is important that the markets witness Total 246004.20 182194.02 35.02 buying support at regular intervals and the Nifty continues to sustain above the psychologically F&O Contracts Traded (NSE) * important 6000 level, other wise increased selling 31/01/13 30/01/13 % Chg. pressure is likely to be witnessed and markets could test Index Fut. 504179 330591 52.51 the 5816 support level. In the meanwhile the markets Stock Fut. 1315076 1010585 30.13 would take cues from the ongoing earnings season, Index Opt. 4963179 3668228 35.30 global markets, Rupee and the crude prices. The support levels for Nifty are placed at 5966, 5885, 5816 and 5747. The Stock Opt. 538534 409525 31.50 Nifty faces resistance at 6158, 6313 and 6358 levels. Total 7320968 5418929 26.28 NOTE - * - Source – BSE & NSE Sanjay Bhatia (AVP – Technical Research), Email sanjay@keynotecapitals.net Yahoo Id: keytechnicals@yahoo.in Keynote Capitals Ltd. The Ruby, 9th Floor, Senapati Bapat Marg, Dadar (W), Mumbai, India – 400028. Tel: 3026 6000 / 2269 4322 www.keynotecapitals.com
- 2. Jaldi 5 (Short Term Technical Ideas for 5 Trading Days) Stop Initiation Stop Loss Target Stock Close Action Price Loss * (%) Target (%) Remarks AB Nuvo Fut 1135.65 Sell Below 1134 1149.50 1.37 1100 3.00 CESC Fut 314.00 Sell Below 313 319.00 2.08 300 4.00 Coal India 353.35 Buy Above 355 346.00 2.54 375.00 5.63 * Stop Losses are to be considered strictly on closing basis. Intra-day Resistance Intra-day Support Indices Close Pivot Point R1 R2 R3 S1 S2 S3 BSE SENSEX 19895 19923 19981 20066 20209 19838 19780 19637 S&P CNX NIFTY 6035 6039 6053 6072 6105 6021 6006 5974 NIFTY FEB 13 FUT. 6067 6063 6065 6063 6063 6065 6063 6063 Stocks To Watch Out Today Ambuja Cement, Apollo Tyre, Asian Paints, Coal India, DLF, Essar Oil, Hero Motocorp; IRB, ITC, JSW Steel, Kotak Bank, L&T McLeod Russel, NHPC, PFC, PNB, Punj Lloyd, Siemens, Shriram Transport, Suzlon, Tata Global, Titan, Ultratech Cemco, Welcorp; ZEEL Aban, ABB, AB Nuvo, Allahabad Bank, Andhra Bank, CESC, Colgate, DCB, Delta Corp, FBI, FT, HDFC, HDFC Bank, Hexaware, HPCL, Infosys Tech; Infosys Tech; Jindal Steel, LIC hsg; NCC, NMDC, Powergrid, PTC, Ranbaxy, SAIL, Tata Chem; Tata Power, Uniphos Keynote Capitals Ltd. The Ruby, 9th Floor, Senapati Bapat Marg, Dadar (W), Mumbai, India – 400028. Tel: 3026 6000 / 2269 4322 www.keynotecapitals.com
- 3. NOTE: TECHNICAL ANALYSIS ABBREVATIONS SMA – Simple Moving Average EMA – Exponential Moving Average WMA – Weighted Moving Average Disclaimer This document is not for public distribution and has been furnished to you solely for your information and must not be reproduced or redistributed to any other person. Persons into whose possession this document may come are required to observe these restrictions. This material is for the personal information of the authorized recipient, and we are not soliciting any action based upon it. This report is not to be construed as an offer to sell or the solicitation of an offer to buy any security in any jurisdiction where such an offer or solicitation would be illegal. It is for the general information of clients of Keynote Capitals Ltd. It does not constitute a personal recommendation or take into account the particular investment objectives, financial situations, or needs of individual clients. We have reviewed the report, and in so far as it includes current or historical information, it is believed to be reliable though its accuracy or completeness cannot be guaranteed. Neither Keynote Capitals Ltd., nor any person connected with it, accepts any liability arising from the use of this document. The recipients of this material should rely on their own investigations and take their own professional advice. Price and value of the investments referred to in this material may go up or down. Past performance is not a guide for future performance. Certain transactions -including those involving futures, options and other derivatives as well as non-investment grade securities - involve substantial risk and are not suitable for all investors. Reports based on technical analysis centers on studying charts of a stock’s price movement and trading volume, as opposed to focusing on a company’s fundamentals and as such, may not match with a report on a company’s fundamentals. Opinions expressed are our current opinions as of the date appearing on this material only. While we endeavor to update on a reasonable basis the information discussed in this material, there may be regulatory, compliance, or other reasons that prevent us from doing so. Prospective investors and others are cautioned that any forward-looking statements are not predictions and may be subject to change without notice. Our proprietary trading and investment businesses may make investment decisions that are inconsistent with the recommendations expressed herein. We and our affiliates, officers, directors, and employees world wide may: (a) from time to time, have long or short positions in, and buy or sell the securities thereof, of company (ies) mentioned herein or (b) be engaged in any other transaction involving such securities and earn brokerage or other compensation or act as a market maker in the financial instruments of the company (ies) discussed herein or act as advisor or lender / borrower to such company (ies) or have other potential conflict of interest with respect to any recommendation and related information and opinions. The analyst for this report certifies that all of the views expressed in this report accurately reflect his or her personal views about the subject company or companies and its or their securities, and no part of his or her compensation was, is or will be, directly or indirectly related to specific recommendations or views expressed in this report. No part of this material may be duplicated in any form and/or redistributed without Keynote Capitals Ltd’s., prior written consent. Keynote Capitals Ltd. The Ruby, 9th Floor, Senapati Bapat Marg, Dadar (W), Mumbai, India – 400028. Tel: 3026 6000 / 2269 4322 www.keynotecapitals.com