Fund Components - the building blocks of your fund fact sheets
•Télécharger en tant que PPTX, PDF•
1 j'aime•1,633 vues

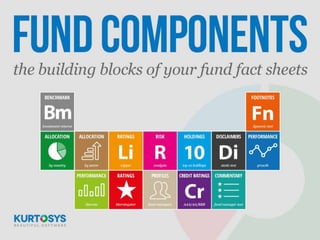
There’s a science to creating the perfect fund fact sheet. Elements like charts, tables, ratings, and text work together to produce a well designed and informative fact sheet. View a gallery of fund components that Kurtosys has standardized with our fact sheet automation platform. Download the PDF and view the Gallery at http://www2.kurtosys.com/fund-component-gallery

Recommandé
Contenu connexe
Similaire à Fund Components - the building blocks of your fund fact sheets
Similaire à Fund Components - the building blocks of your fund fact sheets (20)
Plus de Kurtosys Systems
Plus de Kurtosys Systems (20)
Dernier
Dernier (20)
Fund Components - the building blocks of your fund fact sheets
- 2. There’s a science to creating the perfect fund fact sheet. Elements like charts, tables, ratings, and text work together to produce a well designed and informative fact sheet. Here’s a selection of fund components that Kurtosys has standardized with our fact sheet automation platform.
- 3. Allocation
- 4. TOP 10 HOLDINGS PERFORMANCE ALLOCATION A tabular representation of a product’s top ten underlying securities positions which can be any type of asset including stocks, bonds, funds, ETF’s and properties.
- 5. COUNTRY BREAKDOWN PERFORMANCE ALLOCATION This representation is typically applied to a product that has a broad geographic spread in terms of investments. It’s usually presented as a pie/doughnut for maximum visual interpretation and most often with the top holdings only. For all holdings, it is often neater to consolidate the lowest concentration of positions into a single “others” category.
- 6. CREDIT RATING PERAFLOLORCMAATNIOCNE Constituent breakdown by credit exposure and shown in a simple tabular format. Note, the inclusion of all Cash/Forward positions in this format to ensure 100% constituent coverage for a particular product or fund.
- 7. MORNINGSTAR STYLE BOX PERAFLOLORCMAATNIOCNE This is a proprietary Morningstar data point. The Morningstar Style Box is a nine-square grid that provides a graphical representation of the “investment style” of stocks and mutual funds. For stocks and stock funds, it classifies securities according to market capitalization (the vertical axis) and growth and value factors (the horizontal axis). Fixed income funds are classified according to credit quality (the vertical axis) and sensitivity to changes in interest rates (the horizontal axis).
- 8. RATINGS (WITH BENCHMARK) PERAFLOLORCMAATNIOCNE Constituent breakdown by credit exposure and include (optionally) the benchmarks credit exposure. Note: the inclusion of all Cash/Forward positions in this format to ensure 100% constituent coverage for a particular product or fund.
- 9. POSITIVE/NEGATIVE POSITIONS PERAFLOLORCMAATNIOCNE This chart is specifically constructed to accommodate two data series: Overweight and underweight underlying positions relative to a benchmark or sector. These are calculated by comparing the fund/product directly against the comparable position in the associated benchmark or sector. This chart can also be provided in a two column table format.
- 10. SECTOR BREAKDOWN (WITH AUM) PERAFLOLORCMAATNIOCNE An example of an annotated sector breakdown chart where the product’s assets under management is added onto the graph to provide further information.
- 11. DRIFT VS BENCHMARK PERAFLOLORCMAATNIOCNE A horizontal bar chart representation that shows the underweight/ overweight positions within a product against the prevailing constituents of the associated benchmark. This is shown against a asset classification which, in this example, is Country but could be applied by sector, currency and credit exposure.
- 12. REGIONAL (WITH BENCHMARK DEVIATION) PERAFLOLORCMAATNIOCNE A more sophistication representation which combines a regional breakdown (available through a country roll-up if necessary) and includes the sectors weighting alongside a graphical analysis of the product weighting against the sector.
- 13. SECTOR BREAKDOWN PERAFLOLORCMAATNIOCNE A tabular breakdown of a products holdings by market sector. This can be classified using standard markets available sectors such as GICS or customized taxonomies that are bespoke particulars funds or products.
- 14. SECTOR (WITH INDEX DEVIATION) PERAFLOLORCMAATNIOCNE A horizontal bar chart representation that shows the underweight/overweight positions within a product against the prevailing constituents of the associated sector. This is typically shown against the sectors classification.
- 15. SECTOR (WITH BENCHMARK) PERAFLOLORCMAATNIOCNE A horizontal double bar chart representation that shows the product, broken down by sector, and compared against the same breakdown of the associated benchmark.
- 16. Performance
- 17. DISCRETE PERFORMANCE This double bar chart shows discrete trailing performance (typically cumulative but can be annualized with appropriate footnote) plotted alongside the benchmark. This is displayed from one or more of 3 month, 6 month, 1 year, 2 year, 3 year, 5 year, 10 year and Since Inception.
- 18. TRAILING PERIOD PERFORMANCE This tabular format shows discrete trailing performance (typically cumulative but can be annualized with appropriate footnote) alongside the benchmark and or the associated sector. Typically this is shown from one or more of 3 month, 6 month, 1 year, 2 year, 3 year, 5 year, 10 year and Since Inception. Since Inception can also be shown as an annually compounded rate (ACR).
- 19. STANDARDIZED PERFORMANCE Standardized Performance numbers as proposed by the consultation paper CP-387 s available directly from Morningstar and Lipper. This can be shown as rolling 12 months returns and/or calendar quarter returns.
- 20. MONTHLY CUMULATIVE (WITH BENCHMARK) PERFORMANCE This is a two series chart (typically drawn in line format) plotting monthly cumulative returns since inception against the fund’s associated benchmark. Variants of this chart include plotting the sector returns as a third series or replacement for the benchmark. Data is sourced through Morningstar, Lipper or customer originated performance.
- 21. MONTHLY TRAILING PERFORMANCE This table shows discrete trailing monthly performance by calendar year, typically going back to inception. Note the use of customized footnotes here that explain the calculation basis for the performance calculation.
- 22. WITH PEER RANKINGS PERFORMANCE This tabular format combines Calendar Year discrete annual performance with the Ranking within each year against the associated sector. It also shows the number of products in the sector universe. This data is supplied directly from Morningstar or Lipper.
- 23. GROWTH PERFORMANCE This multi-series line chart provides an indexed comparison of a product(s) performance against a sector or a benchmark. For ease of interpretation, these charts can be reindexed to an initial investment amount (in this case $10,000) so monetary comparisons can be made. These charts are typically shown in the currency of the share class being plotted.
- 24. Ratings
- 25. MORNINGSTAR PERFORMANCE RATINGS [left] Morningstar OBSR ratings can be incorporated on a dynamic basis using rules depending on display preferences. [right] When related to Passive Funds, Closed End Funds (Investment Trusts) or any fund page/report deployed outside of the UK, they are simply Morningstar Analyst Ratings.
- 26. THE MORNINGSTAR STAR RATING PERFORMANCE The Morningstar RatingTM for funds, often called the “star rating”, debuted in 1985 and was quickly embraced by investors and advisors. Using a scale of one to five stars, the original rating allowed investors to easily evaluate a fund’s past performance within six broad asset classes. RATINGS
- 27. CITYWIRE PERFORMANCE Citywire Ratings (AAA/AA/A/+) are available across a significant cross section of funds. Citywire is the only firm to exclusively rate fund managers, not funds. RATINGS
- 28. LIPPER SELECTION CRITERIA PERFORMANCE RATINGS Funds are ranked against their peers on each of four measures: Total Return, Consistent Return, Preservation and Expense. A fifth measure, Tax Efficiency, applies in the United States. Scores are subject to change every month and are calculated for the following periods: 3-year, 5-year, 10-year and overall. The overall calculation is based on an equal-weighted average of percentile ranks for each measure over 3-year, 5-year and 10-year periods (if applicable).
- 29. Risk
- 30. SRRI PERFORMANCE This component is the Synthetic Risk & Reward (SRRI) calculation. This calculation is based on the volatility of the fund. For market funds, the calculation uses annualized volatility of the total returns over the past 5 years. The NAV returns are based on weekly values, and where they are not available, the monthly NAVs are used. For strategic funds, there is a slightly different calculation. There are 7 SRRI Categories that correspond to the Volatility Range for the fund. RISK
- 31. RISK PROFILE PERFORMANCE A graphics based layout designed around our customers’ profiling method. These graphics are generally color coded and the various permutations of profiles are stored as image libraries in our customers’ tailored library. RISK
- 32. RISK ANALYSIS PERFORMANCE Typically used with alternate strategies, Risk Analysis is a customizable table based component for displaying risk metrics and statistics. This component typically requires extensive footnotes and accompanying explanation text. RISK
- 33. Static Data
- 34. FOOTNOTES AND DISCLAIMERS PERFORMANCE STATIC DATA This stylized text component represents data driven footnotes and disclaimers of the product. It can include bullet points, indentation and stylized fonts. These text components can change depending on jurisdiction, language, fund structure and domicile.
- 35. INVESTMENT OBJECTIVES PERFORMANCE STATIC DATA This stylized text component represents the “official” Investment Objective or investment goals of the product. It can include bullet points, indentation and stylized fonts.
- 36. FUND DETAILS PERFORMANCE This component allows for standing Product data to be incorporated into marketing documents. Can include many different properties from a comprehensive library of data items. STATIC DATA
- 37. FEES PERFORMANCE STATIC DATA Product Fee’s data including initial and trailing charges. It can also contain expense ratios such as TER’s.
- 38. FUND FACTS PERFORMANCE STATIC DATA A customizable table component for presenting product data. This example shows how share class specific data can be incorporated into a single component.
- 39. FUND MANAGER PROFILES PERFORMANCE STATIC DATA Print quality images and bio’s of individual Fund Managers or Investment Teams.
- 40. Download the PDF and view the Fund Component Gallery