Ammonia Emissions from Eight Types of Dairy Manure During Storage
•
0 j'aime•1,576 vues

Data will be presented on the effect of manure source (anaerobically digested (AD) and non-AD manure), fiber, and manure additive.
Recommandé

Recommandé
Contenu connexe
Plus de LPE Learning Center
Plus de LPE Learning Center (20)
Dernier
Dernier (20)
Ammonia Emissions from Eight Types of Dairy Manure During Storage
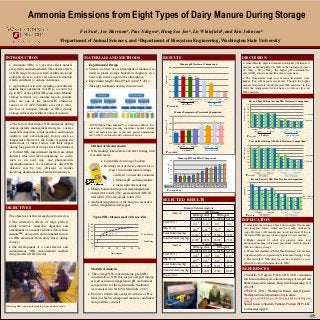
- 1. Ammonia Emissions from Eight Types of Dairy Manure During Storage Fei Sun1, Joe Harrison 1, Pius Ndegwa 2, HungSoo Joo 2, Liz Whitefield1, and Kris Johnson2 1Department of Animal Sciences, and 2Department of Biosystem Engineering, Washington State University INTRODUCTION MATERIALS AND METHODS RESULTS DISCUSSION Anaerobically digested manure had higher pH than raw Ammonia (NH3) is a gas that affects natural Experimental Design Manure pH Treatment Comparison 9.0 manure, as higher pH favors NH3 in the biological process ecosystems and human health. The adverse effects Twenty-six liters of each treatment of manure was of NH3 + H+ ↔ NH4+, the higher pH contributed to of NH3 range from ecosystem acidification and stored in plastic storage buckets in duplicate in a 8.5 greater NH3 emissions and flux than raw manure. a ab ab eutrophication, to odors and aerosol formation Manure pH barn, with surface open to the atmosphere. b The temperature from raw manure treatments were 8.0 which contributes to asthma in humans. Experiment length: June 15th to October 5th, 2012. c d higher than AD manure treatments. Though the higher Agricultural activities, including concentrated The eight treatments of dairy manure used: 7.5 manure temperature should promote NH3 emission, in this animal feed operations (CAFOs), account for study the temperature did not have an obvious effect on 7.0 e e NH3 emission. up to 80% of the global NH3 emissions. Manure storage facilities (e.g. manure lagoon, manure 6.5 No MTM MTM No MTM MTM No MTM MTM No MTM MTM piles) are one of the main NH3 emissions W/o Solids With solids W/o solids With solids Pre and Post Mixing Average NH3 Treatment Comparison 40 sources in a CAFO (Vaddella et al. 2011). Also, Pabcde<0.06 AD manure Non -AD manure 35 Average NH3 (ppm) the loss of nitrogen (mainly as NH3) during 30 storage reduces the fertilizer value of manure. Manure Temperature Treatment Comparison 25 Pre Mixing 17.0 20 a a a a 15 a a a a Post Mixing Manure Temp (℃) b b a 10 The factors that impact NH3 emissions during * MTM (More Than ManureTM) is a manure additive. It is 16.5 b b b 5 b b c b c b 0 storage include management strategies, such as a mixture of maleic-itaconic copolymer partial calcium 16.0 c c c No MTM MTM No MTM MTM No MTM MTM No MTM MTM With solids anaerobic digestion, solids partition and manure salt and maleic-itaconic copolymer partial ammonium d W/o Solids With solids W/o solids additive, and environmental factors such as salt, 30-60% with total solids solution in water. 15.5 Pabc <0.03 AD manure Non -AD manure temperature. However, the studies reporting the Pre and Post Mixing NH3 Peak Treatment Comparison interactions of these factors and their impact 15.0 No MTM MTM No MTM MTM No MTM MTM No MTM MTM 40 during long periods of storage have been limited. Method of Measurements W/o Solids With solids W/o solids With solids Peak NH3 (ppm) 35 Current NH3 measurement methods are either NH3 readings taken before and after stirring with Pabcd <0.004 AD manure Non -AD manure 30 a a a a a a a a 25 indirect, time and labor-consuming, or costly, GasAlert meter 20 b b Pre Mixing Manure pH Week Effect Comparison 15 b such as an acid trap, and photoacoustic Lid installed on storage buckets 9.0 b c c Post Mixing a 10 b b spectrophotometer. A cost-efficient, direct NH3 Readings recorded every minute for at Manure pH 8.5 b 5 c d detector can be very efficient in studies 8.0 d 0 involving determination of ammonia emission. least 10 min until same readings e g f 7.5 gh achieved 3 consecutive minutes i hi i Pabc <0.03 7.0 Manure pH and temperature Pre and Post stir NH3 Flux Treatment comparison 6.5 140 taken right after stirring 1st 2nd 3rd 5th Estimate 7.3 7.2 7.3 7.2 7th 7.4 8th 10th 11th 12th 13th 15th 17th 7.5 7.8 8.1 8.1 8.3 8.4 8.5 120 Manure from each storage cans were sampled and (µg/min/m2) Pabcdefghi <0.06 100 a a a a analyzed for total N (TN), ammonium N (NH4-N), 80 a ab b ab c total solids (TS) and volatile solids (VS) 60 Post Mixing Ambient temperature of the barn was recorded SELECTED RESULTS 40 b c b c b c b c Pre Mixing with a temperature data logger 20 OBJECTIVES Manure Nutrient Analysis 0 AD Manure Analysis Pabc <0.06 The objectives of this research are focused on Without solids With solids Typical NH3 Measurement with GasAlert No MTM MTM No MTM MTM IMPLICATION The interactive effects of large particle Total N (%) 0.12 b 0.12 b 0.13 a 0.14 a NH3 concentration (ppm) solids removal, anaerobic digestion and 60 Anaerobic digestion can break down organic N in manure 50 NH4-N (%) cd cd bc b into inorganic forms, which can be readily utilized by amendment of a manure additive (More than 486 482 537 567 40 crops. However, AD manure may result in greater N loss in manureTM), along with environmental factors Pre Mixing Total Solids (mg/kg) d d c c 30 17459 17950 22760 24085 the form of NH3 process when compared to raw manure. on NH3 emissions from dairy slurry during Volatile Solids (mg/kg) 20 1199712351 16174 c 17143 c b b Higher amount of solids can preserve more total storage. 10 Post Mixing nitrogen in manure, which can potentially result in greater Non AD Manure The development of a cost-effective and 0 Analysis NH3 loss during storage. 0 5 10 15 20 25 30 Without solids With solids instantaneous NH3 measurement method No MTM MTM No MTM MTM The manure amendment “More Than ManureTM” did not have Time (minutes) using GasAlert NH3 detector. Total N (%) d c b b a significant effect on preserving N in manure during storage. 0.09 0.10 0.12 0.12 NH4-N (%) de de a a The GasAlert® NH3 detector can be adopted as a cost- 403 416 649 653 effective tool for determination of NH3. Total Solids (mg/kg) e d b a 14371 17248 35154 36578 Statistical Analysis Volatile Solids (mg/kg) d c a c REFERENCES 8777 10997 27314 11997 The average NH3 concentrations, peak NH3 Pabcde <0.05 Vaddella, V., Ndegwa, P., & Joo, H.S. (2011). Ammonia concentrations, NH3 flux for pre and post mixing, loss from simulated post-collection storage of scraped and as well as manure temperature, pH and nutrient flushed dairy-cattle manure. Biosystem Engineering, 110, compositions for the right manure treatments 291-296. were analyzed in SAS (SAS Institute, 2012). WSDA. (2011). Washington Dairies And Digesters. Data was statistically analyzed with use of Proc Washington State Department of Agriculture. Mixed of SAS with repeated measures and linear http://agr.wa.gov/FP/Pubs/docs/343-WashingtonDairiesAndDigesters- and quadratic contrasts web.pdf Obtaining NH3 concentration readings from manure buckets Special thanks to Specialty Fertilizer Products (SFP), LLC for financial support Template provided by: “posters4research.com”