SlideShare une entreprise Scribd logo
1  sur  2
Télécharger pour lire hors ligne
Collective Site Cost Model
Assumptions:
25% Haul in Horse Waste                                  75% Container Occupancy
75% Contract Horse Waste                                 3$ Tipping Fee Haul In per Yard
15% Growth Market Share/ Market Growth                   $50 Monthly Rental Fee Container
33% Reduction through Composting                         $5 Finished Compost Sale Price per Yard
Income Contract based on 30 yard container,              Assumes no increase of fees or sale price
   $200 per pick up                                         compost over 10 years


Years                                               1               2                3                  4            5
Number of Horses Haul ins                        1,000         1,150            1,323                1,521       1,749
Volume Waste Haul ins                              74             85               98                 113          129
Volume after Reduction Composting                  44             51               59                  68           78
Yearly Volume                                   16,206        18,637           21,432           24,647          28,344


Number of Contract Horses                        3,000         3,450            3,968                4,563       5,247
Volume Waste Contract Horses                      222            255              294                 338          388
Volume after Reduction Composting                 133            153              176                 203          233
Yearly Volume                                   48,618        55,911           64,297           73,942          85,033


Total Number of Horses                           4,000         4,600            5,290                6,084       6,996
Total Yearly Volume In                            296            340              391                 450          518
Total Yearly Volume Out                           222            255              294                 338          388


Income
Income Container Rental                        $33,750       $42,750          $51,750          $60,750         $69,750
Income Haul ins                                $48,618       $55,911          $64,297          $73,942         $85,033
Income Contract Horses                        $540,200      $621,230         $714,415         $821,577        $944,813
Income Sale of Compost                        $324,120      $372,738         $428,649         $492,946        $566,888


Gross Income                                  $946,688    $1,092,629       $1,259,111       $1,449,215       $1,666,484


Capital Costs


Site Capital + Financing Cost                  $78,257       $78,257          $78,257          $78,257         $78,257
Support Equipment and Financing                    Phase One                                     Phase Two
Truck                                  $110,000       $10,598              $110,000                $110,000
Mixer                                   $75,000        $7,226
Trommel Screen                          $85,000        $8,189
Front End Loader                       $120,000       $11,561                         $120,000     $120,000
Containers                             $225,000       $21,677    $60,000    $60,000    $60,000      $60,000
ASP Pad & Aeration System              $450,000       $29,273                                      $450,000
Equipment Cost                        $1,065,000
Yearly Payment Principle, Interest+Cash
expenditure                                           $59,251   $119,251   $129,848   $141,409     $192,841


Operating Cost
Labor                                                $129,416   $142,358   $156,593   $172,253     $189,478
Insurance and overhead                                $69,500    $76,450    $84,095    $92,505     $101,755
Electrical and Utilities                              $71,743    $78,917    $86,809    $95,490     $105,039
Fuel                                                 $171,600   $188,760   $207,636   $228,400     $251,240
Maintenance                                           $23,750    $26,125    $28,738    $31,611      $34,772
Total Operating Cost                                 $466,009   $512,610   $563,871   $620,258     $682,284


Total Cost                                           $603,517   $710,117   $771,976   $839,924     $953,382


Net Income                                           $343,171   $382,511   $487,134   $609,290     $713,102

Contenu connexe

Tendances

Guanzon chap3 lab1
Guanzon chap3 lab1Guanzon chap3 lab1
Guanzon chap3 lab1
gianelle
 
7500 cards per year soc plan comparison excel workbook
7500 cards per year soc plan comparison excel workbook7500 cards per year soc plan comparison excel workbook
7500 cards per year soc plan comparison excel workbook
Clear Line
 
Www.stallions.com.au includes compare_a_stallion2
Www.stallions.com.au includes compare_a_stallion2Www.stallions.com.au includes compare_a_stallion2
Www.stallions.com.au includes compare_a_stallion2
aabretas
 
Flujo de caja
Flujo de cajaFlujo de caja
Flujo de caja
acalixtoh
 
【滋賀医科大学】2009年度環境報告書
【滋賀医科大学】2009年度環境報告書【滋賀医科大学】2009年度環境報告書
【滋賀医科大学】2009年度環境報告書
env50
 

Tendances (17)

Guanzon chap3 lab1
Guanzon chap3 lab1Guanzon chap3 lab1
Guanzon chap3 lab1
 
Consumi petrolio 2013_03
Consumi petrolio 2013_03Consumi petrolio 2013_03
Consumi petrolio 2013_03
 
fr05_is
fr05_isfr05_is
fr05_is
 
Kwik Trip - NGV Lifecycle & CPM Cost Analysis
Kwik Trip - NGV Lifecycle & CPM Cost AnalysisKwik Trip - NGV Lifecycle & CPM Cost Analysis
Kwik Trip - NGV Lifecycle & CPM Cost Analysis
 
Enterprize Awards Presentation
Enterprize Awards PresentationEnterprize Awards Presentation
Enterprize Awards Presentation
 
7500 cards per year soc plan comparison excel workbook
7500 cards per year soc plan comparison excel workbook7500 cards per year soc plan comparison excel workbook
7500 cards per year soc plan comparison excel workbook
 
Www.stallions.com.au includes compare_a_stallion2
Www.stallions.com.au includes compare_a_stallion2Www.stallions.com.au includes compare_a_stallion2
Www.stallions.com.au includes compare_a_stallion2
 
Consumi petrolio 2012_09
Consumi petrolio 2012_09Consumi petrolio 2012_09
Consumi petrolio 2012_09
 
NRF 2013 budget presentation
NRF 2013 budget presentationNRF 2013 budget presentation
NRF 2013 budget presentation
 
Fma5
Fma5Fma5
Fma5
 
2011 Budget
2011 Budget2011 Budget
2011 Budget
 
Flujo de caja
Flujo de cajaFlujo de caja
Flujo de caja
 
【滋賀医科大学】2009年度環境報告書
【滋賀医科大学】2009年度環境報告書【滋賀医科大学】2009年度環境報告書
【滋賀医科大学】2009年度環境報告書
 
Integrating Manure Into Feed Ration Optimization
Integrating Manure Into Feed Ration OptimizationIntegrating Manure Into Feed Ration Optimization
Integrating Manure Into Feed Ration Optimization
 
Michigan Kenworth - March Loyalty Rewards
Michigan Kenworth - March Loyalty RewardsMichigan Kenworth - March Loyalty Rewards
Michigan Kenworth - March Loyalty Rewards
 
Consumi petrolio 2012_03
Consumi petrolio 2012_03Consumi petrolio 2012_03
Consumi petrolio 2012_03
 
Costos de producción en el valle del fuerte
Costos de producción en el valle del fuerte Costos de producción en el valle del fuerte
Costos de producción en el valle del fuerte
 

Similaire à Bogardus spreadsheet example part 2

Westheimer mobil station
Westheimer mobil stationWestheimer mobil station
Westheimer mobil station
robertday
 
Westheimer mobil station
Westheimer mobil stationWestheimer mobil station
Westheimer mobil station
nateshow
 
alltel 3Q06_Proformaa
alltel  3Q06_Proformaaalltel  3Q06_Proformaa
alltel 3Q06_Proformaa
finance27
 
alltel 3Q06_Proformaa
alltel  3Q06_Proformaaalltel  3Q06_Proformaa
alltel 3Q06_Proformaa
finance27
 
alltel 2Q06_Proforma
alltel  2Q06_Proformaalltel  2Q06_Proforma
alltel 2Q06_Proforma
finance27
 
alltel 3Q06_InvestorSupplementa
alltel  3Q06_InvestorSupplementaalltel  3Q06_InvestorSupplementa
alltel 3Q06_InvestorSupplementa
finance27
 
alltel 4Q 06_Supplement
alltel  4Q 06_Supplementalltel  4Q 06_Supplement
alltel 4Q 06_Supplement
finance27
 
Erin Parker Atvidcf V1
Erin Parker Atvidcf V1Erin Parker Atvidcf V1
Erin Parker Atvidcf V1
Caneskid05
 
Grape Leaf Financials
Grape Leaf FinancialsGrape Leaf Financials
Grape Leaf Financials
sasha lugo
 
alltel 1Q06_Supplement
alltel  1Q06_Supplementalltel  1Q06_Supplement
alltel 1Q06_Supplement
finance27
 
atmos enerrgy segmentinfo040408
atmos enerrgy segmentinfo040408atmos enerrgy segmentinfo040408
atmos enerrgy segmentinfo040408
finance35
 
Abch group results booklet 2010
Abch group results booklet 2010Abch group results booklet 2010
Abch group results booklet 2010
wgjlubbe
 
union pacific reclassification
 union pacific reclassification union pacific reclassification
union pacific reclassification
finance16
 

Similaire à Bogardus spreadsheet example part 2 (20)

Westheimer mobil station
Westheimer mobil stationWestheimer mobil station
Westheimer mobil station
 
Westheimer mobil station
Westheimer mobil stationWestheimer mobil station
Westheimer mobil station
 
alltel 3Q06_Proformaa
alltel  3Q06_Proformaaalltel  3Q06_Proformaa
alltel 3Q06_Proformaa
 
alltel 3Q06_Proformaa
alltel  3Q06_Proformaaalltel  3Q06_Proformaa
alltel 3Q06_Proformaa
 
Dcf
DcfDcf
Dcf
 
Sample Budget
Sample BudgetSample Budget
Sample Budget
 
alltel 2Q06_Proforma
alltel  2Q06_Proformaalltel  2Q06_Proforma
alltel 2Q06_Proforma
 
alltel 3Q06_InvestorSupplementa
alltel  3Q06_InvestorSupplementaalltel  3Q06_InvestorSupplementa
alltel 3Q06_InvestorSupplementa
 
FSAE-A Business Presentation - Redback Racing 2017
FSAE-A Business Presentation - Redback Racing 2017FSAE-A Business Presentation - Redback Racing 2017
FSAE-A Business Presentation - Redback Racing 2017
 
alltel 4Q 06_Supplement
alltel  4Q 06_Supplementalltel  4Q 06_Supplement
alltel 4Q 06_Supplement
 
Erin Parker Atvidcf V1
Erin Parker Atvidcf V1Erin Parker Atvidcf V1
Erin Parker Atvidcf V1
 
Grape Leaf Financials
Grape Leaf FinancialsGrape Leaf Financials
Grape Leaf Financials
 
Acme Company Financial Model
Acme Company Financial ModelAcme Company Financial Model
Acme Company Financial Model
 
alltel 1Q06_Supplement
alltel  1Q06_Supplementalltel  1Q06_Supplement
alltel 1Q06_Supplement
 
atmos enerrgy segmentinfo040408
atmos enerrgy segmentinfo040408atmos enerrgy segmentinfo040408
atmos enerrgy segmentinfo040408
 
Abch group results booklet 2010
Abch group results booklet 2010Abch group results booklet 2010
Abch group results booklet 2010
 
Southern chemicals1
Southern chemicals1Southern chemicals1
Southern chemicals1
 
CHRSA P&L
CHRSA P&LCHRSA P&L
CHRSA P&L
 
Wassim Zhani Kroger Value.pdf
Wassim Zhani Kroger Value.pdfWassim Zhani Kroger Value.pdf
Wassim Zhani Kroger Value.pdf
 
union pacific reclassification
 union pacific reclassification union pacific reclassification
union pacific reclassification
 

Plus de LPE Learning Center

Impact of aerosols on respiratory health of dairy workers and residents livin...
Impact of aerosols on respiratory health of dairy workers and residents livin...Impact of aerosols on respiratory health of dairy workers and residents livin...
Impact of aerosols on respiratory health of dairy workers and residents livin...
LPE Learning Center
 
Estimation of infectious risks in residential populations near a center pivot...
Estimation of infectious risks in residential populations near a center pivot...Estimation of infectious risks in residential populations near a center pivot...
Estimation of infectious risks in residential populations near a center pivot...
LPE Learning Center
 

Plus de LPE Learning Center (20)

Animal agriculture adaptation planning guide (climate change)
Animal agriculture adaptation planning guide (climate change)Animal agriculture adaptation planning guide (climate change)
Animal agriculture adaptation planning guide (climate change)
 
Is it weather or is it climate? What is the difference?
Is it weather or is it climate? What is the difference?Is it weather or is it climate? What is the difference?
Is it weather or is it climate? What is the difference?
 
Why does climate change?
Why does climate change?Why does climate change?
Why does climate change?
 
The current state of cap-and-trade in the U.S. and the mandatory greenhouse g...
The current state of cap-and-trade in the U.S. and the mandatory greenhouse g...The current state of cap-and-trade in the U.S. and the mandatory greenhouse g...
The current state of cap-and-trade in the U.S. and the mandatory greenhouse g...
 
Mitigation of greenhouse gas emissions in animal agriculture
Mitigation of greenhouse gas emissions in animal agricultureMitigation of greenhouse gas emissions in animal agriculture
Mitigation of greenhouse gas emissions in animal agriculture
 
Contribution of greenhouse gas emissions: animal agriculture in perspective
Contribution of greenhouse gas emissions: animal agriculture in perspectiveContribution of greenhouse gas emissions: animal agriculture in perspective
Contribution of greenhouse gas emissions: animal agriculture in perspective
 
What Is a Water Footprint?
What Is a Water Footprint?What Is a Water Footprint?
What Is a Water Footprint?
 
What Is a Land Footprint?
What Is a Land Footprint?What Is a Land Footprint?
What Is a Land Footprint?
 
Impact of aerosols on respiratory health of dairy workers and residents livin...
Impact of aerosols on respiratory health of dairy workers and residents livin...Impact of aerosols on respiratory health of dairy workers and residents livin...
Impact of aerosols on respiratory health of dairy workers and residents livin...
 
Estimation of infectious risks in residential populations near a center pivot...
Estimation of infectious risks in residential populations near a center pivot...Estimation of infectious risks in residential populations near a center pivot...
Estimation of infectious risks in residential populations near a center pivot...
 
User capabilities and next generation phosphorus (p) indices
User capabilities and next generation phosphorus (p) indicesUser capabilities and next generation phosphorus (p) indices
User capabilities and next generation phosphorus (p) indices
 
Phosphorus indices what is the water quality goal
Phosphorus indices what is the water quality goalPhosphorus indices what is the water quality goal
Phosphorus indices what is the water quality goal
 
How legacy nutrients affect farm conservation measures
How legacy nutrients affect farm conservation measuresHow legacy nutrients affect farm conservation measures
How legacy nutrients affect farm conservation measures
 
Estimation of phosphorus loss from agricultural land in the southern region o...
Estimation of phosphorus loss from agricultural land in the southern region o...Estimation of phosphorus loss from agricultural land in the southern region o...
Estimation of phosphorus loss from agricultural land in the southern region o...
 
Estimation of phosphorus loss from agricultural land in the heartland region ...
Estimation of phosphorus loss from agricultural land in the heartland region ...Estimation of phosphorus loss from agricultural land in the heartland region ...
Estimation of phosphorus loss from agricultural land in the heartland region ...
 
Checking ambition with reality the pros and cons of different approaches to s...
Checking ambition with reality the pros and cons of different approaches to s...Checking ambition with reality the pros and cons of different approaches to s...
Checking ambition with reality the pros and cons of different approaches to s...
 
Removing phosphorus from drainage water the phosphorus removal structure
Removing phosphorus from drainage water the phosphorus removal structureRemoving phosphorus from drainage water the phosphorus removal structure
Removing phosphorus from drainage water the phosphorus removal structure
 
Legacy phosphorus in calcareous soils effects of long term poultry litter app...
Legacy phosphorus in calcareous soils effects of long term poultry litter app...Legacy phosphorus in calcareous soils effects of long term poultry litter app...
Legacy phosphorus in calcareous soils effects of long term poultry litter app...
 
Identify and synthesize methods to refine phosphorus indices from three regio...
Identify and synthesize methods to refine phosphorus indices from three regio...Identify and synthesize methods to refine phosphorus indices from three regio...
Identify and synthesize methods to refine phosphorus indices from three regio...
 
Modeling phosphorus runoff in the chesapeake bay region to test the phosphoru...
Modeling phosphorus runoff in the chesapeake bay region to test the phosphoru...Modeling phosphorus runoff in the chesapeake bay region to test the phosphoru...
Modeling phosphorus runoff in the chesapeake bay region to test the phosphoru...
 

Bogardus spreadsheet example part 2

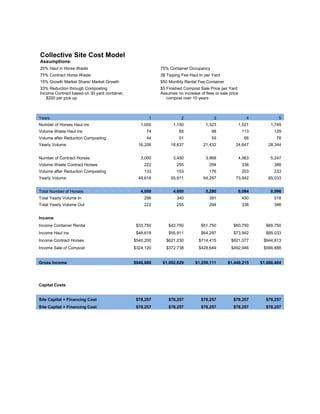
  • 1. Collective Site Cost Model Assumptions: 25% Haul in Horse Waste 75% Container Occupancy 75% Contract Horse Waste 3$ Tipping Fee Haul In per Yard 15% Growth Market Share/ Market Growth $50 Monthly Rental Fee Container 33% Reduction through Composting $5 Finished Compost Sale Price per Yard Income Contract based on 30 yard container, Assumes no increase of fees or sale price $200 per pick up compost over 10 years Years 1 2 3 4 5 Number of Horses Haul ins 1,000 1,150 1,323 1,521 1,749 Volume Waste Haul ins 74 85 98 113 129 Volume after Reduction Composting 44 51 59 68 78 Yearly Volume 16,206 18,637 21,432 24,647 28,344 Number of Contract Horses 3,000 3,450 3,968 4,563 5,247 Volume Waste Contract Horses 222 255 294 338 388 Volume after Reduction Composting 133 153 176 203 233 Yearly Volume 48,618 55,911 64,297 73,942 85,033 Total Number of Horses 4,000 4,600 5,290 6,084 6,996 Total Yearly Volume In 296 340 391 450 518 Total Yearly Volume Out 222 255 294 338 388 Income Income Container Rental $33,750 $42,750 $51,750 $60,750 $69,750 Income Haul ins $48,618 $55,911 $64,297 $73,942 $85,033 Income Contract Horses $540,200 $621,230 $714,415 $821,577 $944,813 Income Sale of Compost $324,120 $372,738 $428,649 $492,946 $566,888 Gross Income $946,688 $1,092,629 $1,259,111 $1,449,215 $1,666,484 Capital Costs Site Capital + Financing Cost $78,257 $78,257 $78,257 $78,257 $78,257 Site Capital + Financing Cost $78,257 $78,257 $78,257 $78,257 $78,257
  • 2. Support Equipment and Financing Phase One Phase Two Truck $110,000 $10,598 $110,000 $110,000 Mixer $75,000 $7,226 Trommel Screen $85,000 $8,189 Front End Loader $120,000 $11,561 $120,000 $120,000 Containers $225,000 $21,677 $60,000 $60,000 $60,000 $60,000 ASP Pad & Aeration System $450,000 $29,273 $450,000 Equipment Cost $1,065,000 Yearly Payment Principle, Interest+Cash expenditure $59,251 $119,251 $129,848 $141,409 $192,841 Operating Cost Labor $129,416 $142,358 $156,593 $172,253 $189,478 Insurance and overhead $69,500 $76,450 $84,095 $92,505 $101,755 Electrical and Utilities $71,743 $78,917 $86,809 $95,490 $105,039 Fuel $171,600 $188,760 $207,636 $228,400 $251,240 Maintenance $23,750 $26,125 $28,738 $31,611 $34,772 Total Operating Cost $466,009 $512,610 $563,871 $620,258 $682,284 Total Cost $603,517 $710,117 $771,976 $839,924 $953,382 Net Income $343,171 $382,511 $487,134 $609,290 $713,102