1. DRUGS, COSMETICS, FORENSIC SCIENCES
Confirmation of Azaperone and Its Metabolically Reduced Form,
Azaperol, in Swine Liver by Gas Chromatography/Mass
Spectrometry
ADAM: JOURNAL OF AOAC INTERNATIONAL VOL. 82, NO. 4, 1999
LAURA A. ADAM
U.S. Food and Drug Administration, Center for Veterinary Medicine, Office of Surveillance of Compliance, 7500 Standish
Pl, Rockville, MD 20855
The method described confirms the use of the
tranquilizer azaperone by detecting the parent
compound and the metabolically reduced form,
azaperol. Both are confirmed in swine liver at a tar-
get concentration of 10 ppb by gas chromatogra-
phy/mass spectrometry (GC/MS) with electron ion-
ization in the selected-ion-monitoring mode. Swine
liver tissue is ground with dry ice. Acetonitrile is
added to extract the drug from the tissue. Sodium
chloride buffer is added to the extract in prepara-
tion for solid-phase extraction (SPE). The aqueous
extract is loaded onto an SPE cartridge designed
to extract acidic and neutral drug residues from bi-
ological matrixes. The cartridge is washed with
methanol and conditioned with sodium phosphate
buffer. Azaperone and azaperol residues are eluted
with a 2% ammonium hydroxide in ethyl acetate.
The extracts are evaporated to dryness under a
stream of nitrogen and reconstituted in ethyl ace-
tate for GC/MS analysis. A DB-1 analytical column
is used to separate the compounds prior to elec-
tron ionization. The parent ion, the base peak ion,
and one diagnostic fragment ion are monitored for
both compounds. The method was validated with for-
tified tissue samples containing both azaperone and
azaperol. Azaperone-incurred tissues also were ana-
lyzed, and the presence of the parent drug and the
metabolically reduced form, azaperol, was confirmed.
A
zaperone is a neuroleptic tranquilizer belonging to the
class of butyrophenones. The current literature for
azaperone is limited, but information is available for
other related butyrophenones (1–4). The antipsychotic
butyrophenones also inhibit motor activity in animals (2).
These tranquilizers may be used therapeutically in veterinary
medicine to reduce aggressiveness and activity during live-
stock breeding (5). Azaperone is approved by the U.S. Food
and Drug Administration (FDA) for use at 2.2 mg/kg (CFR 21,
522.150) to control aggressiveness when mixing or regroup-
ing weanling or feeder pigs weighing up to 80 pounds (6).
Azaperone is not approved by the FDA for use in mar-
ket-weight swine, although it is known to be used in an ex-
tra-label manner and given prophylactically to prevent stress
in market-weight pigs during transport to the slaughterhouse.
Market-weight pigs are sensitive to stress due to transport, and
various veterinary tranquilizers are used to prevent mortality
and loss of meat quality caused by this stress. These tranquil-
izers may be administered only a few hours before slaughter
and may then give rise to residues in the animal (7, 8).
Azaperone is one of the most widely used veterinary tran-
quilizers (9). It is active at low doses (0.5 to 2.0 mg/kg), the in-
cidence of side effects is low, and it is very effective in pre-
venting traumatic shock (10). It is a short-acting drug; 16 h
after administration, it is essentially completely removed from
pig tissues (11–13).
Published analytical methods exist for azaperone and re-
lated butyrophenone tranquilizers with varying detection ca-
pabilities. In addition to residue analysis, methods have been
designed for analytical forensic toxicology and clinical chem-
istry applications. These methods use various chromato-
graphic techniques such as thin-layer chromatography
(5, 14, 15), liquid chromatography (LC; 5, 6, 16–20), and gas
chromatography (GC; 21, 22). Various mass spectrometric
(MS) techniques (23, 24) such as LC/MS (4, 16), GC/MS
(25–28), and LC-tandem MS (LC-MS/MS; 29–32) also have
been reported. However, none of these meet the Center for Vet-
erinary Medicine (CVM) requirements for confirmation of
azaperone residues.
CVM requires that a method be validated with both known
negative and fortified control samples. The method must show
specific criteria for analyte retention time matching and rela-
tive abundance matching for at least 3 diagnostic ion frag-
ments for each target. Furthermore, many of the published
procedures rely on chlorinated solvents to extract the drug
from the matrix. Use of chlorinated solvents is not desirable
for health, safety, and environmental reasons.
After our approach had been validated and found to con-
form to our criteria, azaperone-incurred tissues were gener-
ated at our facility and analyzed. The presence of both the par-
ADAM: JOURNAL OF AOAC INTERNATIONAL VOL. 82, NO. 4, 1999 815
Received July 22, 1998. Accepted by JM January 1, 1999.
2. ent drug and the metabolically reduced form, azaperol, were
confirmed in the incurred tissue.
METHOD
Apparatus
Unless noted otherwise, equivalent apparatus and reagents
may be substituted.
(a) Centrifuge.—Beckman GPR centrifuge equipped with
a Model CH 3.7 swinging bucket rotor (Beckman/Spinco Di-
vision, Palo Alto, CA).
(b) Nitrogen evaporator.—Meyer N-EVAP analytical
evaporator, Model 111, equipped with Luer adapters for Pas-
teur pipettes (Organomation Associates, South Berlin, MA).
(c) Sample processor.—Robot Coupe sample processor,
Model RSI BX6V, equipped with stainless steel bowl and cut-
ting blades (Robot Coupe USA, Ridglan, MS).
(d) Solid-phase extraction (SPE) cartridges.—Bond Elut
Certify HF cartridges for rapid extraction of drugs of abuse,
Varian Cat. No. 1410-2081, 3 cc/300 mg (Varian, Harbor
City, CA).
(e) Vacuum manifold.—Visiprep DL SPE vacuum mani-
fold equipped with disposal flow control liners (Supelco,
Bellefonte, PA).
(f) Vortex mixer.—Vortex Genie 2, Model G-560 (Scien-
tific Industries, Bohemia, NY).
816 ADAM: JOURNAL OF AOAC INTERNATIONAL VOL. 82, NO. 4, 1999
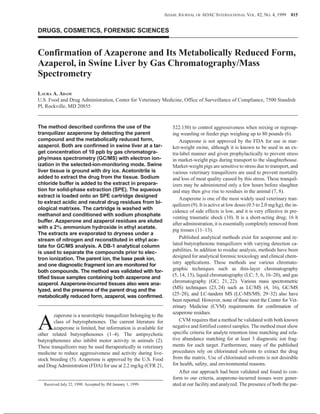
Figure 1. Structure and main fragment ions of azaperone.
Figure 2. Structure and main fragment ions of reduced azaperone: azaperol.
3. Reagents
(a) Ammonium hydroxide, 28.0–30.0%.—J.T. Baker
(Phillipsburg, NJ).
(b) Azaperol.—Research Diagnostics (Flanders, NJ).
(c) Azaperone.—Research Diagnostics.
(d) Hydrochloric acid (HCl), concentrated.—Fisher Sci-
entific (Fairlawn, NJ). Used to adjust pH of phosphate buffer
solution.
(e) Potassium hydroxide.—J.T. Baker. Used to adjust pH
of phosphate buffer solution.
(f) Sodium phosphate, monobasic, monohydrate, crys-
tal.—J.T. Baker.
(g) Sodium sulfate, anhydrous powder.—J.T. Baker.
(h) Solvents.—UV spectrophotometric grade ethyl ace-
tate, acetonitrile, and methanol (Burdick & Jackson,
Muskegon, MI).
(i) Stearic acid methyl ester (methyl stearate).—Sigma
Chemical (St. Louis, MO).
(j) Deionized water.—Purified through the Millipore
(Bedford, MA) Milli-Q UV plus system to a purity of
>17 MΩ/cm or equivalent. Use for all following references to
water.
(k) Dry ice pellets.—Clean pellets or chunks for grinding
tissues.
Solutions
Stability periods are noted in parentheses.
(a) Sodium chloride solution, 10% (w/v).—Store at room
temperature in a screw-capped bottle (6 months).
(b) 2% Ammonium hydroxide in ethyl acetate, elution so-
lution.—Prepare fresh daily.
(c) Phosphate buffer solution, 0.1M, pH 6.0.—Store at
ambient temperature. Inspect prior to use for any signs of con-
tamination or growth (30 days).
(d) Acetic acid 1.0M.—Store at room temperature in glass
or plastic (2 months).
(e) Azaperol stock standard, 1000 mg/mL
(RAZA-1000).—Store protected from light at 0°C or below
(6 months).
(f) Azaperone stock standard, 1000 mg/mL
(AZA-1000).—Store protected from light at 0°C or below
(6 months).
(g) AZA/RAZA mixed standard, 10 mg/mL
(AZA/RAZA-10).—Combine equal volumes of AZA-1000
and RAZA-1000. Dilute with ethyl acetate to yield a solution
containing 10 µg/mL each of AZA and RAZA. Store pro-
tected from light at 0°C or below (2 months).
(h) AZA/RAZA mixed standard, 1 mg/mL
(AZA/RAZA-1).—Dilute mixed standard AZA/RAZA-10 so-
lution to yield a solution containing 1.0 µg/mL each of AZA
and RAZA. Store protected from light at 0°C or below
(2 months). This solution is used to fortify tissue samples.
(i) Potassium hydroxide, 1.0M.—Store at ambient tem-
perature (3 months).
Animal Treatment
To generate a tissue sample containing azaperone residues
and metabolites, a male pig weighing 79 kg was intramuscu-
larly injected with 32 mg azaperone U.S.P. dissolved in etha-
nol. The animal displayed no unusual behavior after injection.
After 2 h, the pig was sacrificed, and the liver tissue was col-
lected for analysis.
ADAM: JOURNAL OF AOAC INTERNATIONAL VOL. 82, NO. 4, 1999 817
Figure 3. Suggested fragmentation and rearrangement to yield the base peak ion at m/z 107.
4. Sample Preparation
Cut fresh livers into chunks. Pregrind dry ice to a fine pow-
der in a sample processor. Quickly drop individual liver
chunks into processor and grind into a fine powder at high
speed. Allow dry ice to sublime in a –20°C freezer, leaving a
fine powder of frozen liver.
Extraction of Samples
It is convenient to prepare 6 to 9 samples in a batch depend-
ing on positions available in the centrifuge or the evaporator.
Include at least one known negative control and one fortified
sample with each day’s test samples. Begin by weighing 10 g
portions of the uniformly ground powder. To prepare fortified
samples, add 100 µL AZA/RAZA-1. Mix on a Vortex mixer
briefly. Add 10 mL acetonitrile to each sample tube, cap the
tube tightly, and mix on a Vortex mixer for 30 s. Sonicate for
10 min. Repeat the mixing and sonication once. Centrifuge
sample at ambient temperature for 30 min at 3300 RCF (rela-
tive centrifugal force). Pour the upper acetonitrile layer into a
new tube that contains 40 mL 10% NaCl solution. Discard the
liver tissue pellet. Mix the sample tubes on a Vortex mixer.
Condition the Bond Elut Certify SPE cartridges (33) with
6 mL methanol followed by 6 mL 0.1M sodium phosphate
buffer. Transfer the aqueous extracts directly to the condi-
tioned SPE cartridge. Reduce vacuum and slowly draw the ex-
tract through the SPE until all the extract has been loaded (at
818 ADAM: JOURNAL OF AOAC INTERNATIONAL VOL. 82, NO. 4, 1999
Figure 4. Electron ionization mass spectrum of azaperone showing the molecular ion at m/z 327 and the charac-
teristic fragment ions at m/z 233 and 107.
5. least 10 min). Rinse the charged SPE cartridges with 3 mL
1.0M acetic acid. Dry the cartridge under full vacuum for
5 min. Rinse cartridges again with 3.0 mL methanol and again
dry the cartridge. Elute with 3.0 mL ethyl acetate–ammonium
hydroxide (98 + 2) and evaporate to dryness under a stream of
nitrogen at ambient temperature. Reconstitute the dry extracts
in 50 µL ethyl acetate, briefly mix on a Vortex mixer, and
transfer to base-treated GC vials containing glass inserts to ac-
commodate the small volume. Adjust final volume to accom-
modate the sensitivity of the instrument. Inject and analyze
samples within 24 h.
Instrumental Operating Conditions
(a) GC/MS system.—Hewlett-Packard 5890 Series II gas
chromatograph equipped with a Series 5970 mass selective
detector and a Series 7673A automatic sampler
(Hewlett-Packard, Avondale, PA).
(b) Column.—DB-1 column (30 m, 0.25 µm film, and
0.25 mm od; J&W Scientific, Folsom, CA) baked at 250°C for
8 h before the daily analytical run.
(c) Injector.—Quartz 2 mm id, 250 µL, deactivated,
splitless injector liner; injector temperature, 240°C.
(d) Carrier gas.—Ultra-high-purity helium at a linear ve-
locity of 30 cm/s.
ADAM: JOURNAL OF AOAC INTERNATIONAL VOL. 82, NO. 4, 1999 819
Figure 5. Electron ionization mass spectrum of azaperol, the reduced form of azaperone, showing the molecular
ion at m/z 329 and the characteristic fragment ions at m/z 235 and 107.
6. (e) Operating temperatures.—40°C for 1 min, rise to
140°C at 30°C/min and to 190°C at 6°C/min, maintain at
190°C for 3 min, rise to 250°C at 30°C/min, maintain for
12.3 min; total run time for each analysis, 30 min; interface
transfer line temperature, 280°C.
(f) MS analysis.—Obtain electron ionization (EI) spectra
of analytes at 70 eV. Monitor sample extracts for ions at
m/z 329, 327, 309, 233, 235, 123, 125, and 107. Monitor ion
ratios m/z 329/107 and 235/107 for azaperol and m/z 327/107
and 233/107 for azaperone. The ion at m/z 309 corresponds to
loss of water from azaperone. This ion typically is not seen in
fresh azaperol standards.
System Suitability
Conduct these tests when first establishing the analytical
system and during evaluation, to verify system suitability. Ac-
ceptable criteria for actual assays follow:
(a) Ethyl acetate blanks.—Inject a rinse of ethyl acetate to
verify baseline stability at the start of each analytical run and
after each sample.
(b) Method check.—To establish that reagents and other
aspects of the laboratory procedure are performing within ac-
ceptable limits, calculate the signal-to-noise (S/N) ratio with
the 1.0 ng/µL standard. The minimum peak-to-peak S/N ratio
must be greater than 3.
(c) Resolution and tailing.—Calculate per the current
method (34) based on the 1.0 g/µL mixed standard containing
AZA and RAZA. Resolution between the 2 peaks should be
greater than 2.0, and the tailing factors for both peaks should
be 1.2 or less. When system suitability criteria have been met,
begin analysis sequence with standards containing
1.0–4.0 g/µL azaperone and azaperol to verify the daily instru-
ment performance. Inject a solvent rinse before analysis of
known controls and before analysis of suspected samples. An-
alyze fortified samples last to avoid analyte carryover in the
820 ADAM: JOURNAL OF AOAC INTERNATIONAL VOL. 82, NO. 4, 1999
Table 1. Validation of azaperol in swine liver tissue
fortified at 10 ppba
Replicate No.
Abundance, %
m/z 329 m/z 235 m/z 107
Day 1
1 7.8 20.0 100
2 8.9 24.1 100
Averaged standards 9.32 7.3 100
Daily limits ≤19.3 17.3–37.3 Base peak
Day 2
3 15.3 26.1 100
4 8.1 24.5 100
5 11.3 25.5 100
6 19.9 21.8 100
Averaged standards 10.0 22.9 100
Daily limits ≤20.0 12.9–32.9 Base peak
Day 3
7 19.6 9.1 100
8 15.2 26.5 100
9 13.0 23.5 100
10 10.4 27.0 100
Averaged standards 9.8 17.6 100
Daily limits ≤19.8 7.6–27.6 Base peak
a
The columns correspond to the relative abundance percentages at
each of the diagnostic ion ratios. The abundance matching limits
were determined from the averaged daily standards that
correspond to the data presented here. Any apparent outliers are
due to differences between the daily abundance limits and the
averaged abundance limits for the 3-day period.
Table 2. Validation of azaperone in swine liver tissue
fortified at 10 ppba
Replicate No.
Abundance, %
m/z 327 m/z 309 m/z 233 m/z 107
Day 1
1 5.9 8.5 22.0 100
2 6.8 9.0 25.3 100
3 5.5 8.1 21.2 100
Averaged standards 7.8 11.3 26.7 100
Daily limits ≤17.8 1.3–21.3 16.7–36.7 Base peak
Day 2
4 6.0 9.8 25.8 100
5 6.9 11.4 28.2 100
6 5.7 9.5 22.7 100
7 6.9 9.7 25.8 100
Averaged standards 7.4 12.7 24.9 100
Daily limits ≤17.4 2.7–22.7 4.9–34.9 Base peak
Day 3
8 7.5 11.9 31.2 100
9 5.2 12.5 38.2 100
10 6.9 10.6 31.5 100
Averaged standards 5.4 8.9 21.9 100
Daily limits ≤15.4 ≤18.9 11.9–31.9 Base peak
a
The columns correspond to the relative abundance percentages at
each of the diagnostic ion ratios. The abundance matching limits
were determined from the averaged daily standards that
correspond to the data presented here. Any apparent outliers are
due to differences between the daily abundance limits and the
averaged abundance limits for the 3-day period.
7. GC inlet. Reanalyze standards at the end of the run, as the GC
column is sensitive to column loading. The second set of stan-
dard injections may show greater detector response because of
carryover and column loading. Inject 1 L of the extracts onto
the column.
Results and Discussion
Rapid extraction is achieved by Vortex mixing and
sonication of samples in acetonitrile. To eliminate a
time-consuming evaporation step, the acetonitrile extract is
diluted in concentrated salt solution and applied to the SPE.
The Bond Elut Certify SPE, which is marketed for routine
testing of drugs, contains a mixed sorbent bed designed to reli-
ably extract drug residues from complex biological matrixes.
It has been used successfully, for example, to extract
haloperidol from serum or urine. It performs well with our
mixed extract, which contains high concentrations of salt and
acetonitrile, giving a clean final extract.
This method was validated by analyzing control samples
fortified with azaperone and azaperol at 10 ppb. Figures 1–3
show the possible fragmentation and structures of the diagnos-
tic ions of azaperone and azaperol. Figures 4 and 5 are the EI
mass spectra of azaperone and azaperol, respectively. With
clean control tissue obtained from a U.S. Department of Agri-
culture market pig, fortified samples were prepared at the tar-
ADAM: JOURNAL OF AOAC INTERNATIONAL VOL. 82, NO. 4, 1999 821
Figure 6. Chromatogram of extract from a known incurred swine liver sample containing confirmed azaperone.
8. get concentration of 10 ppb. All fortified samples were con-
firmed, and all of the companion negative control samples
failed to confirm.
For a sample to be confirmed, the retention times must fall
within 10% of the acceptable retention time range of each
standard, based on the average of the standards included with
each batch. The ion ratios of a sample must match the corre-
sponding average ratios of the standards included in the analy-
sis batch within 10% absolute. Finally, the presence of both
the parent drug azaperone and the metabolically reduced form
must be confirmed to distinguish between actual misuse of
azaperone and cases of carryover from the GC inlet.
Tables 1 and 2 list ion abundances from the selec-
tive-ion-monitoring (SIM) analysis of the fortified samples.
Method performance was validated with incurred tissues from
an azaperone-dosed pig. Tissues were tested immediately af-
822 ADAM: JOURNAL OF AOAC INTERNATIONAL VOL. 82, NO. 4, 1999
Figure 7. Chromatogram of extract from a known incurred swine liver sample containing confirmed azaperol.
9. ter slaughter and after freezing at –80°C for 6 weeks. In all
cases, azaperone use was confirmed. Figures 6 and 7 show
chromatograms of extracts from the same sample of known
incurred liver tissue that confirmed for both azaperone and
azaperol. Tables 3 and 4 list ion abundances from the SIM
analysis of fresh and frozen incurred tissues.
Conclusions
The method reliably confirmed presence of azaperone in
swine liver tissue by identifying both the parent drug com-
pound and the metabolically reduced target compound,
azaperol. By using SPE cartridges designed for drug-of-abuse
testing, we were able to keep costs down and ensure specific-
ity toward the target compound. To save time and to reduce
the number of transfer steps, the organic sample extracts were
dissolved in a large volume of salt solution. This step pre-
cluded the need for a long evaporation step and reduced sam-
ple losses due to transfer. By relying on common instrumenta-
tion to detect 2 compounds simultaneously, the method is well
suited for confirming cases of suspected extra label use of
azaperone because it reliably identifies both the parent drug
and the metabolite, azaperol, at a concentration of 10 ppb.
Acknowledgments
I thank David Heller of the Office of Research (FDA) for
discussions on mass spectrometry and Mark Henderson of the
Office of Research for generating the incurred liver tissues.
References
(1) Budavari, S. (Ed.) (1989) The Merck Index, 11th Ed., Merck
and Company, Inc., Rahway, NJ
(2) Goodman, L.S., & Gilman, A. (1970) The Pharmacological
Basis of Therapeutics, 4th Ed., The Macmillian Co., New
York, NY
(3) Hoffman, D.W., & Edkins, R.D. (1994) Ther. Drug Monitor.
16, 504–508
(4) Lerena, A.L., Dahl, M.L., Ekquist, B., & Bertilsson, L.
(1992) Ther. Drug Monitor. 14, 261–264
(5) Grohmann, H.G., Scheutwinkel-Reich, M., Preiss, A.M., &
Stan, H.J. (1983) Rec. Dev. Mass Spectrom. Biochem. Med.
Environ. Res. 245, 117–127
(6) Code of Federal Regulations (1992) 522.150
(7) Van Ginkel, L.A., Schwillens, P.L.W.J., & Olling, M. (1989)
Anal. Chim. Acta 225, 137–146
(8) Keukens, H.J., & Aerts, M.M.L. (1989) J. Chromatogr. 464,
149–161
(9) Gregory, N.G., & Wilkens, L.J. (1986) J. Vet. Pharmacol.
Ther. 9, 169–170
(10) Marsboom, R. (1969) Acta Zool. Pathol. Antverpiensia 48,
155–161
(11) Heykants, J., Symoens, J., & Marsboom, R. (1972)
Arzneimittel Forschung 21, 1357–1358
(12) Heykants, J., Symoens, J., & Marsboom, R. (1972)
Arzneimittel Forschung 21, 1263–1269
(13) Chu, P.S. (1995) Evaluation of an Analytical Method for the
Determination of Azaperone Residues in Swine Liver and
Kidney, FDA/CVM/OSB Final Report
(14) Olling, M., Stephany, R.W., & Rauws, A.G. (1981) J. Vet.
Pharmacol. Therap. 4, 291–294
(15) Haagsma, N., Bathelt, E.R., & Engelsma, J.W. (1988) J.
Chromatogr. 426, 73–79
(16) Etter, R., Battaglia, R., Noser, J., & Schuppiser, F. (1984)
Mitt. Gebiete Lebensm. Hyg. 75, 447–458
(17) Arneth, W. (1990) in Proc. Euro Residue Conference, May
21–23, 1990, University of Utrecht, Noordwijkerhout, The
Netherlands, 101–104
(18) Cahard, C., Rop, P.P., & Conquy, T. (1990) J. Chromatogr.
532, 193–202
(19) Rose, M.D., & Shearer, G. (1992) J. Chromatogr. 624,
471–477
ADAM: JOURNAL OF AOAC INTERNATIONAL VOL. 82, NO. 4, 1999 823
Table 3. Validation of azaperol in incurred swine liver
tissuea
Replicate No.
Abundance, %
m/z 329 m/z 235 m/z 107
Day 1
1 5.3 14.3 100
2 5.8 12.9 100
3 4.9 13.5 100
4 3.4 15.2 100
5 4.6 9.3 100
6 6.0 15.0 100
Averaged standards 5.4 12.5 100
Daily limits ≤15.4 2.5–22.5 Base peak
Day 2
7 5.7 13.5 100
8 6.0 13.6 100
9 6.5 15.4 100
10 3.6 14.2 100
11 6.0 14.3 100
Averaged standards 3.5 11.8 100
Daily limits ≤13.5 1.8–21.8 Base peak
Day 3
12 1.0 8.9 100
13 4.6 11.6 100
14 4.1 17.1 100
15 2.1 14.9 100
Averaged standards 3.8 12.6 100
Daily limits ≤13.8 2.6–22.6 Base peak
a
The columns correspond to the relative abundance percentages at
each of the diagnostic ion ratios. Abundance matching limits were
calculated by averaging the daily responses. Data for day 1 were
collected from fresh tissue samples. The samples had been frozen
prior to analysis for days 2 and 3.
10. (20) Arneth, W. (1995) Zeitschrift fur Lebensmittel-Untersuchung
and Forschung 201, 261–265
(21) Seno, H., Suzuki, O., Kumazawa, T., & Asano, M. (1989)
Zeitschrift fur Rechtsmedizin 102, 127–132
(22) Tyndale, R.F., & Inaba, T. (1990) J. Chromatogr. 529,
182–188
(23) Frigerio, A., & Rovere, C. (1972) Org. Mass Spectrom. 6,
1051–1058
(24) Tomlinson, A.J., Braddock, W.D., Benson, L.M., Oda, R.P.,
& Naylor, S. (1995) J. Chromatogr. B 669, 67–73
(25) Maurer, H., & Pfleger, K. (1983) J. Chromatogr. 272, 75–85
(26) Caccia, S., Notarnicola, A., Fong, M.H., & Benfenati, E.
(1984) J. Chromatogr. 238, 211–221
(27) Van Boven, M., & Daenes, P. (1992) J. Anal. Toxicol. 16,
33–35
(28) Mauer, H. (1992) J. Chromatogr. 580, 3–41
(29) Naylor, S., Kajbaf, M., Lamb, J.H., Jahanshahi, M., &
Gorrod, J.W. (1993) Biol. Mass Spectrom. 22, 388–394
(30) Chui, Y.C., Esaw, B., & Laviolette, B. (1994) J. Chromatogr.
B 652, 23–33
(31) Verweij, A.M.A., Hordijk, M.L., & Lipman, P.J.L. (1995) J.
Anal. Toxicol. 19, 65–68
(32) Verweij, A.M.A., Hordijk, M.L., & Lipman, P.J.L. (1996) J.
Chromatogr. B 686, 27–34
(33) Varian Sample Preparation Products (1997) Certify Methods
Manual, Varian, Inc., Harbor City, CA
(34) U.S. Pharmacopea XXIII (1995) U.S. Pharmacopeal Conven-
tion, Rockville, MD
824 ADAM: JOURNAL OF AOAC INTERNATIONAL VOL. 82, NO. 4, 1999