the-rewarding-distribution-of-us-stock-market-returns.pdf
•
0 j'aime•592 vues

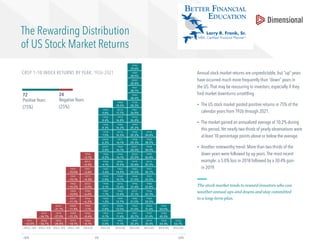
This document presents data on annual stock market returns in the US from 1926 to 2021. It shows that the market had positive returns in 75% of years, and the average annualized return was 10.2%. However, nearly two-thirds of yearly returns were at least 10 percentage points above or below the average. It also notes that more than two-thirds of down years were followed by up years, such as the 5% loss in 2018 followed by a 30.4% gain in 2019. The document concludes that investors who can withstand short-term volatility and maintain a long-term perspective tend to be rewarded in the stock market.

Recommandé
Recommandé
Contenu connexe
Similaire à the-rewarding-distribution-of-us-stock-market-returns.pdf
Similaire à the-rewarding-distribution-of-us-stock-market-returns.pdf (20)
Plus de Better Financial Education
Plus de Better Financial Education (20)
Dernier
Dernier (20)
the-rewarding-distribution-of-us-stock-market-returns.pdf
- 1. 1950 29.6% 1989 28.9% 2009 28.8% 1967 28.7% 1943 28.4% 1988 18.0% 1938 28.2% 1992 9.8% 2010 17.7% 1961 26.9% 1926 8.4% 1972 16.8% 1976 26.8% 1956 8.3% 1986 16.2% 1999 25.2% 1978 7.5% 2012 16.2% 1955 25.2% 1975 38.8% 2005 6.2% 1971 16.1% 1998 24.3% 1945 38.5% 2007 5.8% 1964 16.1% 2021 24.0% 1928 38.4% 1994 −0.1% 1984 4.5% 1942 16.1% 2020 23.5% 1995 36.8% 2015 −0.5% 1934 4.1% 2006 15.5% 1979 22.6% 2013 35.2% 1957 −10.0% 1981 −3.6% 1947 3.6% 1965 14.5% 1983 22.0% 1991 34.7% 1941 −10.1% 1977 −4.3% 1939 2.8% 1968 14.1% 1944 21.5% 1927 33.5% 1962 −10.2% 2018 −5.0% 1948 2.1% 2016 13.6% 1996 21.4% 1980 32.8% 1969 −10.9% 1990 −6.0% 1987 1.7% 1952 13.4% 2017 21.1% 1936 32.3% 2001 −11.1% 1946 −6.2% 1960 1.2% 1959 12.7% 1982 21.0% 1985 32.2% 2002 −21.1% 2000 −11.4% 1940 −7.1% 2011 0.8% 2004 12.0% 1963 21.0% 2003 31.6% 1954 50.0% 1937 −34.7% 1974 −27.0% 1929 −15.2% 1932 −8.6% 1953 0.7% 2014 11.6% 1951 20.7% 1997 31.4% 1958 45.0% 1931 −43.5% 2008 −36.7% 1930 −28.8% 1973 −18.1% 1966 −8.7% 19701 0.0% 1993 11.1% 1949 20.2% 2019 30.4% 1935 44.4% 1933 56.7% −50% to −40% −40% to −30% −30% to −20% −20% to −10% −10% to 0% 0% to 10% 10% to 20% 20% to 30% 30% to 40% 40% to 50% 50% to 60% —50% 0% 60% The Rewarding Distribution of US Stock Market Returns Annual stock market returns are unpredictable, but “up” years have occurred much more frequently than “down” years in the US.That may be reassuring to investors, especially if they find market downturns unsettling. • The US stock market posted positive returns in 75% of the calendar years from 1926 through 2021. • The market gained an annualized average of 10.2% during this period. Yet nearly two-thirds of yearly observations were at least 10 percentage points above or below the average. • Another noteworthy trend: More than two-thirds of the down years were followed by up years.The most recent example: a 5.0% loss in 2018 followed by a 30.4% gain in 2019. The stock market tends to reward investors who can weather annual ups and downs and stay committed to a long-term plan. 72 Positive Years (75%) 24 Negative Years (25%) CRSP 1–10 INDEX RETURNS BY YEAR, 1926–2021
- 2. AMERICAS Austin, Charlotte, Santa Monica, Toronto, Vancouver EUROPE Amsterdam, Berlin, Dublin, London ASIA PACIFIC Hong Kong, Melbourne, Singapore, Sydney, Tokyo MKT-19024 05/22 2115074 Past performance is no guarantee of future results.Investing risks include loss of principal and fluctuating value.There is no guarantee an investment strategy will be successful.Indices are not available for direct investment.Their performance does not reflect the expenses associated with the management of an actual portfolio. In US dollars. CRSP data provided by the Center for Research in Security Prices, University of Chicago.The CRSP 1–10 Index measures the performance of the total US stock market, which it defines as the aggregate capitalization of all securities listed on the NYSE,AMEX, and NASDAQ exchanges. Dimensional Fund Advisors LP is an investment advisor registered with the Securities and Exchange Commission. Investment products: • Not FDIC Insured • Not Bank Guaranteed • May Lose Value Dimensional Fund Advisors does not have any bank affiliates. 1. Return in 1970 was 0.002%.