Outlook for Week of July 8, 2019
•
0 j'aime•3,394 vues

Free weekly newsletter with outlook and brief comments for world stock markets. Weekly reversal levels for stocks, gold and currencies. This method was designed to keep you on the right side of the market most of the time, letting the winners run while avoiding big losses.

Recommandé
Recommandé
Contenu connexe
Plus de LunaticTrader
Plus de LunaticTrader (17)
Dernier
Dernier (20)
Outlook for Week of July 8, 2019
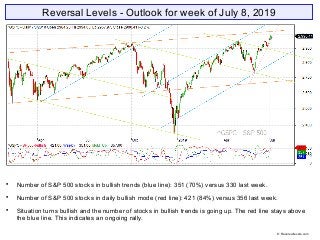
- 1. Reversal Levels - Outlook for week of July 8, 2019 Number of S&P 500 stocks in bullish trends (blue line): 351 (70%) versus 330 last week. Number of S&P 500 stocks in daily bullish mode (red line): 421 (84%) versus 356 last week. Situation turns bullish and the number of stocks in bullish trends is going up. The red line stays above the blue line. This indicates an ongoing rally. © Reversallevels.com
- 2. ELC: up | BMO: up | Blue snake: turns up | Repellor: up. The longer term picture stays bullish. All indicators point up and the S&P 500 is trying to push above the 3000 barrier. © Reversallevels.com S&P 500 Weekly chart
- 3. Buy signal for Nikkei. All major markets are in bullish trends. Ongoing partial profits signal for Australia AOI. An 11% gain in 21 weeks. Partial profits signal for Bonds TLT. An 11% gain in 30 weeks. Gold stays fully bullish with upward MoM. EURUSD is in a young bullish trend. Needs follow through to avoid a failed rally. Oil changes to weak bearish. Wheat is fully bullish. Hold. © Reversallevels.com Major indices
- 4. Buy signal for Hong Kong HSI and Indonesia JCI. Bullish divergence for Mexico IPC. Further improvement. Nearly all markets are in bullish trends with upward MoM. We don’t know how far the moves will carry. The normal strategy is to hold until Sell signals appear and take some money off the table on good Partial Profits signals. World markets © Reversallevels.com
- 5. Partial profits signal for DIS. A 23% gain in 13 weeks. Partial profits signal for MCD. A 28% gain in 43 weeks. Partial profits signal for TRV. A 20% gain in 20 weeks. 22 stocks bullish, unchanged from 22 last week. Above 20 = bullish market. See article: Keeping an eye on the Dow stocks In a significant market advance we normally see the number of Dow stocks in bullish trends get above 25. Not there yet. . 30 Dow Jones Industrials stocks © Reversallevels.com
- 6. Sell signal for USDMXN. Currencies tend to make long trending moves, so we don’t get weekly Buy or Sell signals so often. For daytraders or swing traders: if you do your trading in the direction of the weekly trend you are likely to do well in the long run. So, try to buy the pullbacks in currencies pairs that are in weekly bullish trends and sell the rips during weekly bearish trends. Forex & Crypto © Reversallevels.com
- 7. On Twitter: http://twitter.com/lunatictrader1 On Stocktwits: http://stocktwits.com/LunaticTrader Website: Reversallevels.com For daily comments and questions you can find us here: © Reversallevels.com Disclaimer Investing in stocks, forex or commodities is risky. No guarantee can be given that the opinions or predictions given in this presentation will be correct. Reversallevels.com cannot in any way be responsible for eventual losses you may incur if you trade based on the given information. Simulated trading programs in general are subject to the fact that they are designed with the benefit of hindsight. No representation is being made that any account will or is likely to achieve profits or losses similar to those shown. Trade at your own risk and responsibility. Subscription service Daily reversal levels for over 3000 stocks and ETF are available by monthly subscription. For less than $1 a day you can become a more efficient investor: 1 Month ($22) 6 Months ($110) 1 Year ($199) Comes with full instructions and strategies for using the reversal levels and MoM indicator in your own trading. This is an honest method with limited risk, not a get rick quick formula. Give it a try.