Outlook for Week of March 30, 2020
•
0 j'aime•3,369 vues

Free weekly newsletter with outlook and brief comments for world stock markets. Weekly reversal levels for stocks, gold and currencies. This method was designed to keep you on the right side of the market most of the time, letting the winners run while avoiding big losses.

Recommandé
Recommandé
Contenu connexe
Plus de LunaticTrader
Plus de LunaticTrader (17)
Dernier
Dernier (20)
Outlook for Week of March 30, 2020
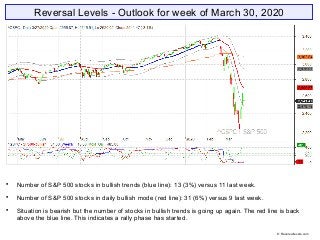
- 1. Reversal Levels - Outlook for week of March 30, 2020 Number of S&P 500 stocks in bullish trends (blue line): 13 (3%) versus 11 last week. Number of S&P 500 stocks in daily bullish mode (red line): 31 (6%) versus 9 last week. Situation is bearish but the number of stocks in bullish trends is going up again. The red line is back above the blue line. This indicates a rally phase has started. © Reversallevels.com
- 2. ELC: down | BMO: down | Blue snake: down | Repellor: down. BMO is starting to flatten out at a very low level. This is normally the first indicator to turn up after a significant decline. © Reversallevels.com S&P 500 Weekly chart
- 3. All major stock indexes stay in bearish trends with downward MoM. Bonds TLT are giving a partial profits signal. Stays weak bullish. Gold is giving a weak Buy signal. Bouncing right back after last week’s Sell. This could be a fake-out move. EURUSD changes to weak bearish. Oil stays in a bearish trend and is now down a massive 60% since the Sell signal 9 weeks ago. © Reversallevels.com Major indices
- 4. All markets we cover are in bearish trends with downward MoM. All we can do is wait for Buy signals. That could take quite a while after a drop of this magnitude. Because markets are so far below their reversal levels the door is open for spectacular rebound rallies. It’s too early to tell if such rallies mark real bottoms. Once we see MoM turning back up we can become a bit more confident that rallies may have legs. So, stay patient. Thailand SET takes over as our best performer. It is down 33% since its Sell signal 33 weeks ago. World markets © Reversallevels.com
- 5. Speculative Buy signals for MMM, MRK and WBA 0 stocks bullish, unchanged from 0 last week. Below 15 = bear market. See: Keeping an eye on the Dow stocks Exxon Mobil XOM remains our best performer. A 51.1% decline since its Sell signal 46 weeks ago and the move is ongoing. Avoiding big losses is as important as staying in winning trades. . 30 Dow Jones Industrials stocks © Reversallevels.com
- 6. Sell signal for USDCHF. For daytraders or swing traders: if you do your trading in the direction of the weekly trend you are likely to do well in the long run. So, try to buy the pullbacks in currencies pairs that are in bullish trends and sell the rallies during bearish trends. Forex & Crypto © Reversallevels.com
- 7. On Twitter: http://twitter.com/lunatictrader1 On Stocktwits: http://stocktwits.com/LunaticTrader Website: Reversallevels.com For daily comments and questions you can find us here: © Reversallevels.com Disclaimer Investing in stocks, forex or commodities is risky. No guarantee can be given that the opinions or predictions given in this presentation will be correct. Reversallevels.com cannot in any way be responsible for eventual losses you may incur if you trade based on the given information. Simulated trading programs in general are subject to the fact that they are designed with the benefit of hindsight. No representation is being made that any account will or is likely to achieve profits or losses similar to those shown. Trade at your own risk and responsibility. Subscription service Daily reversal levels for over 3000 stocks and ETF are available by monthly subscription. For less than $1 a day you can become a more efficient investor: 1 Month ($22) 6 Months ($110) 1 Year ($199) Comes with full instructions and strategies for using the reversal levels and MoM indicator in your own trading. This is an honest method with limited risk, not a get rick quick formula. Give it a try.