Outlook for Week of May 13, 2019
•
1 j'aime•2,592 vues

Free weekly newsletter with outlook and brief comments for world stock markets. Weekly reversal levels for stocks, gold and currencies. This method was designed to keep you on the right side of the market most of the time, letting the winners run while avoiding big losses.

Recommandé
Recommandé
Contenu connexe
Plus de LunaticTrader
Plus de LunaticTrader (17)
Dernier
Dernier (20)
Outlook for Week of May 13, 2019
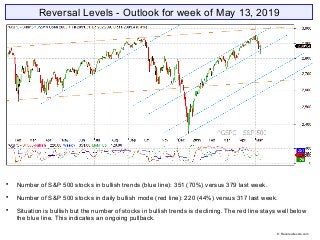
- 1. Reversal Levels - Outlook for week of May 13, 2019 Number of S&P 500 stocks in bullish trends (blue line): 351 (70%) versus 379 last week. Number of S&P 500 stocks in daily bullish mode (red line): 220 (44%) versus 317 last week. Situation is bullish but the number of stocks in bullish trends is declining. The red line stays well below the blue line. This indicates an ongoing pullback. © Reversallevels.com
- 2. ELC: up | BMO: down | Blue snake: up | Repellor: up. Market has pulled back within the blue snake, as expected. Stays well above the Repellor at 2711, so the longer term picture is still bullish. © Reversallevels.com S&P 500 Weekly chart
- 3. Most major stock indexes are in weak bullish trends now. Some markets are coming close to their RevL, so we could be getting Sell signals in the coming weeks. Bonds TLT are weak bullish with downward MoM. Gold is weak bullish. EURUSD changes to weak bearish and is showing a bullish divergence. Oil is in weak bullish trend and may be going for a test of the weekly RevL. Wheat is fully bearish with downward MoM. © Reversallevels.com Major indices
- 4. Sell signal for Indonesia JCI, Mexico IPC, South Korea KOSPI and Spain IBEX35. Several sellers and nearly all markets have downward weekly MoM now. This is at least a significant pullback and possibly the start of a bear market for some indexes. Until we see weekly MoM turn back up there is no good reason to do any new buying at this point. World markets © Reversallevels.com
- 5. Speculative Buy signal for WBA. Sell signals for BA, CAT, INTC and XOM. Partial profits signal for MCD. A 21% gain in 35 weeks. Partial profits signal for MSFT. A 19% gain in 16 weeks. 20 stocks bullish, down from 24 last week. Above 20 = bullish market. See article: Keeping an eye on the Dow stocks Significant deterioration. The partial profits signals of the recent weeks came at the right time. If the number of bullish stocks falls below 15 we will need to consider a possible bear market scenario. . 30 Dow Jones Industrials stocks © Reversallevels.com
- 6. Buy signal for USDCNY. Sell signal for USDJPY. Bullish divergence for USDMXN. Currencies tend to make long trending moves, so we don’t get weekly Buy or Sell signals so often. For daytraders or swing traders: if you do your trading in the direction of the weekly trend you are likely to do well in the long run. So, try to buy the pullbacks in currencies pairs that are in weekly bullish trends and sell the rips during weekly bearish trends. Forex & Crypto © Reversallevels.com
- 7. On Twitter: http://twitter.com/lunatictrader1 On Stocktwits: http://stocktwits.com/LunaticTrader Website: Reversallevels.com For daily comments and questions you can find us here: © Reversallevels.com Disclaimer Investing in stocks, forex or commodities is risky. No guarantee can be given that the opinions or predictions given in this presentation will be correct. Reversallevels.com cannot in any way be responsible for eventual losses you may incur if you trade based on the given information. Simulated trading programs in general are subject to the fact that they are designed with the benefit of hindsight. No representation is being made that any account will or is likely to achieve profits or losses similar to those shown. Trade at your own risk and responsibility. Subscription service Daily reversal levels for over 3000 stocks and ETF are available by monthly subscription. For less than $1 a day you can become a more efficient investor: 1 Month ($22) 6 Months ($110) 1 Year ($199) Comes with full instructions and strategies for using the reversal levels and MoM indicator in your own trading. This is an honest method with limited risk, not a get rick quick formula. Give it a try.