Outlook for Week of September 2, 2019
•
1 j'aime•2,860 vues

Free weekly newsletter with outlook and brief comments for world stock markets. Weekly reversal levels for stocks, gold and currencies. This method was designed to keep you on the right side of the market most of the time, letting the winners run while avoiding big losses.

Recommandé
Recommandé
Contenu connexe
Plus de LunaticTrader
Plus de LunaticTrader (17)
Dernier
Dernier (20)
Outlook for Week of September 2, 2019
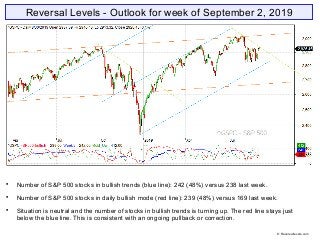
- 1. Reversal Levels - Outlook for week of September 2, 2019 Number of S&P 500 stocks in bullish trends (blue line): 242 (48%) versus 238 last week. Number of S&P 500 stocks in daily bullish mode (red line): 239 (48%) versus 169 last week. Situation is neutral and the number of stocks in bullish trends is turning up. The red line stays just below the blue line. This is consistent with an ongoing pullback or correction. © Reversallevels.com
- 2. ELC: down | BMO: down | Blue snake: up | Repellor: up. BMO is down to the zero line, where minor pullbacks typically end, but it’s not turning up yet. If the market drops below the Repellor at 2778 then a more serious bear market would become the base scenario. © Reversallevels.com S&P 500 Weekly chart
- 3. S&P 500, Australia AOI and Brazil Bovespa stay in weak bullish trends. Other major markets are fully bearish. Bonds TLT stay fully bullish. But MoM as it the 10-euphoric stage. That’s rare on a weekly chart. Gold keeps giving a partial profits signal. A 21% gain in 38 weeks. EURUSD is in a bearish trend and dropped below 1.10. Oil stays fully bearish with downward MoM. Wheat is in a bearish trend. © Reversallevels.com Major indices
- 4. Buy signal for Mexico IPC. Weak Buy signal for Italy MIB. Partial profits signal for XAU Gold stocks. A 34% gain in 12 weeks. A majority of world markets are in bearish trends. Some minor improvements this week. But we could easily see nearly all markets go in bearish trends before a real bottom is found. World markets © Reversallevels.com
- 5. Buy signal for VZ. Partial profits signal for PG. A 38% gain in 45 weeks. 12 stocks bullish, up from 11 last week. Below 15 = bearish market. See article: Keeping an eye on the Dow stocks MoM is turning up for a few stocks. Let’s see if that continues. . 30 Dow Jones Industrials stocks © Reversallevels.com
- 6. Buy signal for USDTRY. Currencies tend to make long trending moves, so we don’t get weekly Buy or Sell signals so often. For daytraders or swing traders: if you do your trading in the direction of the weekly trend you are likely to do well in the long run. So, try to buy the pullbacks in currencies pairs that are in weekly bullish trends and sell the rips during weekly bearish trends. Forex & Crypto © Reversallevels.com
- 7. On Twitter: http://twitter.com/lunatictrader1 On Stocktwits: http://stocktwits.com/LunaticTrader Website: Reversallevels.com For daily comments and questions you can find us here: © Reversallevels.com Disclaimer Investing in stocks, forex or commodities is risky. No guarantee can be given that the opinions or predictions given in this presentation will be correct. Reversallevels.com cannot in any way be responsible for eventual losses you may incur if you trade based on the given information. Simulated trading programs in general are subject to the fact that they are designed with the benefit of hindsight. No representation is being made that any account will or is likely to achieve profits or losses similar to those shown. Trade at your own risk and responsibility. Subscription service Daily reversal levels for over 3000 stocks and ETF are available by monthly subscription. For less than $1 a day you can become a more efficient investor: 1 Month ($22) 6 Months ($110) 1 Year ($199) Comes with full instructions and strategies for using the reversal levels and MoM indicator in your own trading. This is an honest method with limited risk, not a get rick quick formula. Give it a try.