SlideShare une entreprise Scribd logo
1  sur  24
1
TOPIC:
chi- square test
PRESENTED BY:
MANAS MONDAL
STUDENT OF GLBIMR
2
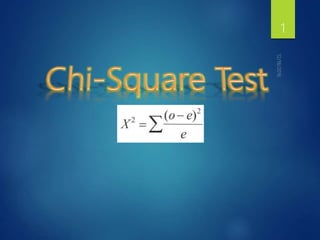
Chi-Square Test
Karl Pearson introduced a
test to distinguish whether an
observed set of frequencies
differs from a specified
frequency distribution
The chi-square test uses
frequency data to generate a
statistic
Karl Pearson
3
• A chi-square test is a statistical test
commonly used for testing independence
and goodness of fit.
• Testing independence determines whether
two or more observations across two
populations are dependent on each other
(that is, whether one variable helps to
estimate the other).
• Testing for goodness of fit determines if an
observed frequency distribution matches a
theoretical frequency distribution.
4
Chi-Square Test
Testing
Independence
Test for Goodness
of Fit
Test for
comparing
variance
Non-ParametricParametric
5
Conditions for the application of 2 test
Observations recorded and collected are
collected on random basis.
All items in the sample must be independent.
No group should contain very few items, say
less than 10. Some statisticians take this
number as 5. But 10 is regarded as better by
most statisticians.
Total number of items should be large, say at
least 50.
6
1. Test for comparing variance
2 =
7
Chi- Square Test as a Non-Parametric Test
Test of Goodness of Fit.
Test of Independence.
 




 

E
EO 2
2 )(

8
 




 

E
EO 2
2 )(

9
2. As a Test of Goodness of Fit
It enables us to see how well does the
assumed theoretical distribution(such as
Binomial distribution, Poisson distribution or
Normal distribution) fit to the observed
data. When the calculated value of χ2 is less
than the table value at certain level of
significance, the fit is considered to be good
one and if the calculated value is greater
than the table value, the fit is not considered
to be good.
10
Example
As personnel director, you
want to test the perception of
fairness of three methods of
performance evaluation. Of
180 employees,
63 rated Method 1 as fair, 45
rated Method 2 as fair, 72
rated Method 3 as fair. At the
0.05 level of significance, is
there a difference in
perceptions?
11
Solution 12
Observed
frequency
Expected
frequency
(O-E) (O-E)2 (O-E)2
E
63 60 3 9 0.15
45 60 -15 225 3.75
72 60 12 144 2.4
6.3
Test Statistic:
Decision:
Conclusion:
At least 1 proportion is different
2 = 6.3
Reject H0 at sign. level 0.05
13H0:
H1:
  =
n1 = n2 = n3 =
Critical Value(s):
20
Reject H0
p1 = p2 = p3 = 1/3
At least 1 is different
0.05
63 45 72
5.991
 = 0.05
Critical values of 2 14
3.As a Test of Independence
χ2 test enables us to explain whether or not
two attributes are associated. Testing
independence determines whether two or more
observations across two populations are
dependent on each other (that is, whether one
variable helps to estimate the other. If the
calculated value is less than the table value at
certain level of significance for a given degree of
freedom, we conclude that null hypotheses stands
which means that two attributes are independent
or not associated. If calculated value is greater
than the table value, we reject the null
hypotheses.
15
Steps involved
Determine The Hypothesis:
Ho : The two variables are independent
Ha : The two variables are associated
Calculate Expected frequency
16
Calculate test statistic
 




 

E
EO 2
2 )(

Determine Degrees of Freedom
df = (R-1)(C-1)
17
Compare computed test statistic
against a tabled/critical value
The computed value of the Pearson chi- square
statistic is compared with the critical value to
determine if the computed value is improbable
The critical tabled values are based on sampling
distributions of the Pearson chi-square statistic.
If calculated 2 is greater than 2 table value,
reject Ho
18
2 Test of Independence
You’re a marketing research analyst. You ask a
random sample of 286 consumers if they
purchase Diet Pepsi or Diet Coke. At the 0.05
level of significance, is there evidence of a
relationship?
19
Diet Pepsi
Diet Coke No Yes Total
No 84 32 116
Yes 48 122 170
Total 132 154 286
Diet Pepsi
No Yes
Diet Coke Obs. Exp. Obs. Exp. Total
No 84 53.5 32 62.5 116
Yes 48 78.5 122 91.5 170
Total 132 132 154 154 286
170·132
286
170·154
286
116·132
286
154·132
286
2 Test of Independence Solution
20
     
     
2
2
all cells
2 2 2
11 11 12 12 22 22
11 12 22
2 2 2
84 53.5 32 62.5 122 91.5
54.29
53.5 62.5 91.5
ij ij
ij
n E
E
n E n E n E
E E E

  
  
   
  
    

2 Test of Independence
Solution*
21
22
 H0:
 H1:
  =
 df =
 Critical Value(s):
Test Statistic:
Decision:
Conclusion:
2 = 54.29
Reject at sign. level 0 .05
20
Reject H0
No Relationship
Relationship
0.05
(2 - 1)(2 - 1) = 1
3.841
 = 0.05 There is evidence of a relationship
23Moral of the Story
Numbers don’t
think - People
do!
24

Contenu connexe

Tendances

Anova (f test) and mean differentiation
Anova (f test) and mean differentiationAnova (f test) and mean differentiation
Anova (f test) and mean differentiationSubramani Parasuraman
 
Standard error-Biostatistics
Standard error-BiostatisticsStandard error-Biostatistics
Standard error-BiostatisticsSudha Rameshwari
 
Research method ch08 statistical methods 2 anova
Research method ch08 statistical methods 2 anovaResearch method ch08 statistical methods 2 anova
Research method ch08 statistical methods 2 anovanaranbatn
 
Regression Analysis
Regression AnalysisRegression Analysis
Regression AnalysisSalim Azad
 
Confidence intervals
Confidence intervalsConfidence intervals
Confidence intervalsTanay Tandon
 
Chi square[1]
Chi square[1]Chi square[1]
Chi square[1]sbarkanic
 
Research methodology chi square test
Research methodology  chi square testResearch methodology  chi square test
Research methodology chi square testPriyadharshiniV11
 
PROCEDURE FOR TESTING HYPOTHESIS
PROCEDURE FOR   TESTING HYPOTHESIS PROCEDURE FOR   TESTING HYPOTHESIS
PROCEDURE FOR TESTING HYPOTHESIS Sundar B N
 
Spearman Rank Correlation Presentation
Spearman Rank Correlation PresentationSpearman Rank Correlation Presentation
Spearman Rank Correlation Presentationcae_021
 
Correlation and regression
Correlation and regressionCorrelation and regression
Correlation and regressionAbdelaziz Tayoun
 
F test and ANOVA
F test and ANOVAF test and ANOVA
F test and ANOVAMEENURANJI
 

Tendances (20)

Anova (f test) and mean differentiation
Anova (f test) and mean differentiationAnova (f test) and mean differentiation
Anova (f test) and mean differentiation
 
Chi square test
Chi square testChi square test
Chi square test
 
Chi square test
Chi square testChi square test
Chi square test
 
Standard error-Biostatistics
Standard error-BiostatisticsStandard error-Biostatistics
Standard error-Biostatistics
 
Research method ch08 statistical methods 2 anova
Research method ch08 statistical methods 2 anovaResearch method ch08 statistical methods 2 anova
Research method ch08 statistical methods 2 anova
 
Regression Analysis
Regression AnalysisRegression Analysis
Regression Analysis
 
Chi -square test
Chi -square testChi -square test
Chi -square test
 
Confidence intervals
Confidence intervalsConfidence intervals
Confidence intervals
 
Test of significance
Test of significanceTest of significance
Test of significance
 
Chi square[1]
Chi square[1]Chi square[1]
Chi square[1]
 
Standard error
Standard error Standard error
Standard error
 
Research methodology chi square test
Research methodology  chi square testResearch methodology  chi square test
Research methodology chi square test
 
PROCEDURE FOR TESTING HYPOTHESIS
PROCEDURE FOR   TESTING HYPOTHESIS PROCEDURE FOR   TESTING HYPOTHESIS
PROCEDURE FOR TESTING HYPOTHESIS
 
Spearman Rank Correlation Presentation
Spearman Rank Correlation PresentationSpearman Rank Correlation Presentation
Spearman Rank Correlation Presentation
 
Anova ppt
Anova pptAnova ppt
Anova ppt
 
Confidence interval
Confidence intervalConfidence interval
Confidence interval
 
Correlation and Regression
Correlation and RegressionCorrelation and Regression
Correlation and Regression
 
Correlation and regression
Correlation and regressionCorrelation and regression
Correlation and regression
 
Goodness of fit (ppt)
Goodness of fit (ppt)Goodness of fit (ppt)
Goodness of fit (ppt)
 
F test and ANOVA
F test and ANOVAF test and ANOVA
F test and ANOVA
 

En vedette

Chi Square Worked Example
Chi Square Worked ExampleChi Square Worked Example
Chi Square Worked ExampleJohn Barlow
 
B.12 chisquare independence 2way
B.12 chisquare independence 2wayB.12 chisquare independence 2way
B.12 chisquare independence 2wayUlster BOCES
 
Hypothesis Testing
Hypothesis TestingHypothesis Testing
Hypothesis Testingrishi.indian
 
Kendall coefficient of concordance
Kendall coefficient of concordance Kendall coefficient of concordance
Kendall coefficient of concordance Zha Jie
 
Hypothesis and its types
Hypothesis and its typesHypothesis and its types
Hypothesis and its typesrajukammari
 
F test Analysis of Variance (ANOVA)
F test Analysis of Variance (ANOVA)F test Analysis of Variance (ANOVA)
F test Analysis of Variance (ANOVA)Marianne Maluyo
 
Ch.13 part 5 tinctures, extracts
Ch.13   part 5 tinctures,  extractsCh.13   part 5 tinctures,  extracts
Ch.13 part 5 tinctures, extractsMalou Mojares
 
Introduction to correlation and regression analysis
Introduction to correlation and regression analysisIntroduction to correlation and regression analysis
Introduction to correlation and regression analysisFarzad Javidanrad
 
determination of sample size
determination of sample sizedetermination of sample size
determination of sample sizeJijo Varghese
 
SAMPLING DESIGN AND STEPS IN SAMPLE DESIGN
SAMPLING DESIGN AND STEPS IN SAMPLE DESIGNSAMPLING DESIGN AND STEPS IN SAMPLE DESIGN
SAMPLING DESIGN AND STEPS IN SAMPLE DESIGNpra098
 

En vedette (20)

Chi square test
Chi square testChi square test
Chi square test
 
Chisquare
ChisquareChisquare
Chisquare
 
Chi square analysis
Chi square analysisChi square analysis
Chi square analysis
 
Chi Square Worked Example
Chi Square Worked ExampleChi Square Worked Example
Chi Square Worked Example
 
Chi – square test
Chi – square testChi – square test
Chi – square test
 
Chi square
Chi squareChi square
Chi square
 
Hypothsis testing
Hypothsis testingHypothsis testing
Hypothsis testing
 
Hypothesis Testing
Hypothesis TestingHypothesis Testing
Hypothesis Testing
 
Hypothesis
HypothesisHypothesis
Hypothesis
 
B.12 chisquare independence 2way
B.12 chisquare independence 2wayB.12 chisquare independence 2way
B.12 chisquare independence 2way
 
Z test, f-test,etc
Z test, f-test,etcZ test, f-test,etc
Z test, f-test,etc
 
Hypothesis Testing
Hypothesis TestingHypothesis Testing
Hypothesis Testing
 
Kendall coefficient of concordance
Kendall coefficient of concordance Kendall coefficient of concordance
Kendall coefficient of concordance
 
Hypothesis and its types
Hypothesis and its typesHypothesis and its types
Hypothesis and its types
 
F test Analysis of Variance (ANOVA)
F test Analysis of Variance (ANOVA)F test Analysis of Variance (ANOVA)
F test Analysis of Variance (ANOVA)
 
Ch.13 part 5 tinctures, extracts
Ch.13   part 5 tinctures,  extractsCh.13   part 5 tinctures,  extracts
Ch.13 part 5 tinctures, extracts
 
Introduction to correlation and regression analysis
Introduction to correlation and regression analysisIntroduction to correlation and regression analysis
Introduction to correlation and regression analysis
 
determination of sample size
determination of sample sizedetermination of sample size
determination of sample size
 
SAMPLING DESIGN AND STEPS IN SAMPLE DESIGN
SAMPLING DESIGN AND STEPS IN SAMPLE DESIGNSAMPLING DESIGN AND STEPS IN SAMPLE DESIGN
SAMPLING DESIGN AND STEPS IN SAMPLE DESIGN
 
Testing of hypothesis
Testing of hypothesisTesting of hypothesis
Testing of hypothesis
 

Similaire à Chisquare Test

Chi-Square Presentation - Nikki.ppt
Chi-Square Presentation - Nikki.pptChi-Square Presentation - Nikki.ppt
Chi-Square Presentation - Nikki.pptBAGARAGAZAROMUALD2
 
Stat 130 chi-square goodnes-of-fit test
Stat 130   chi-square goodnes-of-fit testStat 130   chi-square goodnes-of-fit test
Stat 130 chi-square goodnes-of-fit testAldrin Lozano
 
Chi-square, Yates, Fisher & McNemar
Chi-square, Yates, Fisher & McNemarChi-square, Yates, Fisher & McNemar
Chi-square, Yates, Fisher & McNemarAzmi Mohd Tamil
 
NON-PARAMETRIC TESTS.pptx
NON-PARAMETRIC TESTS.pptxNON-PARAMETRIC TESTS.pptx
NON-PARAMETRIC TESTS.pptxDrLasya
 
Marketing Research Hypothesis Testing.pptx
Marketing Research Hypothesis Testing.pptxMarketing Research Hypothesis Testing.pptx
Marketing Research Hypothesis Testing.pptxxababid981
 
Topic 10 DATA ANALYSIS TECHNIQUES.pptx
Topic 10 DATA ANALYSIS TECHNIQUES.pptxTopic 10 DATA ANALYSIS TECHNIQUES.pptx
Topic 10 DATA ANALYSIS TECHNIQUES.pptxEdwinDagunot4
 
Non parametric study; Statistical approach for med student
Non parametric study; Statistical approach for med student Non parametric study; Statistical approach for med student
Non parametric study; Statistical approach for med student Dr. Rupendra Bharti
 
Chi squared test
Chi squared testChi squared test
Chi squared testvikas232190
 
Test of-significance : Z test , Chi square test
Test of-significance : Z test , Chi square testTest of-significance : Z test , Chi square test
Test of-significance : Z test , Chi square testdr.balan shaikh
 
NON-PARAMETRIC TESTS by Prajakta Sawant
NON-PARAMETRIC TESTS by Prajakta SawantNON-PARAMETRIC TESTS by Prajakta Sawant
NON-PARAMETRIC TESTS by Prajakta SawantPRAJAKTASAWANT33
 
Chi Square Goodness of fit test 2021 (2).pptx
Chi Square Goodness of fit test 2021 (2).pptxChi Square Goodness of fit test 2021 (2).pptx
Chi Square Goodness of fit test 2021 (2).pptxlushomo3
 

Similaire à Chisquare Test (20)

CHI Square
CHI SquareCHI Square
CHI Square
 
Chi sqaure test
Chi sqaure testChi sqaure test
Chi sqaure test
 
Chi-Square Presentation - Nikki.ppt
Chi-Square Presentation - Nikki.pptChi-Square Presentation - Nikki.ppt
Chi-Square Presentation - Nikki.ppt
 
Parametric Statistics
Parametric StatisticsParametric Statistics
Parametric Statistics
 
Stat 130 chi-square goodnes-of-fit test
Stat 130   chi-square goodnes-of-fit testStat 130   chi-square goodnes-of-fit test
Stat 130 chi-square goodnes-of-fit test
 
Goodness of Fit Notation
Goodness of Fit NotationGoodness of Fit Notation
Goodness of Fit Notation
 
Chi-square, Yates, Fisher & McNemar
Chi-square, Yates, Fisher & McNemarChi-square, Yates, Fisher & McNemar
Chi-square, Yates, Fisher & McNemar
 
NON-PARAMETRIC TESTS.pptx
NON-PARAMETRIC TESTS.pptxNON-PARAMETRIC TESTS.pptx
NON-PARAMETRIC TESTS.pptx
 
Hypothesis
HypothesisHypothesis
Hypothesis
 
Marketing Research Hypothesis Testing.pptx
Marketing Research Hypothesis Testing.pptxMarketing Research Hypothesis Testing.pptx
Marketing Research Hypothesis Testing.pptx
 
Hypothesis testing
Hypothesis testingHypothesis testing
Hypothesis testing
 
Testing of Hypothesis.pdf
Testing of Hypothesis.pdfTesting of Hypothesis.pdf
Testing of Hypothesis.pdf
 
Topic 10 DATA ANALYSIS TECHNIQUES.pptx
Topic 10 DATA ANALYSIS TECHNIQUES.pptxTopic 10 DATA ANALYSIS TECHNIQUES.pptx
Topic 10 DATA ANALYSIS TECHNIQUES.pptx
 
Non parametric study; Statistical approach for med student
Non parametric study; Statistical approach for med student Non parametric study; Statistical approach for med student
Non parametric study; Statistical approach for med student
 
Two Variances or Standard Deviations
Two Variances or Standard DeviationsTwo Variances or Standard Deviations
Two Variances or Standard Deviations
 
Chi squared test
Chi squared testChi squared test
Chi squared test
 
Hypothsis testing
Hypothsis testingHypothsis testing
Hypothsis testing
 
Test of-significance : Z test , Chi square test
Test of-significance : Z test , Chi square testTest of-significance : Z test , Chi square test
Test of-significance : Z test , Chi square test
 
NON-PARAMETRIC TESTS by Prajakta Sawant
NON-PARAMETRIC TESTS by Prajakta SawantNON-PARAMETRIC TESTS by Prajakta Sawant
NON-PARAMETRIC TESTS by Prajakta Sawant
 
Chi Square Goodness of fit test 2021 (2).pptx
Chi Square Goodness of fit test 2021 (2).pptxChi Square Goodness of fit test 2021 (2).pptx
Chi Square Goodness of fit test 2021 (2).pptx
 

Dernier

How to Leverage Behavioral Science Insights for Direct Mail Success
How to Leverage Behavioral Science Insights for Direct Mail SuccessHow to Leverage Behavioral Science Insights for Direct Mail Success
How to Leverage Behavioral Science Insights for Direct Mail SuccessAggregage
 
How to utilize calculated properties in your HubSpot setups
How to utilize calculated properties in your HubSpot setupsHow to utilize calculated properties in your HubSpot setups
How to utilize calculated properties in your HubSpot setupsssuser4571da
 
Factors-Influencing-Branding-Strategies.pptx
Factors-Influencing-Branding-Strategies.pptxFactors-Influencing-Branding-Strategies.pptx
Factors-Influencing-Branding-Strategies.pptxVikasTiwari846641
 
Unraveling the Mystery of the Hinterkaifeck Murders.pptx
Unraveling the Mystery of the Hinterkaifeck Murders.pptxUnraveling the Mystery of the Hinterkaifeck Murders.pptx
Unraveling the Mystery of the Hinterkaifeck Murders.pptxelizabethella096
 
Social Media Marketing PPT-Includes Paid media
Social Media Marketing PPT-Includes Paid mediaSocial Media Marketing PPT-Includes Paid media
Social Media Marketing PPT-Includes Paid mediaadityabelde2
 
The+State+of+Careers+In+Retention+Marketing-2.pdf
The+State+of+Careers+In+Retention+Marketing-2.pdfThe+State+of+Careers+In+Retention+Marketing-2.pdf
The+State+of+Careers+In+Retention+Marketing-2.pdfSocial Samosa
 
What is Google Search Console and What is it provide?
What is Google Search Console and What is it provide?What is Google Search Console and What is it provide?
What is Google Search Console and What is it provide?riteshhsociall
 
Uncover Insightful User Journey Secrets Using GA4 Reports
Uncover Insightful User Journey Secrets Using GA4 ReportsUncover Insightful User Journey Secrets Using GA4 Reports
Uncover Insightful User Journey Secrets Using GA4 ReportsVWO
 
Social media, ppt. Features, characteristics
Social media, ppt. Features, characteristicsSocial media, ppt. Features, characteristics
Social media, ppt. Features, characteristicswasim792942
 
CALL ON ➥8923113531 🔝Call Girls Hazratganj Lucknow best sexual service Online
CALL ON ➥8923113531 🔝Call Girls Hazratganj Lucknow best sexual service OnlineCALL ON ➥8923113531 🔝Call Girls Hazratganj Lucknow best sexual service Online
CALL ON ➥8923113531 🔝Call Girls Hazratganj Lucknow best sexual service Onlineanilsa9823
 
Five Essential Tools for International SEO - Natalia Witczyk - SearchNorwich 15
Five Essential Tools for International SEO - Natalia Witczyk - SearchNorwich 15Five Essential Tools for International SEO - Natalia Witczyk - SearchNorwich 15
Five Essential Tools for International SEO - Natalia Witczyk - SearchNorwich 15SearchNorwich
 
Cash payment girl 9257726604 Hand ✋ to Hand over girl
Cash payment girl 9257726604 Hand ✋ to Hand over girlCash payment girl 9257726604 Hand ✋ to Hand over girl
Cash payment girl 9257726604 Hand ✋ to Hand over girlCall girl Jaipur
 
Labour Day Celebrating Workers and Their Contributions.pptx
Labour Day Celebrating Workers and Their Contributions.pptxLabour Day Celebrating Workers and Their Contributions.pptx
Labour Day Celebrating Workers and Their Contributions.pptxelizabethella096
 
Brand experience Dream Center Peoria Presentation.pdf
Brand experience Dream Center Peoria Presentation.pdfBrand experience Dream Center Peoria Presentation.pdf
Brand experience Dream Center Peoria Presentation.pdftbatkhuu1
 
Unraveling the Mystery of The Circleville Letters.pptx
Unraveling the Mystery of The Circleville Letters.pptxUnraveling the Mystery of The Circleville Letters.pptx
Unraveling the Mystery of The Circleville Letters.pptxelizabethella096
 
Enjoy Night⚡Call Girls Dlf City Phase 4 Gurgaon >༒8448380779 Escort Service
Enjoy Night⚡Call Girls Dlf City Phase 4 Gurgaon >༒8448380779 Escort ServiceEnjoy Night⚡Call Girls Dlf City Phase 4 Gurgaon >༒8448380779 Escort Service
Enjoy Night⚡Call Girls Dlf City Phase 4 Gurgaon >༒8448380779 Escort ServiceDelhi Call girls
 

Dernier (20)

How to Leverage Behavioral Science Insights for Direct Mail Success
How to Leverage Behavioral Science Insights for Direct Mail SuccessHow to Leverage Behavioral Science Insights for Direct Mail Success
How to Leverage Behavioral Science Insights for Direct Mail Success
 
How to utilize calculated properties in your HubSpot setups
How to utilize calculated properties in your HubSpot setupsHow to utilize calculated properties in your HubSpot setups
How to utilize calculated properties in your HubSpot setups
 
Factors-Influencing-Branding-Strategies.pptx
Factors-Influencing-Branding-Strategies.pptxFactors-Influencing-Branding-Strategies.pptx
Factors-Influencing-Branding-Strategies.pptx
 
Unraveling the Mystery of the Hinterkaifeck Murders.pptx
Unraveling the Mystery of the Hinterkaifeck Murders.pptxUnraveling the Mystery of the Hinterkaifeck Murders.pptx
Unraveling the Mystery of the Hinterkaifeck Murders.pptx
 
Social Media Marketing PPT-Includes Paid media
Social Media Marketing PPT-Includes Paid mediaSocial Media Marketing PPT-Includes Paid media
Social Media Marketing PPT-Includes Paid media
 
The+State+of+Careers+In+Retention+Marketing-2.pdf
The+State+of+Careers+In+Retention+Marketing-2.pdfThe+State+of+Careers+In+Retention+Marketing-2.pdf
The+State+of+Careers+In+Retention+Marketing-2.pdf
 
What is Google Search Console and What is it provide?
What is Google Search Console and What is it provide?What is Google Search Console and What is it provide?
What is Google Search Console and What is it provide?
 
Uncover Insightful User Journey Secrets Using GA4 Reports
Uncover Insightful User Journey Secrets Using GA4 ReportsUncover Insightful User Journey Secrets Using GA4 Reports
Uncover Insightful User Journey Secrets Using GA4 Reports
 
Social media, ppt. Features, characteristics
Social media, ppt. Features, characteristicsSocial media, ppt. Features, characteristics
Social media, ppt. Features, characteristics
 
CALL ON ➥8923113531 🔝Call Girls Hazratganj Lucknow best sexual service Online
CALL ON ➥8923113531 🔝Call Girls Hazratganj Lucknow best sexual service OnlineCALL ON ➥8923113531 🔝Call Girls Hazratganj Lucknow best sexual service Online
CALL ON ➥8923113531 🔝Call Girls Hazratganj Lucknow best sexual service Online
 
Turn Digital Reputation Threats into Offense Tactics - Daniel Lemin
Turn Digital Reputation Threats into Offense Tactics - Daniel LeminTurn Digital Reputation Threats into Offense Tactics - Daniel Lemin
Turn Digital Reputation Threats into Offense Tactics - Daniel Lemin
 
Five Essential Tools for International SEO - Natalia Witczyk - SearchNorwich 15
Five Essential Tools for International SEO - Natalia Witczyk - SearchNorwich 15Five Essential Tools for International SEO - Natalia Witczyk - SearchNorwich 15
Five Essential Tools for International SEO - Natalia Witczyk - SearchNorwich 15
 
Generative AI Master Class - Generative AI, Unleash Creative Opportunity - Pe...
Generative AI Master Class - Generative AI, Unleash Creative Opportunity - Pe...Generative AI Master Class - Generative AI, Unleash Creative Opportunity - Pe...
Generative AI Master Class - Generative AI, Unleash Creative Opportunity - Pe...
 
Cash payment girl 9257726604 Hand ✋ to Hand over girl
Cash payment girl 9257726604 Hand ✋ to Hand over girlCash payment girl 9257726604 Hand ✋ to Hand over girl
Cash payment girl 9257726604 Hand ✋ to Hand over girl
 
Labour Day Celebrating Workers and Their Contributions.pptx
Labour Day Celebrating Workers and Their Contributions.pptxLabour Day Celebrating Workers and Their Contributions.pptx
Labour Day Celebrating Workers and Their Contributions.pptx
 
Brand experience Dream Center Peoria Presentation.pdf
Brand experience Dream Center Peoria Presentation.pdfBrand experience Dream Center Peoria Presentation.pdf
Brand experience Dream Center Peoria Presentation.pdf
 
Unraveling the Mystery of The Circleville Letters.pptx
Unraveling the Mystery of The Circleville Letters.pptxUnraveling the Mystery of The Circleville Letters.pptx
Unraveling the Mystery of The Circleville Letters.pptx
 
Enjoy Night⚡Call Girls Dlf City Phase 4 Gurgaon >༒8448380779 Escort Service
Enjoy Night⚡Call Girls Dlf City Phase 4 Gurgaon >༒8448380779 Escort ServiceEnjoy Night⚡Call Girls Dlf City Phase 4 Gurgaon >༒8448380779 Escort Service
Enjoy Night⚡Call Girls Dlf City Phase 4 Gurgaon >༒8448380779 Escort Service
 
How to Create a Social Media Plan Like a Pro - Jordan Scheltgen
How to Create a Social Media Plan Like a Pro - Jordan ScheltgenHow to Create a Social Media Plan Like a Pro - Jordan Scheltgen
How to Create a Social Media Plan Like a Pro - Jordan Scheltgen
 
SEO Master Class - Steve Wiideman, Wiideman Consulting Group
SEO Master Class - Steve Wiideman, Wiideman Consulting GroupSEO Master Class - Steve Wiideman, Wiideman Consulting Group
SEO Master Class - Steve Wiideman, Wiideman Consulting Group
 

Chisquare Test

  • 1. 1
  • 2. TOPIC: chi- square test PRESENTED BY: MANAS MONDAL STUDENT OF GLBIMR 2
  • 3. Chi-Square Test Karl Pearson introduced a test to distinguish whether an observed set of frequencies differs from a specified frequency distribution The chi-square test uses frequency data to generate a statistic Karl Pearson 3
  • 4. • A chi-square test is a statistical test commonly used for testing independence and goodness of fit. • Testing independence determines whether two or more observations across two populations are dependent on each other (that is, whether one variable helps to estimate the other). • Testing for goodness of fit determines if an observed frequency distribution matches a theoretical frequency distribution. 4
  • 5. Chi-Square Test Testing Independence Test for Goodness of Fit Test for comparing variance Non-ParametricParametric 5
  • 6. Conditions for the application of 2 test Observations recorded and collected are collected on random basis. All items in the sample must be independent. No group should contain very few items, say less than 10. Some statisticians take this number as 5. But 10 is regarded as better by most statisticians. Total number of items should be large, say at least 50. 6
  • 7. 1. Test for comparing variance 2 = 7
  • 8. Chi- Square Test as a Non-Parametric Test Test of Goodness of Fit. Test of Independence.          E EO 2 2 )(  8
  • 10. 2. As a Test of Goodness of Fit It enables us to see how well does the assumed theoretical distribution(such as Binomial distribution, Poisson distribution or Normal distribution) fit to the observed data. When the calculated value of χ2 is less than the table value at certain level of significance, the fit is considered to be good one and if the calculated value is greater than the table value, the fit is not considered to be good. 10
  • 11. Example As personnel director, you want to test the perception of fairness of three methods of performance evaluation. Of 180 employees, 63 rated Method 1 as fair, 45 rated Method 2 as fair, 72 rated Method 3 as fair. At the 0.05 level of significance, is there a difference in perceptions? 11
  • 12. Solution 12 Observed frequency Expected frequency (O-E) (O-E)2 (O-E)2 E 63 60 3 9 0.15 45 60 -15 225 3.75 72 60 12 144 2.4 6.3
  • 13. Test Statistic: Decision: Conclusion: At least 1 proportion is different 2 = 6.3 Reject H0 at sign. level 0.05 13H0: H1:   = n1 = n2 = n3 = Critical Value(s): 20 Reject H0 p1 = p2 = p3 = 1/3 At least 1 is different 0.05 63 45 72 5.991  = 0.05
  • 15. 3.As a Test of Independence χ2 test enables us to explain whether or not two attributes are associated. Testing independence determines whether two or more observations across two populations are dependent on each other (that is, whether one variable helps to estimate the other. If the calculated value is less than the table value at certain level of significance for a given degree of freedom, we conclude that null hypotheses stands which means that two attributes are independent or not associated. If calculated value is greater than the table value, we reject the null hypotheses. 15
  • 16. Steps involved Determine The Hypothesis: Ho : The two variables are independent Ha : The two variables are associated Calculate Expected frequency 16
  • 17. Calculate test statistic          E EO 2 2 )(  Determine Degrees of Freedom df = (R-1)(C-1) 17
  • 18. Compare computed test statistic against a tabled/critical value The computed value of the Pearson chi- square statistic is compared with the critical value to determine if the computed value is improbable The critical tabled values are based on sampling distributions of the Pearson chi-square statistic. If calculated 2 is greater than 2 table value, reject Ho 18
  • 19. 2 Test of Independence You’re a marketing research analyst. You ask a random sample of 286 consumers if they purchase Diet Pepsi or Diet Coke. At the 0.05 level of significance, is there evidence of a relationship? 19 Diet Pepsi Diet Coke No Yes Total No 84 32 116 Yes 48 122 170 Total 132 154 286
  • 20. Diet Pepsi No Yes Diet Coke Obs. Exp. Obs. Exp. Total No 84 53.5 32 62.5 116 Yes 48 78.5 122 91.5 170 Total 132 132 154 154 286 170·132 286 170·154 286 116·132 286 154·132 286 2 Test of Independence Solution 20
  • 21.             2 2 all cells 2 2 2 11 11 12 12 22 22 11 12 22 2 2 2 84 53.5 32 62.5 122 91.5 54.29 53.5 62.5 91.5 ij ij ij n E E n E n E n E E E E                     2 Test of Independence Solution* 21
  • 22. 22  H0:  H1:   =  df =  Critical Value(s): Test Statistic: Decision: Conclusion: 2 = 54.29 Reject at sign. level 0 .05 20 Reject H0 No Relationship Relationship 0.05 (2 - 1)(2 - 1) = 1 3.841  = 0.05 There is evidence of a relationship
  • 23. 23Moral of the Story Numbers don’t think - People do!
  • 24. 24

Notes de l'éditeur

  1. 10
  2. 12
  3. 11
  4. 44
  5. 45
  6. 12
  7. 47
  8. 51