SlideShare une entreprise Scribd logo
1  sur  43
MLSListings Inc Confidential Copyright 2015 1
Market Snapshot – May 2015 vs. May 2014
* Inventory defined as the total of Active + Pending + Contingent Listings
May
2015
May
2014
%
Change
May
2015
May
2014
%
Change
May
2015
May
2014
%
Change
May
2015
May
2014
%
Change
May
2015
May
2014
%
Change
May
2015
May
2014
%
Change
May
2015
May
2014
%
Change
Monterey 919 932 -1% 212 242 -12% $539,500 $462,500 17% $862,890 $811,576 6% $182,932,721 $196,401,438 -7% 63 61 3% 315 291 8%
San Benito 138 157 -12% 47 48 -2% $444,985 $417,500 7% $496,281 $454,229 9% $23,325,185 $21,803,003 7% 37 44 -16% 62 60 3%
San Mateo 825 763 8% 380 421 -10% $1,347,500 $1,126,500 20% $1,720,450 $1,520,146 13% $653,771,131 $638,461,458 2% 18 30 -40% 498 619 -20%
Santa Clara 2343 1779 32% 1006 990 2% $997,500 $888,888 12% $1,304,465 $1,180,399 11% $1,312,291,582 $1,166,234,750 13% 20 23 -13% 1388 1449 -4%
Santa Cruz 632 622 2% 180 161 12% $695,000 $684,000 2% $796,541 $802,707 -1% $143,377,298 $129,235,842 11% 48 50 -4% 286 262 9%
* Inventory defined as the total of Active + Pending + Contingent Listings
May
2015
May
2014
%
Change
May
2015
May
2014
%
Change
May
2015
May
2014
%
Change
May
2015
May
2014
%
Change
May
2015
May
2014
%
Change
May
2015
May
2014
%
Change
May
2015
May
2014
%
Change
Monterey 104 93 12% 30 31 -3% $472,500 $415,000 14% $487,842 $435,429 12% $14,635,250 $13,498,325 8% 56 40 40% 32 31 3%
San Benito 4 8 -50% 1 6 -83% $375,000 $313,000 20% $375,000 $299,609 25% $375,000 $1,797,658 -79% 56 31 81% 3 5 -40%
San Mateo 230 181 27% 112 132 -15% $722,500 $635,000 14% $770,819 $645,586 19% $86,331,688 $85,217,443 1% 15 19 -21% 148 187 -21%
Santa Clara 733 605 21% 388 413 -6% $617,500 $545,000 13% $676,690 $591,304 14% $262,555,788 $244,208,579 8% 15 19 -21% 502 557 -10%
Santa Cruz 141 137 3% 51 40 28% $475,000 $397,750 19% $493,368 $461,260 7% $25,161,784 $18,450,400 36% 25 46 -46% 64 59 8%
Single Family - May 2015 vs. May 2014
County
Inventory * Closed Sales Median Price Average Price Total Dollars Days on Market New Listings
Condo/Townhouse - May 2015 vs. May 2014
County
Inventory Closed Sales Median Price Average Price Total Dollars Days on Market New Listings
MLSListings Inc Confidential Copyright 2015 2
Market Snapshot – May 2015 vs. Apr 2015
* Inventory defined as the total of Active + Pending + Contingent Listings
Apr
2015
May
2015
%
Change
Apr
2015
May
2015
%
Change
Apr
2015
May
2015
%
Change
Apr
2015
May
2015
%
Change
Apr
2015
May
2015
%
Change
Apr
2015
May
2015
%
Change
Apr
2015
May
2015
%
Change
Monterey 924 919 -1% 217 212 -2% $460,000 $539,500 17% $698,799 $862,890 23% $151,639,388 $182,932,721 21% 76 63 -17% 316 315 0%
San Benito 142 138 -3% 50 47 -6% $465,000 $444,985 -4% $480,364 $496,281 3% $24,018,209 $23,325,185 -3% 49 37 -24% 60 62 3%
San Mateo 860 825 -4% 413 380 -8% $1,285,000 $1,347,500 5% $1,625,986 $1,720,450 6% $673,158,037 $653,771,131 -3% 23 18 -22% 523 498 -5%
Santa Clara 2264 2343 3% 1074 1006 -6% $965,500 $997,500 3% $1,272,633 $1,304,465 3% $1,366,807,587 $1,312,291,582 -4% 24 20 -17% 1399 1388 -1%
Santa Cruz 578 632 9% 172 180 5% $760,000 $695,000 -9% $840,578 $796,541 -5% $144,579,485 $143,377,298 -1% 50 48 -4% 271 286 6%
* Inventory defined as the total of Active + Pending + Contingent Listings
Apr
2015
May
2015
%
Change
Apr
2015
May
2015
%
Change
Apr
2015
May
2015
%
Change
Apr
2015
May
2015
%
Change
Apr
2015
May
2015
%
Change
Apr
2015
May
2015
%
Change
Apr
2015
May
2015
%
Change
Monterey 103 104 1% 20 30 50% $385,000 $472,500 23% $457,075 $487,842 7% $9,141,500 $14,635,250 60% 73 56 -23% 38 32 -16%
San Benito 3 4 33% 12 1 -92% $293,500 $375,000 28% $313,608 $375,000 20% $3,763,300 $375,000 -90% 61 56 -8% 1 3 200%
San Mateo 212 230 8% 140 112 -20% $657,750 $722,500 10% $726,436 $770,819 6% $101,701,100 $86,331,688 -15% 17 15 -12% 139 148 6%
Santa Clara 716 733 2% 378 388 3% $572,500 $617,500 8% $648,036 $676,690 4% $244,957,458 $262,555,788 7% 18 15 -17% 519 502 -3%
Santa Cruz 142 141 -1% 51 51 0% $445,000 $475,000 7% $538,937 $493,368 -8% $27,485,799 $25,161,784 -8% 82 25 -70% 58 64 10%
Single Family - Current Month vs. Prior Month - May 2015 vs. April 2015
County
Inventory Closed Sales Median Price Average Price Total Dollars Days on Market New Listings
Condo/Townhouse - Current Month vs. Prior Month - May 2015 vs. April 2015
County
Inventory Closed Sales Median Price Average Price Total Dollars Days on Market New Listings
MLSListings Inc Confidential Copyright 2015 3
3
Single Family+Condo/Townhouse Inventory, Closed Sales, New Listings - Home Counties
Jan ’03 – May ’15
MLSListings Inc Confidential Copyright 2015 4
4
Single Family + Condo/Townhouse Inventory - Home Counties
Jan ’03 – May ’15
MLSListings Inc Confidential Copyright 2015 5
5
Single Family + Condo/Townhouse Inventory - Home Counties
Jan ’05 – May ’15
2005 2006 2007 2008 2009 2010 2011 2012 2013 2014 2015
Jan 4223 7295 8588 12447 12693 8558 10330 8140 3179 3578 4175
Feb 4839 8023 9184 13528 13079 9650 10803 8231 4296 3924 3932
Mar 5502 8827 10357 14355 13240 10910 11127 7991 4286 4322 5515
Apr 6434 9722 11812 15513 12806 11773 11506 7630 4765 4776 5944
May 7020 10819 12923 15787 11749 11903 11730 7712 5222 3520 6069
Jun 7189 11493 13287 15802 11104 12691 11740 7570 5616 5322
Jul 7878 12317 13910 15948 10763 13016 11372 7306 5950 4389
Aug 8030 12122 14275 15356 10044 13072 11201 7116 5850 5378
Sep 8798 12239 13943 15192 9823 13294 10944 6523 5806 5290
Oct 8946 11490 14020 15070 9295 12440 10241 6173 5384 4863
Nov 8252 9968 13308 13849 8724 11500 9482 5292 4592 3925
Dec 6372 7874 11420 12221 7778 9825 7790 3901 3198 3174
May '05 7020
May '06 10819
May '07 12923
May '08 15787
May '09 11749
May '10 11903
May '11 11730
May '12 7712
May '13 5222
May '14 3520
May '15 6069
Home Counties - Single Family + Condo/Townhouse Inventory
Variance to
prior Years
Home Counties
Inventory
-13.5%
-43.9%
-53.0%
-61.6%
-48.3%
-49.0%
-48.3%
-21.3%
16.2%
72.4%
0
2000
4000
6000
8000
10000
12000
14000
16000
May
'05
May
'06
May
'07
May
'08
May
'09
May
'10
May
'11
May
'12
May
'13
May
'14
May
'15
15787
6069
MLSListings Inc Confidential Copyright 2015 6
6
Single Family Inventory - Home Counties
Jan ’04 – May ’15
MLSListings Inc Confidential Copyright 2015 7
7
Single Family Inventory - Home Counties
May (2004 – 2015)
MLSListings Inc Confidential Copyright 2015 8
8
Single Family Inventory - Home Counties
May (2004 – 2015)
Monterey
County
San Benito
County
San Mateo
County
Santa Clara
County
Santa Cruz
County
May '04 973 -5.5% 196 -29.6% 1148 -28.1% 3521 -33.5% 850 -25.6%
May '05 1143 -19.6% 173 -20.2% 1014 -18.6% 2827 -17.1% 675 -6.4%
May '06 2253 -59.2% 351 -60.7% 1367 -39.6% 3542 -33.9% 1121 -43.6%
May '07 2711 -66.1% 486 -71.6% 1484 -44.4% 4323 -45.8% 1218 -48.1%
May '08 2725 -66.3% 580 -76.2% 1918 -57.0% 6130 -61.8% 1252 -49.5%
May '09 1906 -51.8% 266 -48.1% 1619 -49.0% 4445 -47.3% 994 -36.4%
May '10 1763 -47.9% 272 -49.3% 1836 -55.1% 4155 -43.6% 1018 -37.9%
May '11 1653 -44.4% 287 -51.9% 1853 -55.5% 4148 -43.5% 982 -35.6%
May '12 1211 -24.1% 193 -28.5% 1195 -31.0% 2620 -10.6% 811 -22.1%
May '13 897 2.5% 120 15.0% 814 1.4% 1750 33.9% 613 3.1%
May '14 932 -1.4% 157 -12.1% 763 8.1% 1779 31.7% 622 1.6%
May '15 919 138 825 2343 632
Home Counties - Single Family Inventory (2015 vs. Prior Years)
MLSListings Inc Confidential Copyright 2015 9
9
Single Family Months of Inventory – San Mateo, Santa Clara, Santa Cruz
Mar ’03 – May ’15 (Rolling Three Month Average)
MLSListings Inc Confidential Copyright 2015 10
10
Single Family Months of Inventory – Monterey and San Benito Counties
Mar ’03 – May ’15 (Rolling Three Month Average)
MLSListings Inc Confidential Copyright 2015 11
11
Single Family Market Outlook – Home Counties
May ’14 vs. May ’15
MLSListings Inc Confidential Copyright 2015 12
12
Single Family + Condo/Townhouse Closed Sales – Home Counties
Jan ’03 – May ’15
MLSListings Inc Confidential Copyright 2015 13
13
Single Family + Condo/Townhouse Closed Sales - Home Counties
Jan ’05 – May ’15
2005 2006 2007 2008 2009 2010 2011 2012 2013 2014 2015
Jan 2078 1638 1539 877 1390 1529 1574 1552 1460 1330 1182
Feb 2048 1762 1658 1063 1497 1537 1648 1785 1597 1371 921
Mar 3210 2775 2248 1388 1916 2197 2399 2520 2289 1882 2068
Apr 3407 2595 2101 1664 2158 2245 2329 2517 2468 2402 2527
May 3376 2706 2270 1953 2355 2805 2369 2885 2780 2484 2407
Jun 3836 2847 2353 2123 2808 2592 2633 2639 2543 2456
Jul 3396 2446 2136 2230 2788 2299 2238 2457 2643 1933
Aug 3538 2668 1962 2244 2421 2196 2446 2525 2559 2255
Sep 3312 2186 1223 2127 2503 2037 2144 2194 2258 2270
Oct 2881 2219 1426 2114 2577 1994 2008 2456 2404 2312
Nov 2667 2182 1328 1594 2138 1930 2038 2273 1899 1787
Dec 2408 2066 1201 1810 2325 2234 2201 2230 1859 1371
May '05 3376
May '06 2706
May '07 2270
May '08 1953
May '09 2355
May '10 2805
May '11 2369
May '12 2885
May '13 2780
May '14 2484
May '15 2407
Home Counties - Single Family + Condo/Townhouse Closed Sales
-14.2%
1.6%
-16.6%
-13.4%
-28.7%
-11.0%
6.0%
23.2%
-3.1%
2.2%
Home Counties
Closed Sales
Variance to
prior Years
0
500
1000
1500
2000
2500
3000
3500
May
'05
May
'06
May
'07
May
'08
May
'09
May
'10
May
'11
May
'12
May
'13
May
'14
May
'15
3376
2407
MLSListings Inc Confidential Copyright 2015 14
14
Single Family Closed Sales – San Mateo, Santa Clara Counties
Jan ’04 – May ’15
MLSListings Inc Confidential Copyright 2015 15
15
Single Family Closed Sales – San Mateo, Santa Clara Counties
May (2004 – 2015)
MLSListings Inc Confidential Copyright 2015 16
16
Single Family Closed Sales – Monterey, San Benito, Santa Cruz Counties
Jan ’04 – May ’15
MLSListings Inc Confidential Copyright 2015 17
17
Single Family Closed Sales – Monterey, San Benito, Santa Cruz Counties
May (2004 – 2015)
MLSListings Inc Confidential Copyright 2015 18
18
Single Family Closed Sales – Home Counties
May (2004 – 2015)
Monterey
County
San Benito
County
San Mateo
County
Santa Clara
County
Santa Cruz
County
May '04 309 -31.4% 74 -36.5% 575 -33.9% 1670 -39.8% 247 -27.1%
May '05 295 -28.1% 67 -29.9% 505 -24.8% 1419 -29.1% 197 -8.6%
May '06 201 5.5% 50 -6.0% 470 -19.1% 1098 -8.4% 193 -6.7%
May '07 135 57.0% 34 38.2% 432 -12.0% 992 1.4% 149 20.8%
May '08 186 14.0% 36 30.6% 354 7.3% 874 15.1% 124 45.2%
May '09 372 -43.0% 70 -32.9% 321 18.4% 987 1.9% 139 29.5%
May '10 306 -30.7% 63 -25.4% 418 -9.1% 1230 -18.2% 162 11.1%
May '11 259 -18.1% 58 -19.0% 418 -9.1% 966 4.1% 137 31.4%
May '12 284 -25.4% 62 -24.2% 490 -22.4% 1209 -16.8% 208 -13.5%
May '13 237 -10.5% 54 -13.0% 512 -25.8% 1099 -8.5% 221 -18.6%
May '14 242 -12.4% 48 -2.1% 421 -9.7% 990 1.6% 161 11.8%
May '15 212 47 380 1006 180
Home Counties - Single Family Sales (2015 vs. Prior Years)
MLSListings Inc Confidential Copyright 2015 19
19
Single Family Total Sales Dollars – San Mateo and Santa Clara Counties
Jan ’04 – May ’15
MLSListings Inc Confidential Copyright 2015 20
20
Single Family Total Sales Dollars – San Mateo, Santa Clara Counties
May (2004 – 2015)
MLSListings Inc Confidential Copyright 2015 21
21
Single Family Total Sales Dollars – Santa Cruz, Monterey, and San Benito Counties
Jan ’04 – May ’15
MLSListings Inc Confidential Copyright 2015 22
22
Single Family Total Sales Dollars – Monterey, San Benito, Santa Cruz
Counties
May (2004 – 2015)
MLSListings Inc Confidential Copyright 2015 23
23
Single Family Total Sales Volume – Home Counties
May (2004 – 2015)
Monterey
County
San Benito
County
San Mateo
County
Santa Clara
County
Santa Cruz
County
May '04 $231,738,318 -21.1% $39,918,000 -41.6% $568,750,622 14.9% $1,283,573,863 2.2% $170,897,628 -16.1%
May '05 $228,834,806 -20.1% $46,220,754 -49.5% $586,833,027 11.4% $1,263,473,261 3.9% $175,537,232 -18.3%
May '06 $221,235,921 -17.3% $35,638,300 -34.6% $483,702,130 35.2% $1,072,163,192 22.4% $140,553,527 2.0%
May '07 $130,310,355 40.4% $24,732,263 -5.7% $513,813,341 27.2% $1,087,982,293 20.6% $122,673,098 16.9%
May '08 $183,711,226 -0.4% $12,604,400 85.1% $419,505,295 55.8% $851,301,713 54.2% $89,951,337 59.4%
May '09 $129,899,807 40.8% $20,337,898 14.7% $299,717,071 118.1% $635,442,293 106.5% $69,028,368 107.7%
May '10 $163,708,485 11.7% $20,340,913 14.7% $404,254,657 61.7% $940,775,874 39.5% $90,987,185 57.6%
May '11 $129,875,961 40.9% $18,666,700 25.0% $429,661,754 52.2% $745,902,666 75.9% $74,240,928 93.1%
May '12 $122,874,617 48.9% $20,157,401 15.7% $506,889,662 29.0% $1,005,265,206 30.5% $115,591,563 24.0%
May '13 $117,279,111 56.0% $19,993,223 16.7% $632,926,931 3.3% $1,145,977,345 14.5% $143,195,455 0.1%
May '14 $145,628,533 25.6% $21,803,003 7.0% $638,461,458 2.4% $1,166,234,750 12.5% $129,235,842 10.9%
May '15 $182,932,721 $23,325,185 $653,771,131 $1,312,291,582 $143,377,298
Home Counties - Single Family Total Sales Dollars (2015 vs. Prior Years)
MLSListings Inc Confidential Copyright 2015 24
24
Single Family + Condo/Townhouse New Listings - Home Counties
Jan ’03 – May ’15
MLSListings Inc Confidential Copyright 2015 25
25
Single Family + Condo/Townhouse New Listings - Home Counties
Jan ’05 – May ’15
2005 2006 2007 2008 2009 2010 2011 2012 2013 2014 2015
Jan 3291 4061 3519 3947 3907 3334 3380 2890 2170 2164 1727
Feb 3561 4080 3508 4353 3867 3711 3373 3011 2534 2496 1616
Mar 4912 5140 4828 4785 4397 4649 3953 3313 3011 3081 3129
Apr 5359 4787 4745 5185 3909 4613 3916 3151 3499 3380 3324
May 5224 6019 5279 4934 3636 4044 3986 3551 3592 3520 3298
Jun 5392 6152 4894 4840 3820 4423 3784 3132 3358 3209
Jul 5210 5523 4747 4530 3915 4089 3429 3096 3529 2420
Aug 5450 5356 4720 4344 3612 3867 3342 2941 3163 2850
Sep 5544 4810 4143 4632 3608 3726 3095 2619 3016 2924
Oct 5106 3763 4202 4468 3480 3267 2988 2732 2650 2497
Nov 3648 2646 3034 3098 2700 2657 2355 1923 1774 1531
Dec 1929 1666 2223 2656 2219 2088 1724 1237 1113 705
May '05 5224
May '06 6019
May '07 5279
May '08 4934
May '09 3636
May '10 4044
May '11 3986
May '12 3551
May '13 3592
May '14 3520
May '15 3298
Home Counties - Single Family + Condo/Townhouse New Listings
-6.3%
-9.3%
-18.4%
Variance to
prior Years
Home Counties
New Listings
-36.9%
-17.3%
-7.1%
-8.2%
-45.2%
-37.5%
-33.2%
0
500
1000
1500
2000
2500
3000
3500
4000
4500
5000
May
'05
May
'06
May
'07
May
'08
May
'09
May
'10
May
'11
May
'12
May
'13
May
'14
May
'15
6019
3298
MLSListings Inc Confidential Copyright 2015 26
26
Single Family New Listings - Home Counties
Jan ’04 – May ’15
MLSListings Inc Confidential Copyright 2015 27
27
Single Family New Listings - Home Counties
May (2004 – 2015)
MLSListings Inc Confidential Copyright 2015 28
28
Single Family New Listings - Home Counties
May (2004 – 2015)
Monterey
County
San Benito
County
San Mateo
County
Santa Clara
County
Santa Cruz
County
May '04 458 -31.2% 93 -33.3% 853 -41.6% 2566 -45.9% 406 -29.6%
May '05 478 -34.1% 108 -42.6% 809 -38.4% 2334 -40.5% 348 -17.8%
May '06 695 -54.7% 143 -56.6% 859 -42.0% 2471 -43.8% 505 -43.4%
May '07 658 -52.1% 111 -44.1% 744 -33.1% 2131 -34.9% 386 -25.9%
May '08 580 -45.7% 129 -51.9% 789 -36.9% 2124 -34.7% 321 -10.9%
May '09 487 -35.3% 83 -25.3% 568 -12.3% 1514 -8.3% 258 10.9%
May '10 524 -39.9% 65 -4.6% 665 -25.1% 1639 -15.3% 292 -2.1%
May '11 443 -28.9% 77 -19.5% 672 -25.9% 1629 -14.8% 297 -3.7%
May '12 364 -13.5% 61 1.6% 643 -22.6% 1494 -7.1% 264 8.3%
May '13 331 -4.8% 49 26.5% 632 -21.2% 1491 -6.9% 266 7.5%
May '14 291 8.2% 60 3.3% 619 -19.5% 1449 -4.2% 262 9.2%
May '15 315 62 498 1388 286
Home Counties - Single Family New Listings (2015 vs. Prior Years)
MLSListings Inc Confidential Copyright 2015 29
29
Single Family + Condo/Townhouse Median Price - Home Counties
Jan ’05 – May ’15
2005 2006 2007 2008 2009 2010 2011 2012 2013 2014 2015
Jan $625,000 $695,000 $699,000 $660,000 $380,000 $450,000 $435,500 $415,000 $540,000 $640,000 $683,000
Feb $651,000 $699,950 $705,000 $680,000 $381,000 $465,400 $420,000 $438,875 $555,000 $668,000 $823,188
Mar $669,000 $707,000 $740,000 $677,750 $369,000 $499,900 $460,000 $475,000 $615,000 $729,000 $840,000
Apr $685,000 $704,865 $775,000 $655,000 $404,000 $500,000 $480,000 $502,500 $676,250 $735,000 $825,000
May $685,000 $725,000 $775,000 $650,000 $415,000 $522,500 $477,750 $527,500 $688,945 $748,500 $850,000
Jun $708,000 $740,000 $768,500 $639,000 $460,000 $525,500 $515,000 $559,000 $670,000 $765,000
Jul $700,000 $725,000 $759,975 $595,000 $487,750 $535,000 $484,500 $565,000 $692,000 $718,000
Aug $710,000 $720,000 $761,000 $545,445 $476,000 $510,500 $490,000 $560,000 $670,000 $738,000
Sep $695,000 $715,000 $750,000 $490,000 $469,825 $500,000 $465,000 $560,000 $670,000 $730,000
Oct $699,000 $711,500 $758,000 $477,200 $487,944 $500,000 $455,000 $567,000 $668,150 $750,000
Nov $700,000 $709,000 $750,000 $435,000 $500,000 $492,000 $437,500 $565,000 $659,250 $745,000
Dec $690,500 $695,000 $702,900 $410,000 $480,000 $463,750 $440,000 $563,000 $655,000 $801,000
May '05 $685,000
May '06 $725,000
May '07 $775,000
May '08 $650,000
May '09 $415,000
May '10 $522,500
May '11 $477,750
May '12 $527,500
May '13 $688,945
May '14 $748,500
May '15 $850,000
Home Counties - Single Family + Condo/Townhouse Median Price
13.6%
Home Counties
Median Price
Variance to
prior Years
24.1%
17.2%
61.1%
23.4%
9.7%
30.8%
104.8%
62.7%
77.9%
$0
$200,000
$400,000
$600,000
$800,000
$1,000,000
May
'05
May
'06
May
'07
May
'08
May
'09
May
'10
May
'11
May
'12
May
'13
May
'14
May
'15
$775,000
$850,000
MLSListings Inc Confidential Copyright 2015 30
30
Single Family Median Prices - Home Counties
Jan ’04 – May ’15
MLSListings Inc Confidential Copyright 2015 31
31
Single Family Median Prices - Home Counties
May (2004 – 2015)
MLSListings Inc Confidential Copyright 2015 32
32
Single Family Median Prices - Home Counties
May (2004 – 2015)
Monterey
County
San Benito
County
San Mateo
County
Santa Clara
County
Santa Cruz
County
May '04 $569,000 -5.2% $474,000 -6.1% $775,000 73.9% $635,000 57.1% $639,000 8.8%
May '05 $639,000 -15.6% $635,000 -29.9% $900,000 49.7% $749,000 33.2% $757,200 -8.2%
May '06 $685,000 -21.2% $635,000 -29.9% $905,000 48.9% $800,000 24.7% $755,000 -7.9%
May '07 $695,000 -22.4% $625,000 -28.8% $952,000 41.5% $858,000 16.3% $779,000 -10.8%
May '08 $360,000 49.9% $332,500 33.8% $852,500 58.1% $772,500 29.1% $625,000 11.2%
May '09 $204,950 163.2% $253,329 75.7% $728,000 85.1% $490,000 103.6% $450,000 54.4%
May '10 $281,000 92.0% $295,000 50.8% $750,000 79.7% $630,000 58.3% $523,000 32.9%
May '11 $252,000 114.1% $277,500 60.4% $825,000 63.3% $602,500 65.6% $437,500 58.9%
May '12 $300,000 79.8% $275,000 61.8% $776,500 73.5% $645,783 54.5% $499,500 39.1%
May '13 $410,000 31.6% $355,000 25.3% $957,000 40.8% $825,000 20.9% $625,000 11.2%
May '14 $462,500 16.6% $417,500 6.6% $1,126,500 19.6% $888,888 12.2% $684,000 1.6%
May '15 $539,500 $444,985 $1,347,500 $997,500 $695,000
Home Counties - Single Family Median Price (2015 vs. Prior Years)
MLSListings Inc Confidential Copyright 2015 33
33
Single Family Average Price - Home Counties
Jan ’04 – May ’15
MLSListings Inc Confidential Copyright 2015 34
34
Single Family Average Price - Home Counties
May (2004 – 2015)
MLSListings Inc Confidential Copyright 2015 35
35
Single Family Average Price - Home Counties
May (2004 – 2015)
Monterey
County
San Benito
County
San Mateo
County
Santa Clara
County
Santa Cruz
County
May '04 $749,962 15.1% $539,432 -8.0% $989,132 73.9% $768,607 69.7% $691,893 15.1%
May '05 $775,711 11.2% $689,862 -28.1% $1,162,046 48.1% $890,397 46.5% $891,052 -10.6%
May '06 $817,340 5.6% $701,530 -29.3% $1,225,530 40.4% $965,495 35.1% $846,921 -5.9%
May '07 $965,262 -10.6% $727,420 -31.8% $1,189,383 44.7% $1,096,756 18.9% $823,309 -3.3%
May '08 $552,901 56.1% $350,122 41.7% $1,185,043 45.2% $976,263 33.6% $731,311 8.9%
May '09 $283,216 204.7% $290,541 70.8% $933,698 84.3% $645,774 102.0% $496,606 60.4%
May '10 $526,964 63.7% $322,871 53.7% $969,435 77.5% $764,858 70.5% $561,649 41.8%
May '11 $364,968 136.4% $321,839 54.2% $1,040,343 65.4% $773,757 68.6% $541,904 47.0%
May '12 $494,505 74.5% $325,119 52.6% $1,038,708 65.6% $832,173 56.8% $530,232 50.2%
May '13 $669,437 28.9% $370,244 34.0% $1,243,471 38.4% $1,044,646 24.9% $647,943 22.9%
May '14 $811,576 6.3% $454,229 9.3% $1,520,146 13.2% $1,180,399 10.5% $802,707 -0.8%
May '15 $862,890 $496,281 $1,720,450 $1,304,465 $796,541
Home Counties - Single Family Average Price (2015 vs. Prior Years)
MLSListings Inc Confidential Copyright 2015 36
36
Condo/Townhouse Market Outlook – Home Counties
May ’14 vs. May ’15
MLSListings Inc Confidential Copyright 2015 37
37
Condo/Townhouse Total Sales Dollars – San Mateo and Santa Clara Counties
Jan ’04 – May ’15
MLSListings Inc Confidential Copyright 2015 38
38
Condo/Townhouse Total Sales Dollars – San Mateo, Santa Clara Counties
May (2004 – 2015)
MLSListings Inc Confidential Copyright 2015 39
39
Condo/Townhouse Total Sales Dollars – Monterey, San Benito, Santa Cruz Counties
Jan ’04 – May ’15
MLSListings Inc Confidential Copyright 2015 40
40
Condo/Townhouse Total Sales Dollars – Monterey, San Benito, Santa Cruz Counties
May (2004 – 2015)
MLSListings Inc Confidential Copyright 2015 41
41
Condo/Townhouse Total Sales Dollars – Home Counties
May (2004 – 2015)
Monterey
County
San Benito
County
San Mateo
County
Santa Clara
County
Santa Cruz
County
May '04 $16,586,000 -11.8% $2,380,800 -84.2% $103,618,762 -16.7% $265,843,352 -1.2% $21,834,317 15.2%
May '05 $26,318,250 -44.4% $1,130,000 -66.8% $104,961,874 -17.7% $310,709,984 -15.5% $30,764,928 -18.2%
May '06 $15,874,000 -7.8% $2,575,500 -85.4% $102,441,254 -15.7% $266,822,314 -1.6% $19,961,567 26.1%
May '07 $11,216,000 30.5% $275,000 36.4% $68,703,388 25.7% $202,806,637 29.5% $18,992,890 32.5%
May '08 $3,233,862 352.6% $180,000 108.3% $53,220,457 62.2% $133,045,341 97.3% $12,167,239 106.8%
May '09 $4,677,220 212.9% $698,899 -46.3% $39,055,053 121.1% $111,746,585 135.0% $11,846,900 112.4%
May '10 $12,440,326 17.6% $62,000 504.8% $57,635,880 49.8% $174,800,419 50.2% $9,904,900 154.0%
May '11 $8,530,235 71.6% $215,000 74.4% $37,307,401 131.4% $139,007,246 88.9% $10,097,675 149.2%
May '12 $9,802,750 49.3% $210,000 78.6% $61,193,915 41.1% $171,705,505 52.9% $16,129,699 56.0%
May '13 $17,516,050 -16.4% $1,087,000 -65.5% $68,303,455 26.4% $236,816,808 10.9% $20,178,688 24.7%
May '14 $13,498,325 8.4% $1,797,658 -79.1% $85,217,443 1.3% $244,208,579 7.5% $18,450,400 36.4%
May '15 $14,635,250 $375,000 $86,331,688 $262,555,788 $25,161,784
Home Counties - Condo+Townhouse Total Sales Dollars (2015 vs. Prior Years)
MLSListings Inc Confidential Copyright 2014 42
42
Condo/Townhouse Months of Inventory – San Mateo, Santa Clara, Santa Cruz
Mar ’03 – May ’15 (Rolling Three Month Average)
MLSListings Inc Confidential Copyright 2015 43
43
Condo/Townhouse Months of Inventory – Monterey and San Benito Counties
Mar ’03 – May ’15 (Rolling Three Month Average)

Contenu connexe

Tendances

April 2015 - Market Snapshot - General Overview
April 2015 - Market Snapshot - General Overview April 2015 - Market Snapshot - General Overview
April 2015 - Market Snapshot - General Overview MLSListings Inc
 
October 2015 - Market Snapshot - General Overvew
October 2015 - Market Snapshot - General OvervewOctober 2015 - Market Snapshot - General Overvew
October 2015 - Market Snapshot - General OvervewMLSListings Inc
 
December 2015 - Market Snapshot - General Overview
December 2015 - Market Snapshot - General OverviewDecember 2015 - Market Snapshot - General Overview
December 2015 - Market Snapshot - General OverviewMLSListings Inc
 
Market Indicators - General Overview - December 2014
Market Indicators - General Overview - December 2014Market Indicators - General Overview - December 2014
Market Indicators - General Overview - December 2014MLSListings Inc
 
February 2016 - Market Snapshot - General Overview
 February 2016 - Market Snapshot - General Overview February 2016 - Market Snapshot - General Overview
February 2016 - Market Snapshot - General OverviewMLSListings Inc
 
January 2016 - Market Snapshot - General Overview
January 2016 - Market Snapshot - General OverviewJanuary 2016 - Market Snapshot - General Overview
January 2016 - Market Snapshot - General OverviewMLSListings Inc
 
November 2015 - Market Snapshot - General Overview
November 2015 - Market Snapshot - General OverviewNovember 2015 - Market Snapshot - General Overview
November 2015 - Market Snapshot - General OverviewMLSListings Inc
 
Market Indicators - General Overview - March 2015
Market Indicators - General Overview - March 2015Market Indicators - General Overview - March 2015
Market Indicators - General Overview - March 2015MLSListings Inc
 
March 2016 - Market Snapshot - General Overview
March 2016 - Market Snapshot - General OverviewMarch 2016 - Market Snapshot - General Overview
March 2016 - Market Snapshot - General OverviewMLSListings Inc
 
San Francisco Market Focus July 2015
San Francisco Market Focus July 2015San Francisco Market Focus July 2015
San Francisco Market Focus July 2015Ronny Budiutama
 
San Francisco Market Focus November 2013
San Francisco Market Focus November 2013San Francisco Market Focus November 2013
San Francisco Market Focus November 2013Ronny Budiutama
 
Fraser Valley Real Estate Board Statistics Package Jan 2021
Fraser Valley Real Estate Board Statistics Package Jan 2021Fraser Valley Real Estate Board Statistics Package Jan 2021
Fraser Valley Real Estate Board Statistics Package Jan 2021Vicky Aulakh
 
The Woodlands Homes Sales Report - February 2016
The Woodlands Homes Sales Report - February 2016The Woodlands Homes Sales Report - February 2016
The Woodlands Homes Sales Report - February 2016Ken Brand
 
San Francisco Market Focus October 2016
San Francisco Market Focus October 2016San Francisco Market Focus October 2016
San Francisco Market Focus October 2016Ronny Budiutama
 
San Francisco Market Focus August 2016
San Francisco Market Focus August 2016San Francisco Market Focus August 2016
San Francisco Market Focus August 2016Ronny Budiutama
 
4 projected budgeting 2016 FHC Z'DUBLIN'I
4 projected budgeting 2016 FHC Z'DUBLIN'I4 projected budgeting 2016 FHC Z'DUBLIN'I
4 projected budgeting 2016 FHC Z'DUBLIN'IFabrice CLAMAGIRAND
 
San Francisco Market Focus March 2015
San Francisco Market Focus March 2015San Francisco Market Focus March 2015
San Francisco Market Focus March 2015Ronny Budiutama
 
San Francisco Market Focus July 2016
San Francisco Market Focus July 2016San Francisco Market Focus July 2016
San Francisco Market Focus July 2016Ronny Budiutama
 

Tendances (19)

April 2015 - Market Snapshot - General Overview
April 2015 - Market Snapshot - General Overview April 2015 - Market Snapshot - General Overview
April 2015 - Market Snapshot - General Overview
 
October 2015 - Market Snapshot - General Overvew
October 2015 - Market Snapshot - General OvervewOctober 2015 - Market Snapshot - General Overvew
October 2015 - Market Snapshot - General Overvew
 
December 2015 - Market Snapshot - General Overview
December 2015 - Market Snapshot - General OverviewDecember 2015 - Market Snapshot - General Overview
December 2015 - Market Snapshot - General Overview
 
Market Indicators - General Overview - December 2014
Market Indicators - General Overview - December 2014Market Indicators - General Overview - December 2014
Market Indicators - General Overview - December 2014
 
February 2016 - Market Snapshot - General Overview
 February 2016 - Market Snapshot - General Overview February 2016 - Market Snapshot - General Overview
February 2016 - Market Snapshot - General Overview
 
January 2016 - Market Snapshot - General Overview
January 2016 - Market Snapshot - General OverviewJanuary 2016 - Market Snapshot - General Overview
January 2016 - Market Snapshot - General Overview
 
November 2015 - Market Snapshot - General Overview
November 2015 - Market Snapshot - General OverviewNovember 2015 - Market Snapshot - General Overview
November 2015 - Market Snapshot - General Overview
 
Market Indicators - General Overview - March 2015
Market Indicators - General Overview - March 2015Market Indicators - General Overview - March 2015
Market Indicators - General Overview - March 2015
 
March 2016 - Market Snapshot - General Overview
March 2016 - Market Snapshot - General OverviewMarch 2016 - Market Snapshot - General Overview
March 2016 - Market Snapshot - General Overview
 
San Francisco Market Focus July 2015
San Francisco Market Focus July 2015San Francisco Market Focus July 2015
San Francisco Market Focus July 2015
 
San Francisco Market Focus November 2013
San Francisco Market Focus November 2013San Francisco Market Focus November 2013
San Francisco Market Focus November 2013
 
Fraser Valley Real Estate Board Statistics Package Jan 2021
Fraser Valley Real Estate Board Statistics Package Jan 2021Fraser Valley Real Estate Board Statistics Package Jan 2021
Fraser Valley Real Estate Board Statistics Package Jan 2021
 
The Woodlands Homes Sales Report - February 2016
The Woodlands Homes Sales Report - February 2016The Woodlands Homes Sales Report - February 2016
The Woodlands Homes Sales Report - February 2016
 
MLS Housing Report October 2010
MLS Housing Report October 2010MLS Housing Report October 2010
MLS Housing Report October 2010
 
San Francisco Market Focus October 2016
San Francisco Market Focus October 2016San Francisco Market Focus October 2016
San Francisco Market Focus October 2016
 
San Francisco Market Focus August 2016
San Francisco Market Focus August 2016San Francisco Market Focus August 2016
San Francisco Market Focus August 2016
 
4 projected budgeting 2016 FHC Z'DUBLIN'I
4 projected budgeting 2016 FHC Z'DUBLIN'I4 projected budgeting 2016 FHC Z'DUBLIN'I
4 projected budgeting 2016 FHC Z'DUBLIN'I
 
San Francisco Market Focus March 2015
San Francisco Market Focus March 2015San Francisco Market Focus March 2015
San Francisco Market Focus March 2015
 
San Francisco Market Focus July 2016
San Francisco Market Focus July 2016San Francisco Market Focus July 2016
San Francisco Market Focus July 2016
 

Similaire à May 2015 - Market Snapshot - General Overview

March2015 market indicators-general-overview
March2015 market indicators-general-overviewMarch2015 market indicators-general-overview
March2015 market indicators-general-overviewMLSListings Inc
 
The Woodlands Home Sales Report - July 2016
The Woodlands Home Sales Report - July 2016The Woodlands Home Sales Report - July 2016
The Woodlands Home Sales Report - July 2016Ken Brand
 
Market Watch TORONTO 2015 SEPTEMBER
Market Watch TORONTO 2015 SEPTEMBERMarket Watch TORONTO 2015 SEPTEMBER
Market Watch TORONTO 2015 SEPTEMBERChaba Tamasi
 
4 projected budgeting 2016 FHC P'VEGAS'M
4 projected budgeting 2016 FHC P'VEGAS'M4 projected budgeting 2016 FHC P'VEGAS'M
4 projected budgeting 2016 FHC P'VEGAS'MFabrice CLAMAGIRAND
 
February 2016 Real Estate Market Report for The Woodlands, Texas
February 2016 Real Estate Market Report for The Woodlands, TexasFebruary 2016 Real Estate Market Report for The Woodlands, Texas
February 2016 Real Estate Market Report for The Woodlands, TexasReferred Realty Group
 
FHC KCANADAK FORECAST BUDGETING 2019
FHC KCANADAK FORECAST BUDGETING 2019FHC KCANADAK FORECAST BUDGETING 2019
FHC KCANADAK FORECAST BUDGETING 2019Fabrice CLAMAGIRAND
 
April 2016 - Market Snapshot - General Overview
April 2016 - Market Snapshot - General OverviewApril 2016 - Market Snapshot - General Overview
April 2016 - Market Snapshot - General OverviewMLSListings Inc
 
Projected budgeting 2016 FHC O'NEW YORK'A
Projected budgeting 2016 FHC O'NEW YORK'AProjected budgeting 2016 FHC O'NEW YORK'A
Projected budgeting 2016 FHC O'NEW YORK'AFabrice CLAMAGIRAND
 
September 2014 The Woodlands market report
September 2014 The  Woodlands market reportSeptember 2014 The  Woodlands market report
September 2014 The Woodlands market reportDebra Wymore
 
November 2016 Real Estate Market Report, The Woodlands, TX
November 2016 Real Estate Market Report, The Woodlands, TXNovember 2016 Real Estate Market Report, The Woodlands, TX
November 2016 Real Estate Market Report, The Woodlands, TXReferred Realty Group
 
FHC IUSAI FORECAST BUDGETING 2019
FHC IUSAI FORECAST BUDGETING 2019FHC IUSAI FORECAST BUDGETING 2019
FHC IUSAI FORECAST BUDGETING 2019Fabrice CLAMAGIRAND
 
1 projected budgeting 2016 FHC Y'LONDON'E
1 projected budgeting 2016 FHC Y'LONDON'E1 projected budgeting 2016 FHC Y'LONDON'E
1 projected budgeting 2016 FHC Y'LONDON'EFabrice CLAMAGIRAND
 
FHC MARABO FORECAST BUDGETING 2019
FHC MARABO FORECAST BUDGETING 2019FHC MARABO FORECAST BUDGETING 2019
FHC MARABO FORECAST BUDGETING 2019Fabrice CLAMAGIRAND
 
FHC WAMERICAW FORECAST BUDGETING 2019
FHC WAMERICAW FORECAST BUDGETING 2019FHC WAMERICAW FORECAST BUDGETING 2019
FHC WAMERICAW FORECAST BUDGETING 2019Fabrice CLAMAGIRAND
 
Market Watch APRIL 2015
Market Watch APRIL 2015Market Watch APRIL 2015
Market Watch APRIL 2015Chaba Tamasi
 

Similaire à May 2015 - Market Snapshot - General Overview (20)

March2015 market indicators-general-overview
March2015 market indicators-general-overviewMarch2015 market indicators-general-overview
March2015 market indicators-general-overview
 
The Woodlands Home Sales Report - July 2016
The Woodlands Home Sales Report - July 2016The Woodlands Home Sales Report - July 2016
The Woodlands Home Sales Report - July 2016
 
Market Watch TORONTO 2015 SEPTEMBER
Market Watch TORONTO 2015 SEPTEMBERMarket Watch TORONTO 2015 SEPTEMBER
Market Watch TORONTO 2015 SEPTEMBER
 
4 projected budgeting 2016 FHC P'VEGAS'M
4 projected budgeting 2016 FHC P'VEGAS'M4 projected budgeting 2016 FHC P'VEGAS'M
4 projected budgeting 2016 FHC P'VEGAS'M
 
FHC P VEGAS M 2017
FHC P VEGAS M 2017FHC P VEGAS M 2017
FHC P VEGAS M 2017
 
February 2016 Real Estate Market Report for The Woodlands, Texas
February 2016 Real Estate Market Report for The Woodlands, TexasFebruary 2016 Real Estate Market Report for The Woodlands, Texas
February 2016 Real Estate Market Report for The Woodlands, Texas
 
FHC KCANADAK FORECAST BUDGETING 2019
FHC KCANADAK FORECAST BUDGETING 2019FHC KCANADAK FORECAST BUDGETING 2019
FHC KCANADAK FORECAST BUDGETING 2019
 
April 2016 - Market Snapshot - General Overview
April 2016 - Market Snapshot - General OverviewApril 2016 - Market Snapshot - General Overview
April 2016 - Market Snapshot - General Overview
 
FHC O NEW YORK A 2017
FHC O NEW YORK A 2017FHC O NEW YORK A 2017
FHC O NEW YORK A 2017
 
Projected budgeting 2016 FHC O'NEW YORK'A
Projected budgeting 2016 FHC O'NEW YORK'AProjected budgeting 2016 FHC O'NEW YORK'A
Projected budgeting 2016 FHC O'NEW YORK'A
 
September 2014 The Woodlands market report
September 2014 The  Woodlands market reportSeptember 2014 The  Woodlands market report
September 2014 The Woodlands market report
 
FHC BUDGET KCANADAK 2018
FHC BUDGET KCANADAK 2018FHC BUDGET KCANADAK 2018
FHC BUDGET KCANADAK 2018
 
November 2016 Real Estate Market Report, The Woodlands, TX
November 2016 Real Estate Market Report, The Woodlands, TXNovember 2016 Real Estate Market Report, The Woodlands, TX
November 2016 Real Estate Market Report, The Woodlands, TX
 
FHC IUSAI FORECAST BUDGETING 2019
FHC IUSAI FORECAST BUDGETING 2019FHC IUSAI FORECAST BUDGETING 2019
FHC IUSAI FORECAST BUDGETING 2019
 
Emi chart
Emi chartEmi chart
Emi chart
 
FHC Y LONDON E 2017
FHC Y LONDON E 2017FHC Y LONDON E 2017
FHC Y LONDON E 2017
 
1 projected budgeting 2016 FHC Y'LONDON'E
1 projected budgeting 2016 FHC Y'LONDON'E1 projected budgeting 2016 FHC Y'LONDON'E
1 projected budgeting 2016 FHC Y'LONDON'E
 
FHC MARABO FORECAST BUDGETING 2019
FHC MARABO FORECAST BUDGETING 2019FHC MARABO FORECAST BUDGETING 2019
FHC MARABO FORECAST BUDGETING 2019
 
FHC WAMERICAW FORECAST BUDGETING 2019
FHC WAMERICAW FORECAST BUDGETING 2019FHC WAMERICAW FORECAST BUDGETING 2019
FHC WAMERICAW FORECAST BUDGETING 2019
 
Market Watch APRIL 2015
Market Watch APRIL 2015Market Watch APRIL 2015
Market Watch APRIL 2015
 

Plus de MLSListings Inc

April 2016 - Market Snapshot - Santa Cruz County
April 2016 - Market Snapshot - Santa Cruz CountyApril 2016 - Market Snapshot - Santa Cruz County
April 2016 - Market Snapshot - Santa Cruz CountyMLSListings Inc
 
April 2016 - Market Snapshot - Santa Clara County
April 2016 - Market Snapshot - Santa Clara CountyApril 2016 - Market Snapshot - Santa Clara County
April 2016 - Market Snapshot - Santa Clara CountyMLSListings Inc
 
April 2016 - Market Snapshot - San Mateo County
April 2016 - Market Snapshot - San Mateo CountyApril 2016 - Market Snapshot - San Mateo County
April 2016 - Market Snapshot - San Mateo CountyMLSListings Inc
 
April 2016 - Market Snapshot - San Benito County
April 2016 - Market Snapshot - San Benito CountyApril 2016 - Market Snapshot - San Benito County
April 2016 - Market Snapshot - San Benito CountyMLSListings Inc
 
April 2016 - Market Snapshot - Monterey County
April 2016 - Market Snapshot - Monterey CountyApril 2016 - Market Snapshot - Monterey County
April 2016 - Market Snapshot - Monterey CountyMLSListings Inc
 
March 2016 - Market Snapshot - Santa Cruz County
March 2016 - Market Snapshot - Santa Cruz CountyMarch 2016 - Market Snapshot - Santa Cruz County
March 2016 - Market Snapshot - Santa Cruz CountyMLSListings Inc
 
March 2016 - Market Snapshot - Santa Clara County
March 2016 - Market Snapshot - Santa Clara CountyMarch 2016 - Market Snapshot - Santa Clara County
March 2016 - Market Snapshot - Santa Clara CountyMLSListings Inc
 
March 2016 - Market Snapshot - San Mateo County
March 2016 - Market Snapshot - San Mateo CountyMarch 2016 - Market Snapshot - San Mateo County
March 2016 - Market Snapshot - San Mateo CountyMLSListings Inc
 
March 2016 - Market Snapshot - San Benito County
March 2016 - Market Snapshot - San Benito CountyMarch 2016 - Market Snapshot - San Benito County
March 2016 - Market Snapshot - San Benito CountyMLSListings Inc
 
March 2016 - Market Snapshot - Monterey County
March 2016 - Market Snapshot - Monterey CountyMarch 2016 - Market Snapshot - Monterey County
March 2016 - Market Snapshot - Monterey CountyMLSListings Inc
 
February 2016 - Market Snapshot - Santa Cruz County
February 2016 - Market Snapshot - Santa Cruz County February 2016 - Market Snapshot - Santa Cruz County
February 2016 - Market Snapshot - Santa Cruz County MLSListings Inc
 
February 2016 - Market Snapshot - Santa Clara County
February 2016 - Market Snapshot - Santa Clara County February 2016 - Market Snapshot - Santa Clara County
February 2016 - Market Snapshot - Santa Clara County MLSListings Inc
 
February 2016 - Market Snapshot - San Mateo County
February 2016 - Market Snapshot - San Mateo County February 2016 - Market Snapshot - San Mateo County
February 2016 - Market Snapshot - San Mateo County MLSListings Inc
 
February 2016 - Market Snapshot - San Benito County
February 2016 - Market Snapshot - San Benito County February 2016 - Market Snapshot - San Benito County
February 2016 - Market Snapshot - San Benito County MLSListings Inc
 
February 2016 - Market Snapshot - Monterey County
 February 2016 - Market Snapshot - Monterey County February 2016 - Market Snapshot - Monterey County
February 2016 - Market Snapshot - Monterey CountyMLSListings Inc
 
January 2016 - Market Snapshot - Santa Cruz County
January 2016 - Market Snapshot - Santa Cruz CountyJanuary 2016 - Market Snapshot - Santa Cruz County
January 2016 - Market Snapshot - Santa Cruz CountyMLSListings Inc
 
January 2016 - Market Snapshot - Santa Clara County
January 2016 - Market Snapshot - Santa Clara CountyJanuary 2016 - Market Snapshot - Santa Clara County
January 2016 - Market Snapshot - Santa Clara CountyMLSListings Inc
 
January 2016 - Market Snapshot - San Mateo County
January 2016 - Market Snapshot - San Mateo CountyJanuary 2016 - Market Snapshot - San Mateo County
January 2016 - Market Snapshot - San Mateo CountyMLSListings Inc
 
January 2016 - Market Snapshot - San Benito County
January 2016 - Market Snapshot - San Benito CountyJanuary 2016 - Market Snapshot - San Benito County
January 2016 - Market Snapshot - San Benito CountyMLSListings Inc
 
January 2016 - Market Snapshot - Monterey County
January 2016 - Market Snapshot - Monterey CountyJanuary 2016 - Market Snapshot - Monterey County
January 2016 - Market Snapshot - Monterey CountyMLSListings Inc
 

Plus de MLSListings Inc (20)

April 2016 - Market Snapshot - Santa Cruz County
April 2016 - Market Snapshot - Santa Cruz CountyApril 2016 - Market Snapshot - Santa Cruz County
April 2016 - Market Snapshot - Santa Cruz County
 
April 2016 - Market Snapshot - Santa Clara County
April 2016 - Market Snapshot - Santa Clara CountyApril 2016 - Market Snapshot - Santa Clara County
April 2016 - Market Snapshot - Santa Clara County
 
April 2016 - Market Snapshot - San Mateo County
April 2016 - Market Snapshot - San Mateo CountyApril 2016 - Market Snapshot - San Mateo County
April 2016 - Market Snapshot - San Mateo County
 
April 2016 - Market Snapshot - San Benito County
April 2016 - Market Snapshot - San Benito CountyApril 2016 - Market Snapshot - San Benito County
April 2016 - Market Snapshot - San Benito County
 
April 2016 - Market Snapshot - Monterey County
April 2016 - Market Snapshot - Monterey CountyApril 2016 - Market Snapshot - Monterey County
April 2016 - Market Snapshot - Monterey County
 
March 2016 - Market Snapshot - Santa Cruz County
March 2016 - Market Snapshot - Santa Cruz CountyMarch 2016 - Market Snapshot - Santa Cruz County
March 2016 - Market Snapshot - Santa Cruz County
 
March 2016 - Market Snapshot - Santa Clara County
March 2016 - Market Snapshot - Santa Clara CountyMarch 2016 - Market Snapshot - Santa Clara County
March 2016 - Market Snapshot - Santa Clara County
 
March 2016 - Market Snapshot - San Mateo County
March 2016 - Market Snapshot - San Mateo CountyMarch 2016 - Market Snapshot - San Mateo County
March 2016 - Market Snapshot - San Mateo County
 
March 2016 - Market Snapshot - San Benito County
March 2016 - Market Snapshot - San Benito CountyMarch 2016 - Market Snapshot - San Benito County
March 2016 - Market Snapshot - San Benito County
 
March 2016 - Market Snapshot - Monterey County
March 2016 - Market Snapshot - Monterey CountyMarch 2016 - Market Snapshot - Monterey County
March 2016 - Market Snapshot - Monterey County
 
February 2016 - Market Snapshot - Santa Cruz County
February 2016 - Market Snapshot - Santa Cruz County February 2016 - Market Snapshot - Santa Cruz County
February 2016 - Market Snapshot - Santa Cruz County
 
February 2016 - Market Snapshot - Santa Clara County
February 2016 - Market Snapshot - Santa Clara County February 2016 - Market Snapshot - Santa Clara County
February 2016 - Market Snapshot - Santa Clara County
 
February 2016 - Market Snapshot - San Mateo County
February 2016 - Market Snapshot - San Mateo County February 2016 - Market Snapshot - San Mateo County
February 2016 - Market Snapshot - San Mateo County
 
February 2016 - Market Snapshot - San Benito County
February 2016 - Market Snapshot - San Benito County February 2016 - Market Snapshot - San Benito County
February 2016 - Market Snapshot - San Benito County
 
February 2016 - Market Snapshot - Monterey County
 February 2016 - Market Snapshot - Monterey County February 2016 - Market Snapshot - Monterey County
February 2016 - Market Snapshot - Monterey County
 
January 2016 - Market Snapshot - Santa Cruz County
January 2016 - Market Snapshot - Santa Cruz CountyJanuary 2016 - Market Snapshot - Santa Cruz County
January 2016 - Market Snapshot - Santa Cruz County
 
January 2016 - Market Snapshot - Santa Clara County
January 2016 - Market Snapshot - Santa Clara CountyJanuary 2016 - Market Snapshot - Santa Clara County
January 2016 - Market Snapshot - Santa Clara County
 
January 2016 - Market Snapshot - San Mateo County
January 2016 - Market Snapshot - San Mateo CountyJanuary 2016 - Market Snapshot - San Mateo County
January 2016 - Market Snapshot - San Mateo County
 
January 2016 - Market Snapshot - San Benito County
January 2016 - Market Snapshot - San Benito CountyJanuary 2016 - Market Snapshot - San Benito County
January 2016 - Market Snapshot - San Benito County
 
January 2016 - Market Snapshot - Monterey County
January 2016 - Market Snapshot - Monterey CountyJanuary 2016 - Market Snapshot - Monterey County
January 2016 - Market Snapshot - Monterey County
 

Dernier

Call Girls In Mayur Vihar-1 Delhi ❤️8860477959 Good Looking Escorts In 24/7 D...
Call Girls In Mayur Vihar-1 Delhi ❤️8860477959 Good Looking Escorts In 24/7 D...Call Girls In Mayur Vihar-1 Delhi ❤️8860477959 Good Looking Escorts In 24/7 D...
Call Girls In Mayur Vihar-1 Delhi ❤️8860477959 Good Looking Escorts In 24/7 D...lizamodels9
 
Purva Palm Hills Devanahalli, Bangalore E- Brochure.pdf
Purva Palm Hills Devanahalli, Bangalore E- Brochure.pdfPurva Palm Hills Devanahalli, Bangalore E- Brochure.pdf
Purva Palm Hills Devanahalli, Bangalore E- Brochure.pdffaheemali990101
 
Call Girls in Nehru Place Delhi 💯Call Us 🔝8264348440🔝
Call Girls in Nehru Place Delhi 💯Call Us 🔝8264348440🔝Call Girls in Nehru Place Delhi 💯Call Us 🔝8264348440🔝
Call Girls in Nehru Place Delhi 💯Call Us 🔝8264348440🔝soniya singh
 
Kumar Fireworks Hadapsar Link Road Pune Brochure.pdf
Kumar Fireworks Hadapsar Link Road Pune Brochure.pdfKumar Fireworks Hadapsar Link Road Pune Brochure.pdf
Kumar Fireworks Hadapsar Link Road Pune Brochure.pdfBabyrudram
 
Partner With the Golden Life Community for Single Women Over 55
Partner With the Golden Life Community for Single Women Over 55Partner With the Golden Life Community for Single Women Over 55
Partner With the Golden Life Community for Single Women Over 55Ron Surz
 
Sobha Aranya Sector 80 Gurgaon E- Brochure.pdf
Sobha Aranya Sector 80 Gurgaon E- Brochure.pdfSobha Aranya Sector 80 Gurgaon E- Brochure.pdf
Sobha Aranya Sector 80 Gurgaon E- Brochure.pdffaheemali990101
 
Cashpay_Call Girls In Gaur City Mall Noida ❤️8860477959 Escorts Service In 24...
Cashpay_Call Girls In Gaur City Mall Noida ❤️8860477959 Escorts Service In 24...Cashpay_Call Girls In Gaur City Mall Noida ❤️8860477959 Escorts Service In 24...
Cashpay_Call Girls In Gaur City Mall Noida ❤️8860477959 Escorts Service In 24...lizamodels9
 
Ajmera Prive at Juhu, Mumbai E-Brochure.pdf
Ajmera Prive at Juhu, Mumbai  E-Brochure.pdfAjmera Prive at Juhu, Mumbai  E-Brochure.pdf
Ajmera Prive at Juhu, Mumbai E-Brochure.pdfManishSaxena95
 
Experion Elements Sector 45 Noida_Brochure.pdf.pdf
Experion Elements Sector 45 Noida_Brochure.pdf.pdfExperion Elements Sector 45 Noida_Brochure.pdf.pdf
Experion Elements Sector 45 Noida_Brochure.pdf.pdfkratirudram
 
Call Girls In Peeragarhi, Delhi↫8447779280↬Call Girls in Peeragarhi Delhi NCR
Call Girls In Peeragarhi, Delhi↫8447779280↬Call Girls in Peeragarhi Delhi NCRCall Girls In Peeragarhi, Delhi↫8447779280↬Call Girls in Peeragarhi Delhi NCR
Call Girls In Peeragarhi, Delhi↫8447779280↬Call Girls in Peeragarhi Delhi NCRasmaqueen5
 
83770-87607 ۞Call Girls In Near The Park Hotel (Cp) Delhi
83770-87607 ۞Call Girls In Near The Park Hotel (Cp) Delhi83770-87607 ۞Call Girls In Near The Park Hotel (Cp) Delhi
83770-87607 ۞Call Girls In Near The Park Hotel (Cp) Delhidollysharma2066
 
Call Girls In The Lalit New Delhi ❤️8860477959 Good Looking Escorts In 24/7 D...
Call Girls In The Lalit New Delhi ❤️8860477959 Good Looking Escorts In 24/7 D...Call Girls In The Lalit New Delhi ❤️8860477959 Good Looking Escorts In 24/7 D...
Call Girls In The Lalit New Delhi ❤️8860477959 Good Looking Escorts In 24/7 D...lizamodels9
 
9990771857 Call Girls in Noida Sector 1 Noida (Call Girls) Delhi
9990771857 Call Girls in Noida Sector 1 Noida (Call Girls) Delhi9990771857 Call Girls in Noida Sector 1 Noida (Call Girls) Delhi
9990771857 Call Girls in Noida Sector 1 Noida (Call Girls) Delhidelhimodel235
 
Call Girls In Sahibabad Ghaziabad ❤️8860477959 Low Rate Escorts Service In 24...
Call Girls In Sahibabad Ghaziabad ❤️8860477959 Low Rate Escorts Service In 24...Call Girls In Sahibabad Ghaziabad ❤️8860477959 Low Rate Escorts Service In 24...
Call Girls In Sahibabad Ghaziabad ❤️8860477959 Low Rate Escorts Service In 24...lizamodels9
 
Call Girls in Kashmiri Gate Delhi 💯Call Us 🔝8264348440🔝
Call Girls in Kashmiri Gate Delhi 💯Call Us 🔝8264348440🔝Call Girls in Kashmiri Gate Delhi 💯Call Us 🔝8264348440🔝
Call Girls in Kashmiri Gate Delhi 💯Call Us 🔝8264348440🔝soniya singh
 
Low Rate Call Girls in Lajpat Nagar Delhi Call 9990771857
Low Rate Call Girls in Lajpat Nagar Delhi Call 9990771857Low Rate Call Girls in Lajpat Nagar Delhi Call 9990771857
Low Rate Call Girls in Lajpat Nagar Delhi Call 9990771857delhimodel235
 
Shapoorji Pallonji Parkwest Sequoia Tower Bangalore.pdf
Shapoorji Pallonji Parkwest Sequoia Tower Bangalore.pdfShapoorji Pallonji Parkwest Sequoia Tower Bangalore.pdf
Shapoorji Pallonji Parkwest Sequoia Tower Bangalore.pdfashiyadav24
 
Prestige Sector 94 at Noida E Brochure.pdf
Prestige Sector 94 at Noida E Brochure.pdfPrestige Sector 94 at Noida E Brochure.pdf
Prestige Sector 94 at Noida E Brochure.pdfsarak0han45400
 
8 Key Elements for Comfortable Farmland Living
8 Key Elements for Comfortable Farmland Living 8 Key Elements for Comfortable Farmland Living
8 Key Elements for Comfortable Farmland Living Farmland Bazaar
 

Dernier (20)

Call Girls In Mayur Vihar-1 Delhi ❤️8860477959 Good Looking Escorts In 24/7 D...
Call Girls In Mayur Vihar-1 Delhi ❤️8860477959 Good Looking Escorts In 24/7 D...Call Girls In Mayur Vihar-1 Delhi ❤️8860477959 Good Looking Escorts In 24/7 D...
Call Girls In Mayur Vihar-1 Delhi ❤️8860477959 Good Looking Escorts In 24/7 D...
 
Purva Palm Hills Devanahalli, Bangalore E- Brochure.pdf
Purva Palm Hills Devanahalli, Bangalore E- Brochure.pdfPurva Palm Hills Devanahalli, Bangalore E- Brochure.pdf
Purva Palm Hills Devanahalli, Bangalore E- Brochure.pdf
 
Call Girls in Nehru Place Delhi 💯Call Us 🔝8264348440🔝
Call Girls in Nehru Place Delhi 💯Call Us 🔝8264348440🔝Call Girls in Nehru Place Delhi 💯Call Us 🔝8264348440🔝
Call Girls in Nehru Place Delhi 💯Call Us 🔝8264348440🔝
 
Kumar Fireworks Hadapsar Link Road Pune Brochure.pdf
Kumar Fireworks Hadapsar Link Road Pune Brochure.pdfKumar Fireworks Hadapsar Link Road Pune Brochure.pdf
Kumar Fireworks Hadapsar Link Road Pune Brochure.pdf
 
Partner With the Golden Life Community for Single Women Over 55
Partner With the Golden Life Community for Single Women Over 55Partner With the Golden Life Community for Single Women Over 55
Partner With the Golden Life Community for Single Women Over 55
 
Sobha Aranya Sector 80 Gurgaon E- Brochure.pdf
Sobha Aranya Sector 80 Gurgaon E- Brochure.pdfSobha Aranya Sector 80 Gurgaon E- Brochure.pdf
Sobha Aranya Sector 80 Gurgaon E- Brochure.pdf
 
Cashpay_Call Girls In Gaur City Mall Noida ❤️8860477959 Escorts Service In 24...
Cashpay_Call Girls In Gaur City Mall Noida ❤️8860477959 Escorts Service In 24...Cashpay_Call Girls In Gaur City Mall Noida ❤️8860477959 Escorts Service In 24...
Cashpay_Call Girls In Gaur City Mall Noida ❤️8860477959 Escorts Service In 24...
 
Ajmera Prive at Juhu, Mumbai E-Brochure.pdf
Ajmera Prive at Juhu, Mumbai  E-Brochure.pdfAjmera Prive at Juhu, Mumbai  E-Brochure.pdf
Ajmera Prive at Juhu, Mumbai E-Brochure.pdf
 
Experion Elements Sector 45 Noida_Brochure.pdf.pdf
Experion Elements Sector 45 Noida_Brochure.pdf.pdfExperion Elements Sector 45 Noida_Brochure.pdf.pdf
Experion Elements Sector 45 Noida_Brochure.pdf.pdf
 
Call Girls In Peeragarhi, Delhi↫8447779280↬Call Girls in Peeragarhi Delhi NCR
Call Girls In Peeragarhi, Delhi↫8447779280↬Call Girls in Peeragarhi Delhi NCRCall Girls In Peeragarhi, Delhi↫8447779280↬Call Girls in Peeragarhi Delhi NCR
Call Girls In Peeragarhi, Delhi↫8447779280↬Call Girls in Peeragarhi Delhi NCR
 
83770-87607 ۞Call Girls In Near The Park Hotel (Cp) Delhi
83770-87607 ۞Call Girls In Near The Park Hotel (Cp) Delhi83770-87607 ۞Call Girls In Near The Park Hotel (Cp) Delhi
83770-87607 ۞Call Girls In Near The Park Hotel (Cp) Delhi
 
Call Girls In The Lalit New Delhi ❤️8860477959 Good Looking Escorts In 24/7 D...
Call Girls In The Lalit New Delhi ❤️8860477959 Good Looking Escorts In 24/7 D...Call Girls In The Lalit New Delhi ❤️8860477959 Good Looking Escorts In 24/7 D...
Call Girls In The Lalit New Delhi ❤️8860477959 Good Looking Escorts In 24/7 D...
 
9990771857 Call Girls in Noida Sector 1 Noida (Call Girls) Delhi
9990771857 Call Girls in Noida Sector 1 Noida (Call Girls) Delhi9990771857 Call Girls in Noida Sector 1 Noida (Call Girls) Delhi
9990771857 Call Girls in Noida Sector 1 Noida (Call Girls) Delhi
 
Call Girls In Sahibabad Ghaziabad ❤️8860477959 Low Rate Escorts Service In 24...
Call Girls In Sahibabad Ghaziabad ❤️8860477959 Low Rate Escorts Service In 24...Call Girls In Sahibabad Ghaziabad ❤️8860477959 Low Rate Escorts Service In 24...
Call Girls In Sahibabad Ghaziabad ❤️8860477959 Low Rate Escorts Service In 24...
 
Call Girls in Kashmiri Gate Delhi 💯Call Us 🔝8264348440🔝
Call Girls in Kashmiri Gate Delhi 💯Call Us 🔝8264348440🔝Call Girls in Kashmiri Gate Delhi 💯Call Us 🔝8264348440🔝
Call Girls in Kashmiri Gate Delhi 💯Call Us 🔝8264348440🔝
 
Low Rate Call Girls in Lajpat Nagar Delhi Call 9990771857
Low Rate Call Girls in Lajpat Nagar Delhi Call 9990771857Low Rate Call Girls in Lajpat Nagar Delhi Call 9990771857
Low Rate Call Girls in Lajpat Nagar Delhi Call 9990771857
 
Shapoorji Pallonji Parkwest Sequoia Tower Bangalore.pdf
Shapoorji Pallonji Parkwest Sequoia Tower Bangalore.pdfShapoorji Pallonji Parkwest Sequoia Tower Bangalore.pdf
Shapoorji Pallonji Parkwest Sequoia Tower Bangalore.pdf
 
Call Girls in Mahavir Nagar whatsaap call US +919953056974
Call Girls in Mahavir Nagar  whatsaap call US  +919953056974Call Girls in Mahavir Nagar  whatsaap call US  +919953056974
Call Girls in Mahavir Nagar whatsaap call US +919953056974
 
Prestige Sector 94 at Noida E Brochure.pdf
Prestige Sector 94 at Noida E Brochure.pdfPrestige Sector 94 at Noida E Brochure.pdf
Prestige Sector 94 at Noida E Brochure.pdf
 
8 Key Elements for Comfortable Farmland Living
8 Key Elements for Comfortable Farmland Living 8 Key Elements for Comfortable Farmland Living
8 Key Elements for Comfortable Farmland Living
 

May 2015 - Market Snapshot - General Overview

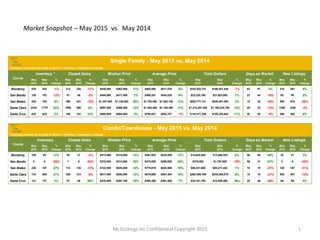
  • 1. MLSListings Inc Confidential Copyright 2015 1 Market Snapshot – May 2015 vs. May 2014 * Inventory defined as the total of Active + Pending + Contingent Listings May 2015 May 2014 % Change May 2015 May 2014 % Change May 2015 May 2014 % Change May 2015 May 2014 % Change May 2015 May 2014 % Change May 2015 May 2014 % Change May 2015 May 2014 % Change Monterey 919 932 -1% 212 242 -12% $539,500 $462,500 17% $862,890 $811,576 6% $182,932,721 $196,401,438 -7% 63 61 3% 315 291 8% San Benito 138 157 -12% 47 48 -2% $444,985 $417,500 7% $496,281 $454,229 9% $23,325,185 $21,803,003 7% 37 44 -16% 62 60 3% San Mateo 825 763 8% 380 421 -10% $1,347,500 $1,126,500 20% $1,720,450 $1,520,146 13% $653,771,131 $638,461,458 2% 18 30 -40% 498 619 -20% Santa Clara 2343 1779 32% 1006 990 2% $997,500 $888,888 12% $1,304,465 $1,180,399 11% $1,312,291,582 $1,166,234,750 13% 20 23 -13% 1388 1449 -4% Santa Cruz 632 622 2% 180 161 12% $695,000 $684,000 2% $796,541 $802,707 -1% $143,377,298 $129,235,842 11% 48 50 -4% 286 262 9% * Inventory defined as the total of Active + Pending + Contingent Listings May 2015 May 2014 % Change May 2015 May 2014 % Change May 2015 May 2014 % Change May 2015 May 2014 % Change May 2015 May 2014 % Change May 2015 May 2014 % Change May 2015 May 2014 % Change Monterey 104 93 12% 30 31 -3% $472,500 $415,000 14% $487,842 $435,429 12% $14,635,250 $13,498,325 8% 56 40 40% 32 31 3% San Benito 4 8 -50% 1 6 -83% $375,000 $313,000 20% $375,000 $299,609 25% $375,000 $1,797,658 -79% 56 31 81% 3 5 -40% San Mateo 230 181 27% 112 132 -15% $722,500 $635,000 14% $770,819 $645,586 19% $86,331,688 $85,217,443 1% 15 19 -21% 148 187 -21% Santa Clara 733 605 21% 388 413 -6% $617,500 $545,000 13% $676,690 $591,304 14% $262,555,788 $244,208,579 8% 15 19 -21% 502 557 -10% Santa Cruz 141 137 3% 51 40 28% $475,000 $397,750 19% $493,368 $461,260 7% $25,161,784 $18,450,400 36% 25 46 -46% 64 59 8% Single Family - May 2015 vs. May 2014 County Inventory * Closed Sales Median Price Average Price Total Dollars Days on Market New Listings Condo/Townhouse - May 2015 vs. May 2014 County Inventory Closed Sales Median Price Average Price Total Dollars Days on Market New Listings
  • 2. MLSListings Inc Confidential Copyright 2015 2 Market Snapshot – May 2015 vs. Apr 2015 * Inventory defined as the total of Active + Pending + Contingent Listings Apr 2015 May 2015 % Change Apr 2015 May 2015 % Change Apr 2015 May 2015 % Change Apr 2015 May 2015 % Change Apr 2015 May 2015 % Change Apr 2015 May 2015 % Change Apr 2015 May 2015 % Change Monterey 924 919 -1% 217 212 -2% $460,000 $539,500 17% $698,799 $862,890 23% $151,639,388 $182,932,721 21% 76 63 -17% 316 315 0% San Benito 142 138 -3% 50 47 -6% $465,000 $444,985 -4% $480,364 $496,281 3% $24,018,209 $23,325,185 -3% 49 37 -24% 60 62 3% San Mateo 860 825 -4% 413 380 -8% $1,285,000 $1,347,500 5% $1,625,986 $1,720,450 6% $673,158,037 $653,771,131 -3% 23 18 -22% 523 498 -5% Santa Clara 2264 2343 3% 1074 1006 -6% $965,500 $997,500 3% $1,272,633 $1,304,465 3% $1,366,807,587 $1,312,291,582 -4% 24 20 -17% 1399 1388 -1% Santa Cruz 578 632 9% 172 180 5% $760,000 $695,000 -9% $840,578 $796,541 -5% $144,579,485 $143,377,298 -1% 50 48 -4% 271 286 6% * Inventory defined as the total of Active + Pending + Contingent Listings Apr 2015 May 2015 % Change Apr 2015 May 2015 % Change Apr 2015 May 2015 % Change Apr 2015 May 2015 % Change Apr 2015 May 2015 % Change Apr 2015 May 2015 % Change Apr 2015 May 2015 % Change Monterey 103 104 1% 20 30 50% $385,000 $472,500 23% $457,075 $487,842 7% $9,141,500 $14,635,250 60% 73 56 -23% 38 32 -16% San Benito 3 4 33% 12 1 -92% $293,500 $375,000 28% $313,608 $375,000 20% $3,763,300 $375,000 -90% 61 56 -8% 1 3 200% San Mateo 212 230 8% 140 112 -20% $657,750 $722,500 10% $726,436 $770,819 6% $101,701,100 $86,331,688 -15% 17 15 -12% 139 148 6% Santa Clara 716 733 2% 378 388 3% $572,500 $617,500 8% $648,036 $676,690 4% $244,957,458 $262,555,788 7% 18 15 -17% 519 502 -3% Santa Cruz 142 141 -1% 51 51 0% $445,000 $475,000 7% $538,937 $493,368 -8% $27,485,799 $25,161,784 -8% 82 25 -70% 58 64 10% Single Family - Current Month vs. Prior Month - May 2015 vs. April 2015 County Inventory Closed Sales Median Price Average Price Total Dollars Days on Market New Listings Condo/Townhouse - Current Month vs. Prior Month - May 2015 vs. April 2015 County Inventory Closed Sales Median Price Average Price Total Dollars Days on Market New Listings
  • 3. MLSListings Inc Confidential Copyright 2015 3 3 Single Family+Condo/Townhouse Inventory, Closed Sales, New Listings - Home Counties Jan ’03 – May ’15
  • 4. MLSListings Inc Confidential Copyright 2015 4 4 Single Family + Condo/Townhouse Inventory - Home Counties Jan ’03 – May ’15
  • 5. MLSListings Inc Confidential Copyright 2015 5 5 Single Family + Condo/Townhouse Inventory - Home Counties Jan ’05 – May ’15 2005 2006 2007 2008 2009 2010 2011 2012 2013 2014 2015 Jan 4223 7295 8588 12447 12693 8558 10330 8140 3179 3578 4175 Feb 4839 8023 9184 13528 13079 9650 10803 8231 4296 3924 3932 Mar 5502 8827 10357 14355 13240 10910 11127 7991 4286 4322 5515 Apr 6434 9722 11812 15513 12806 11773 11506 7630 4765 4776 5944 May 7020 10819 12923 15787 11749 11903 11730 7712 5222 3520 6069 Jun 7189 11493 13287 15802 11104 12691 11740 7570 5616 5322 Jul 7878 12317 13910 15948 10763 13016 11372 7306 5950 4389 Aug 8030 12122 14275 15356 10044 13072 11201 7116 5850 5378 Sep 8798 12239 13943 15192 9823 13294 10944 6523 5806 5290 Oct 8946 11490 14020 15070 9295 12440 10241 6173 5384 4863 Nov 8252 9968 13308 13849 8724 11500 9482 5292 4592 3925 Dec 6372 7874 11420 12221 7778 9825 7790 3901 3198 3174 May '05 7020 May '06 10819 May '07 12923 May '08 15787 May '09 11749 May '10 11903 May '11 11730 May '12 7712 May '13 5222 May '14 3520 May '15 6069 Home Counties - Single Family + Condo/Townhouse Inventory Variance to prior Years Home Counties Inventory -13.5% -43.9% -53.0% -61.6% -48.3% -49.0% -48.3% -21.3% 16.2% 72.4% 0 2000 4000 6000 8000 10000 12000 14000 16000 May '05 May '06 May '07 May '08 May '09 May '10 May '11 May '12 May '13 May '14 May '15 15787 6069
  • 6. MLSListings Inc Confidential Copyright 2015 6 6 Single Family Inventory - Home Counties Jan ’04 – May ’15
  • 7. MLSListings Inc Confidential Copyright 2015 7 7 Single Family Inventory - Home Counties May (2004 – 2015)
  • 8. MLSListings Inc Confidential Copyright 2015 8 8 Single Family Inventory - Home Counties May (2004 – 2015) Monterey County San Benito County San Mateo County Santa Clara County Santa Cruz County May '04 973 -5.5% 196 -29.6% 1148 -28.1% 3521 -33.5% 850 -25.6% May '05 1143 -19.6% 173 -20.2% 1014 -18.6% 2827 -17.1% 675 -6.4% May '06 2253 -59.2% 351 -60.7% 1367 -39.6% 3542 -33.9% 1121 -43.6% May '07 2711 -66.1% 486 -71.6% 1484 -44.4% 4323 -45.8% 1218 -48.1% May '08 2725 -66.3% 580 -76.2% 1918 -57.0% 6130 -61.8% 1252 -49.5% May '09 1906 -51.8% 266 -48.1% 1619 -49.0% 4445 -47.3% 994 -36.4% May '10 1763 -47.9% 272 -49.3% 1836 -55.1% 4155 -43.6% 1018 -37.9% May '11 1653 -44.4% 287 -51.9% 1853 -55.5% 4148 -43.5% 982 -35.6% May '12 1211 -24.1% 193 -28.5% 1195 -31.0% 2620 -10.6% 811 -22.1% May '13 897 2.5% 120 15.0% 814 1.4% 1750 33.9% 613 3.1% May '14 932 -1.4% 157 -12.1% 763 8.1% 1779 31.7% 622 1.6% May '15 919 138 825 2343 632 Home Counties - Single Family Inventory (2015 vs. Prior Years)
  • 9. MLSListings Inc Confidential Copyright 2015 9 9 Single Family Months of Inventory – San Mateo, Santa Clara, Santa Cruz Mar ’03 – May ’15 (Rolling Three Month Average)
  • 10. MLSListings Inc Confidential Copyright 2015 10 10 Single Family Months of Inventory – Monterey and San Benito Counties Mar ’03 – May ’15 (Rolling Three Month Average)
  • 11. MLSListings Inc Confidential Copyright 2015 11 11 Single Family Market Outlook – Home Counties May ’14 vs. May ’15
  • 12. MLSListings Inc Confidential Copyright 2015 12 12 Single Family + Condo/Townhouse Closed Sales – Home Counties Jan ’03 – May ’15
  • 13. MLSListings Inc Confidential Copyright 2015 13 13 Single Family + Condo/Townhouse Closed Sales - Home Counties Jan ’05 – May ’15 2005 2006 2007 2008 2009 2010 2011 2012 2013 2014 2015 Jan 2078 1638 1539 877 1390 1529 1574 1552 1460 1330 1182 Feb 2048 1762 1658 1063 1497 1537 1648 1785 1597 1371 921 Mar 3210 2775 2248 1388 1916 2197 2399 2520 2289 1882 2068 Apr 3407 2595 2101 1664 2158 2245 2329 2517 2468 2402 2527 May 3376 2706 2270 1953 2355 2805 2369 2885 2780 2484 2407 Jun 3836 2847 2353 2123 2808 2592 2633 2639 2543 2456 Jul 3396 2446 2136 2230 2788 2299 2238 2457 2643 1933 Aug 3538 2668 1962 2244 2421 2196 2446 2525 2559 2255 Sep 3312 2186 1223 2127 2503 2037 2144 2194 2258 2270 Oct 2881 2219 1426 2114 2577 1994 2008 2456 2404 2312 Nov 2667 2182 1328 1594 2138 1930 2038 2273 1899 1787 Dec 2408 2066 1201 1810 2325 2234 2201 2230 1859 1371 May '05 3376 May '06 2706 May '07 2270 May '08 1953 May '09 2355 May '10 2805 May '11 2369 May '12 2885 May '13 2780 May '14 2484 May '15 2407 Home Counties - Single Family + Condo/Townhouse Closed Sales -14.2% 1.6% -16.6% -13.4% -28.7% -11.0% 6.0% 23.2% -3.1% 2.2% Home Counties Closed Sales Variance to prior Years 0 500 1000 1500 2000 2500 3000 3500 May '05 May '06 May '07 May '08 May '09 May '10 May '11 May '12 May '13 May '14 May '15 3376 2407
  • 14. MLSListings Inc Confidential Copyright 2015 14 14 Single Family Closed Sales – San Mateo, Santa Clara Counties Jan ’04 – May ’15
  • 15. MLSListings Inc Confidential Copyright 2015 15 15 Single Family Closed Sales – San Mateo, Santa Clara Counties May (2004 – 2015)
  • 16. MLSListings Inc Confidential Copyright 2015 16 16 Single Family Closed Sales – Monterey, San Benito, Santa Cruz Counties Jan ’04 – May ’15
  • 17. MLSListings Inc Confidential Copyright 2015 17 17 Single Family Closed Sales – Monterey, San Benito, Santa Cruz Counties May (2004 – 2015)
  • 18. MLSListings Inc Confidential Copyright 2015 18 18 Single Family Closed Sales – Home Counties May (2004 – 2015) Monterey County San Benito County San Mateo County Santa Clara County Santa Cruz County May '04 309 -31.4% 74 -36.5% 575 -33.9% 1670 -39.8% 247 -27.1% May '05 295 -28.1% 67 -29.9% 505 -24.8% 1419 -29.1% 197 -8.6% May '06 201 5.5% 50 -6.0% 470 -19.1% 1098 -8.4% 193 -6.7% May '07 135 57.0% 34 38.2% 432 -12.0% 992 1.4% 149 20.8% May '08 186 14.0% 36 30.6% 354 7.3% 874 15.1% 124 45.2% May '09 372 -43.0% 70 -32.9% 321 18.4% 987 1.9% 139 29.5% May '10 306 -30.7% 63 -25.4% 418 -9.1% 1230 -18.2% 162 11.1% May '11 259 -18.1% 58 -19.0% 418 -9.1% 966 4.1% 137 31.4% May '12 284 -25.4% 62 -24.2% 490 -22.4% 1209 -16.8% 208 -13.5% May '13 237 -10.5% 54 -13.0% 512 -25.8% 1099 -8.5% 221 -18.6% May '14 242 -12.4% 48 -2.1% 421 -9.7% 990 1.6% 161 11.8% May '15 212 47 380 1006 180 Home Counties - Single Family Sales (2015 vs. Prior Years)
  • 19. MLSListings Inc Confidential Copyright 2015 19 19 Single Family Total Sales Dollars – San Mateo and Santa Clara Counties Jan ’04 – May ’15
  • 20. MLSListings Inc Confidential Copyright 2015 20 20 Single Family Total Sales Dollars – San Mateo, Santa Clara Counties May (2004 – 2015)
  • 21. MLSListings Inc Confidential Copyright 2015 21 21 Single Family Total Sales Dollars – Santa Cruz, Monterey, and San Benito Counties Jan ’04 – May ’15
  • 22. MLSListings Inc Confidential Copyright 2015 22 22 Single Family Total Sales Dollars – Monterey, San Benito, Santa Cruz Counties May (2004 – 2015)
  • 23. MLSListings Inc Confidential Copyright 2015 23 23 Single Family Total Sales Volume – Home Counties May (2004 – 2015) Monterey County San Benito County San Mateo County Santa Clara County Santa Cruz County May '04 $231,738,318 -21.1% $39,918,000 -41.6% $568,750,622 14.9% $1,283,573,863 2.2% $170,897,628 -16.1% May '05 $228,834,806 -20.1% $46,220,754 -49.5% $586,833,027 11.4% $1,263,473,261 3.9% $175,537,232 -18.3% May '06 $221,235,921 -17.3% $35,638,300 -34.6% $483,702,130 35.2% $1,072,163,192 22.4% $140,553,527 2.0% May '07 $130,310,355 40.4% $24,732,263 -5.7% $513,813,341 27.2% $1,087,982,293 20.6% $122,673,098 16.9% May '08 $183,711,226 -0.4% $12,604,400 85.1% $419,505,295 55.8% $851,301,713 54.2% $89,951,337 59.4% May '09 $129,899,807 40.8% $20,337,898 14.7% $299,717,071 118.1% $635,442,293 106.5% $69,028,368 107.7% May '10 $163,708,485 11.7% $20,340,913 14.7% $404,254,657 61.7% $940,775,874 39.5% $90,987,185 57.6% May '11 $129,875,961 40.9% $18,666,700 25.0% $429,661,754 52.2% $745,902,666 75.9% $74,240,928 93.1% May '12 $122,874,617 48.9% $20,157,401 15.7% $506,889,662 29.0% $1,005,265,206 30.5% $115,591,563 24.0% May '13 $117,279,111 56.0% $19,993,223 16.7% $632,926,931 3.3% $1,145,977,345 14.5% $143,195,455 0.1% May '14 $145,628,533 25.6% $21,803,003 7.0% $638,461,458 2.4% $1,166,234,750 12.5% $129,235,842 10.9% May '15 $182,932,721 $23,325,185 $653,771,131 $1,312,291,582 $143,377,298 Home Counties - Single Family Total Sales Dollars (2015 vs. Prior Years)
  • 24. MLSListings Inc Confidential Copyright 2015 24 24 Single Family + Condo/Townhouse New Listings - Home Counties Jan ’03 – May ’15
  • 25. MLSListings Inc Confidential Copyright 2015 25 25 Single Family + Condo/Townhouse New Listings - Home Counties Jan ’05 – May ’15 2005 2006 2007 2008 2009 2010 2011 2012 2013 2014 2015 Jan 3291 4061 3519 3947 3907 3334 3380 2890 2170 2164 1727 Feb 3561 4080 3508 4353 3867 3711 3373 3011 2534 2496 1616 Mar 4912 5140 4828 4785 4397 4649 3953 3313 3011 3081 3129 Apr 5359 4787 4745 5185 3909 4613 3916 3151 3499 3380 3324 May 5224 6019 5279 4934 3636 4044 3986 3551 3592 3520 3298 Jun 5392 6152 4894 4840 3820 4423 3784 3132 3358 3209 Jul 5210 5523 4747 4530 3915 4089 3429 3096 3529 2420 Aug 5450 5356 4720 4344 3612 3867 3342 2941 3163 2850 Sep 5544 4810 4143 4632 3608 3726 3095 2619 3016 2924 Oct 5106 3763 4202 4468 3480 3267 2988 2732 2650 2497 Nov 3648 2646 3034 3098 2700 2657 2355 1923 1774 1531 Dec 1929 1666 2223 2656 2219 2088 1724 1237 1113 705 May '05 5224 May '06 6019 May '07 5279 May '08 4934 May '09 3636 May '10 4044 May '11 3986 May '12 3551 May '13 3592 May '14 3520 May '15 3298 Home Counties - Single Family + Condo/Townhouse New Listings -6.3% -9.3% -18.4% Variance to prior Years Home Counties New Listings -36.9% -17.3% -7.1% -8.2% -45.2% -37.5% -33.2% 0 500 1000 1500 2000 2500 3000 3500 4000 4500 5000 May '05 May '06 May '07 May '08 May '09 May '10 May '11 May '12 May '13 May '14 May '15 6019 3298
  • 26. MLSListings Inc Confidential Copyright 2015 26 26 Single Family New Listings - Home Counties Jan ’04 – May ’15
  • 27. MLSListings Inc Confidential Copyright 2015 27 27 Single Family New Listings - Home Counties May (2004 – 2015)
  • 28. MLSListings Inc Confidential Copyright 2015 28 28 Single Family New Listings - Home Counties May (2004 – 2015) Monterey County San Benito County San Mateo County Santa Clara County Santa Cruz County May '04 458 -31.2% 93 -33.3% 853 -41.6% 2566 -45.9% 406 -29.6% May '05 478 -34.1% 108 -42.6% 809 -38.4% 2334 -40.5% 348 -17.8% May '06 695 -54.7% 143 -56.6% 859 -42.0% 2471 -43.8% 505 -43.4% May '07 658 -52.1% 111 -44.1% 744 -33.1% 2131 -34.9% 386 -25.9% May '08 580 -45.7% 129 -51.9% 789 -36.9% 2124 -34.7% 321 -10.9% May '09 487 -35.3% 83 -25.3% 568 -12.3% 1514 -8.3% 258 10.9% May '10 524 -39.9% 65 -4.6% 665 -25.1% 1639 -15.3% 292 -2.1% May '11 443 -28.9% 77 -19.5% 672 -25.9% 1629 -14.8% 297 -3.7% May '12 364 -13.5% 61 1.6% 643 -22.6% 1494 -7.1% 264 8.3% May '13 331 -4.8% 49 26.5% 632 -21.2% 1491 -6.9% 266 7.5% May '14 291 8.2% 60 3.3% 619 -19.5% 1449 -4.2% 262 9.2% May '15 315 62 498 1388 286 Home Counties - Single Family New Listings (2015 vs. Prior Years)
  • 29. MLSListings Inc Confidential Copyright 2015 29 29 Single Family + Condo/Townhouse Median Price - Home Counties Jan ’05 – May ’15 2005 2006 2007 2008 2009 2010 2011 2012 2013 2014 2015 Jan $625,000 $695,000 $699,000 $660,000 $380,000 $450,000 $435,500 $415,000 $540,000 $640,000 $683,000 Feb $651,000 $699,950 $705,000 $680,000 $381,000 $465,400 $420,000 $438,875 $555,000 $668,000 $823,188 Mar $669,000 $707,000 $740,000 $677,750 $369,000 $499,900 $460,000 $475,000 $615,000 $729,000 $840,000 Apr $685,000 $704,865 $775,000 $655,000 $404,000 $500,000 $480,000 $502,500 $676,250 $735,000 $825,000 May $685,000 $725,000 $775,000 $650,000 $415,000 $522,500 $477,750 $527,500 $688,945 $748,500 $850,000 Jun $708,000 $740,000 $768,500 $639,000 $460,000 $525,500 $515,000 $559,000 $670,000 $765,000 Jul $700,000 $725,000 $759,975 $595,000 $487,750 $535,000 $484,500 $565,000 $692,000 $718,000 Aug $710,000 $720,000 $761,000 $545,445 $476,000 $510,500 $490,000 $560,000 $670,000 $738,000 Sep $695,000 $715,000 $750,000 $490,000 $469,825 $500,000 $465,000 $560,000 $670,000 $730,000 Oct $699,000 $711,500 $758,000 $477,200 $487,944 $500,000 $455,000 $567,000 $668,150 $750,000 Nov $700,000 $709,000 $750,000 $435,000 $500,000 $492,000 $437,500 $565,000 $659,250 $745,000 Dec $690,500 $695,000 $702,900 $410,000 $480,000 $463,750 $440,000 $563,000 $655,000 $801,000 May '05 $685,000 May '06 $725,000 May '07 $775,000 May '08 $650,000 May '09 $415,000 May '10 $522,500 May '11 $477,750 May '12 $527,500 May '13 $688,945 May '14 $748,500 May '15 $850,000 Home Counties - Single Family + Condo/Townhouse Median Price 13.6% Home Counties Median Price Variance to prior Years 24.1% 17.2% 61.1% 23.4% 9.7% 30.8% 104.8% 62.7% 77.9% $0 $200,000 $400,000 $600,000 $800,000 $1,000,000 May '05 May '06 May '07 May '08 May '09 May '10 May '11 May '12 May '13 May '14 May '15 $775,000 $850,000
  • 30. MLSListings Inc Confidential Copyright 2015 30 30 Single Family Median Prices - Home Counties Jan ’04 – May ’15
  • 31. MLSListings Inc Confidential Copyright 2015 31 31 Single Family Median Prices - Home Counties May (2004 – 2015)
  • 32. MLSListings Inc Confidential Copyright 2015 32 32 Single Family Median Prices - Home Counties May (2004 – 2015) Monterey County San Benito County San Mateo County Santa Clara County Santa Cruz County May '04 $569,000 -5.2% $474,000 -6.1% $775,000 73.9% $635,000 57.1% $639,000 8.8% May '05 $639,000 -15.6% $635,000 -29.9% $900,000 49.7% $749,000 33.2% $757,200 -8.2% May '06 $685,000 -21.2% $635,000 -29.9% $905,000 48.9% $800,000 24.7% $755,000 -7.9% May '07 $695,000 -22.4% $625,000 -28.8% $952,000 41.5% $858,000 16.3% $779,000 -10.8% May '08 $360,000 49.9% $332,500 33.8% $852,500 58.1% $772,500 29.1% $625,000 11.2% May '09 $204,950 163.2% $253,329 75.7% $728,000 85.1% $490,000 103.6% $450,000 54.4% May '10 $281,000 92.0% $295,000 50.8% $750,000 79.7% $630,000 58.3% $523,000 32.9% May '11 $252,000 114.1% $277,500 60.4% $825,000 63.3% $602,500 65.6% $437,500 58.9% May '12 $300,000 79.8% $275,000 61.8% $776,500 73.5% $645,783 54.5% $499,500 39.1% May '13 $410,000 31.6% $355,000 25.3% $957,000 40.8% $825,000 20.9% $625,000 11.2% May '14 $462,500 16.6% $417,500 6.6% $1,126,500 19.6% $888,888 12.2% $684,000 1.6% May '15 $539,500 $444,985 $1,347,500 $997,500 $695,000 Home Counties - Single Family Median Price (2015 vs. Prior Years)
  • 33. MLSListings Inc Confidential Copyright 2015 33 33 Single Family Average Price - Home Counties Jan ’04 – May ’15
  • 34. MLSListings Inc Confidential Copyright 2015 34 34 Single Family Average Price - Home Counties May (2004 – 2015)
  • 35. MLSListings Inc Confidential Copyright 2015 35 35 Single Family Average Price - Home Counties May (2004 – 2015) Monterey County San Benito County San Mateo County Santa Clara County Santa Cruz County May '04 $749,962 15.1% $539,432 -8.0% $989,132 73.9% $768,607 69.7% $691,893 15.1% May '05 $775,711 11.2% $689,862 -28.1% $1,162,046 48.1% $890,397 46.5% $891,052 -10.6% May '06 $817,340 5.6% $701,530 -29.3% $1,225,530 40.4% $965,495 35.1% $846,921 -5.9% May '07 $965,262 -10.6% $727,420 -31.8% $1,189,383 44.7% $1,096,756 18.9% $823,309 -3.3% May '08 $552,901 56.1% $350,122 41.7% $1,185,043 45.2% $976,263 33.6% $731,311 8.9% May '09 $283,216 204.7% $290,541 70.8% $933,698 84.3% $645,774 102.0% $496,606 60.4% May '10 $526,964 63.7% $322,871 53.7% $969,435 77.5% $764,858 70.5% $561,649 41.8% May '11 $364,968 136.4% $321,839 54.2% $1,040,343 65.4% $773,757 68.6% $541,904 47.0% May '12 $494,505 74.5% $325,119 52.6% $1,038,708 65.6% $832,173 56.8% $530,232 50.2% May '13 $669,437 28.9% $370,244 34.0% $1,243,471 38.4% $1,044,646 24.9% $647,943 22.9% May '14 $811,576 6.3% $454,229 9.3% $1,520,146 13.2% $1,180,399 10.5% $802,707 -0.8% May '15 $862,890 $496,281 $1,720,450 $1,304,465 $796,541 Home Counties - Single Family Average Price (2015 vs. Prior Years)
  • 36. MLSListings Inc Confidential Copyright 2015 36 36 Condo/Townhouse Market Outlook – Home Counties May ’14 vs. May ’15
  • 37. MLSListings Inc Confidential Copyright 2015 37 37 Condo/Townhouse Total Sales Dollars – San Mateo and Santa Clara Counties Jan ’04 – May ’15
  • 38. MLSListings Inc Confidential Copyright 2015 38 38 Condo/Townhouse Total Sales Dollars – San Mateo, Santa Clara Counties May (2004 – 2015)
  • 39. MLSListings Inc Confidential Copyright 2015 39 39 Condo/Townhouse Total Sales Dollars – Monterey, San Benito, Santa Cruz Counties Jan ’04 – May ’15
  • 40. MLSListings Inc Confidential Copyright 2015 40 40 Condo/Townhouse Total Sales Dollars – Monterey, San Benito, Santa Cruz Counties May (2004 – 2015)
  • 41. MLSListings Inc Confidential Copyright 2015 41 41 Condo/Townhouse Total Sales Dollars – Home Counties May (2004 – 2015) Monterey County San Benito County San Mateo County Santa Clara County Santa Cruz County May '04 $16,586,000 -11.8% $2,380,800 -84.2% $103,618,762 -16.7% $265,843,352 -1.2% $21,834,317 15.2% May '05 $26,318,250 -44.4% $1,130,000 -66.8% $104,961,874 -17.7% $310,709,984 -15.5% $30,764,928 -18.2% May '06 $15,874,000 -7.8% $2,575,500 -85.4% $102,441,254 -15.7% $266,822,314 -1.6% $19,961,567 26.1% May '07 $11,216,000 30.5% $275,000 36.4% $68,703,388 25.7% $202,806,637 29.5% $18,992,890 32.5% May '08 $3,233,862 352.6% $180,000 108.3% $53,220,457 62.2% $133,045,341 97.3% $12,167,239 106.8% May '09 $4,677,220 212.9% $698,899 -46.3% $39,055,053 121.1% $111,746,585 135.0% $11,846,900 112.4% May '10 $12,440,326 17.6% $62,000 504.8% $57,635,880 49.8% $174,800,419 50.2% $9,904,900 154.0% May '11 $8,530,235 71.6% $215,000 74.4% $37,307,401 131.4% $139,007,246 88.9% $10,097,675 149.2% May '12 $9,802,750 49.3% $210,000 78.6% $61,193,915 41.1% $171,705,505 52.9% $16,129,699 56.0% May '13 $17,516,050 -16.4% $1,087,000 -65.5% $68,303,455 26.4% $236,816,808 10.9% $20,178,688 24.7% May '14 $13,498,325 8.4% $1,797,658 -79.1% $85,217,443 1.3% $244,208,579 7.5% $18,450,400 36.4% May '15 $14,635,250 $375,000 $86,331,688 $262,555,788 $25,161,784 Home Counties - Condo+Townhouse Total Sales Dollars (2015 vs. Prior Years)
  • 42. MLSListings Inc Confidential Copyright 2014 42 42 Condo/Townhouse Months of Inventory – San Mateo, Santa Clara, Santa Cruz Mar ’03 – May ’15 (Rolling Three Month Average)
  • 43. MLSListings Inc Confidential Copyright 2015 43 43 Condo/Townhouse Months of Inventory – Monterey and San Benito Counties Mar ’03 – May ’15 (Rolling Three Month Average)