New Hampshire US Senate Survey Crosstabs 072214
•
1 j'aime•599 vues

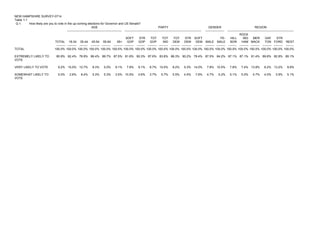
Magellan Strategies BR today released the survey results today of an automated survey of 1,618 likely New Hampshire voters. The survey was conducted July 16-17. The margin of error for a survey of this size is 2.43%. The survey was commissioned by Citizens for a Strong New Hampshire. Aided by a dismal political environment, Scott Brown is within 5 points of defeating Jeanne Shaheen.

Recommandé
Recommandé
Contenu connexe
En vedette
En vedette (13)
Similaire à New Hampshire US Senate Survey Crosstabs 072214
Similaire à New Hampshire US Senate Survey Crosstabs 072214 (20)
Plus de Magellan Strategies
Plus de Magellan Strategies (18)
Dernier
Dernier (20)
New Hampshire US Senate Survey Crosstabs 072214
- 1. NEW HAMPSHIRE SURVEY-0714 Table 1-1 Q 1. How likely are you to vote in the up-coming elections for Governor and US Senate? AGE PARTY GENDER REGION ------------------------------------------------------ ---------------------------------------------------------------------------- ------------------- ------------------------------------------------------------------ TOTAL --------- 18-34 --------- 35-44 -------- 45-54 --------- 55-64 --------- 65+ --------- SOFT GOP --------- STR GOP -------- TOT GOP --------- TOT IND --------- TOT DEM --------- STR DEM --------- SOFT DEM -------- MALE --------- FE- MALE --------- HILL BOR -------- ROCK ING HAM --------- MER MACK --------- GAF TON --------- STR FORD --------- REST -------- TOTAL 100.0% 100.0% 100.0% 100.0% 100.0% 100.0% 100.0% 100.0% 100.0% 100.0% 100.0% 100.0% 100.0% 100.0% 100.0% 100.0% 100.0% 100.0% 100.0% 100.0% 100.0% EXTREMELY LIKELY TO VOTE 85.9% 82.4% 78.9% 86.4% 89.7% 87.5% 81.6% 90.3% 87.6% 83.8% 86.3% 90.2% 78.4% 87.5% 84.2% 87.1% 87.1% 81.4% 89.8% 82.9% 85.1% VERY LIKELY TO VOTE 9.2% 15.0% 12.7% 8.3% 5.0% 9.1% 7.8% 9.1% 8.7% 10.5% 8.2% 5.3% 14.0% 7.8% 10.5% 7.8% 7.4% 13.9% 6.2% 13.2% 9.9% SOMEWHAT LIKELY TO VOTE 5.0% 2.6% 8.4% 5.3% 5.3% 3.5% 10.5% 0.6% 3.7% 5.7% 5.5% 4.5% 7.6% 4.7% 5.2% 5.1% 5.5% 4.7% 4.0% 3.9% 5.1%
- 2. NEW HAMPSHIRE SURVEY-0714 Table 1-2 Q 1. How likely are you to vote in the up-coming elections for Governor and US Senate? PARTY BY GENDER PARTY BY AGE ----------------------------------------------------------------- -------------------------------------------------------------------------------------------------------------------------------------- TOTAL --------- GOP MEN --------- GOP WO- MEN -------- DEM MEN --------- DEM WO- MEN --------- IND MEN --------- IND WO- MEN --------- GOP 18-44 -------- GOP 45-54 --------- GOP 55-64 --------- GOP 65+ --------- DEM 18-44 --------- DEM 45-54 -------- DEM 55-64 --------- DEM 65+ --------- IND 18-44 -------- IND 45-54 --------- IND 55-64 --------- IND 65+ --------- TOTAL 100.0% 100.0% 100.0% 100.0% 100.0% 100.0% 100.0% 100.0% 100.0% 100.0% 100.0% 100.0% 100.0% 100.0% 100.0% 100.0% 100.0% 100.0% 100.0% EXTREMELY LIKELY TO VOTE 85.9% 88.4% 86.5% 85.1% 87.1% 88.2% 79.7% 82.1% 86.9% 93.2% 88.2% 81.3% 88.9% 87.5% 88.9% 79.1% 83.8% 88.7% 84.9% VERY LIKELY TO VOTE 9.2% 8.6% 8.8% 8.6% 7.9% 6.3% 14.4% 12.9% 9.3% 3.7% 8.7% 12.2% 5.1% 5.2% 9.2% 15.5% 9.7% 6.0% 9.5% SOMEWHAT LIKELY TO VOTE 5.0% 3.0% 4.7% 6.3% 5.0% 5.5% 5.9% 5.0% 3.8% 3.1% 3.2% 6.5% 6.0% 7.3% 2.0% 5.5% 6.5% 5.4% 5.6%
- 3. NEW HAMPSHIRE SURVEY-0714 Table 1-3 Q 1. How likely are you to vote in the up-coming elections for Governor and US Senate? BROWN IMAGE SHAHEEN IMAGE OBAMA JOB APPROVAL GENERIC BALLOT MOOD ----------------------------------------------------------------- ----------------------------------------------------------------- ------------------------------- ------------------------------- -------------------- TOTAL --------- TOT FAV --------- TOT UN FAV -------- HRD NO OPIN --------- NVR HRD --------- NAME ID --------- HARD ID --------- TOT FAV -------- TOT UN FAV --------- HRD NO OPIN --------- NVR HRD --------- NAME ID --------- HARD ID -------- TOT APRV --------- TOT DIS- APRV --------- UND -------- GOP --------- DEM --------- UND --------- RD --------- WT -------- TOTAL 100.0% 100.0% 100.0% 100.0% 100.0% 100.0% 100.0% 100.0% 100.0% 100.0% 100.0% 100.0% 100.0% 100.0% 100.0% 100.0% 100.0% 100.0% 100.0% 100.0% 100.0% EXTREMELY LIKELY TO VOTE 85.9% 88.6% 89.5% 74.7% 73.5% 86.2% 89.1% 86.4% 89.0% 70.0% 68.6% 86.0% 87.7% 87.8% 86.2% 74.0% 88.5% 86.9% 78.9% 87.0% 85.3% VERY LIKELY TO VOTE 9.2% 8.0% 7.1% 16.3% 5.3% 9.3% 7.5% 9.0% 7.8% 16.4% 14.2% 9.1% 8.4% 7.6% 9.1% 17.4% 7.9% 8.8% 12.3% 8.0% 9.8% SOMEWHAT LIKELY TO VOTE 5.0% 3.4% 3.4% 9.0% 21.2% 4.6% 3.4% 4.6% 3.2% 13.6% 17.1% 4.8% 4.0% 4.6% 4.7% 8.6% 3.6% 4.3% 8.8% 5.1% 4.9%
- 4. NEW HAMPSHIRE SURVEY-0714 Table 1-4 Q 1. How likely are you to vote in the up-coming elections for Governor and US Senate? US SENATE BALLOT --------------------------------------------------------------------------------------------------- TOTAL --------- PROB BRWN --------- DEF BRWN -------- TOT BRWN --------- TOT UND --------- TOT SHA HEEN --------- DEF SHA HEEN --------- PROB SHA HEEN -------- UN FAV BOTH --------- UND UND --------- TOTAL 100.0% 100.0% 100.0% 100.0% 100.0% 100.0% 100.0% 100.0% 100.0% 100.0% EXTREMELY LIKELY TO VOTE 85.9% 85.6% 90.1% 88.4% 75.2% 86.5% 87.3% 83.8% 87.6% 68.5% VERY LIKELY TO VOTE 9.2% 6.3% 7.8% 7.2% 16.9% 8.8% 9.4% 6.4% 9.4% 21.4% SOMEWHAT LIKELY TO VOTE 5.0% 8.0% 2.1% 4.3% 7.8% 4.7% 3.3% 9.7% 2.9% 10.1%
- 5. NEW HAMPSHIRE SURVEY-0714 Table 2-1 Q 2. Would you say things in country are going in the right direction or have they gotten off on the wrong track? AGE PARTY GENDER REGION ------------------------------------------------------ ---------------------------------------------------------------------------- ------------------- ------------------------------------------------------------------ TOTAL --------- 18-34 --------- 35-44 -------- 45-54 --------- 55-64 --------- 65+ --------- SOFT GOP --------- STR GOP -------- TOT GOP --------- TOT IND --------- TOT DEM --------- STR DEM --------- SOFT DEM -------- MALE --------- FE- MALE --------- HILL BOR -------- ROCK ING HAM --------- MER MACK --------- GAF TON --------- STR FORD --------- REST -------- TOTAL 100.0% 100.0% 100.0% 100.0% 100.0% 100.0% 100.0% 100.0% 100.0% 100.0% 100.0% 100.0% 100.0% 100.0% 100.0% 100.0% 100.0% 100.0% 100.0% 100.0% 100.0% RIGHT DIRECTION 35.1% 52.2% 30.2% 28.7% 37.5% 32.7% 17.5% 5.7% 9.5% 32.5% 67.7% 75.6% 51.5% 30.2% 39.7% 35.5% 30.5% 46.7% 38.9% 32.3% 33.3% WRONG TRACK 64.9% 47.8% 69.8% 71.3% 62.5% 67.3% 82.5% 94.3% 90.5% 67.5% 32.3% 24.4% 48.5% 69.8% 60.3% 64.5% 69.5% 53.3% 61.1% 67.7% 66.7%
- 6. NEW HAMPSHIRE SURVEY-0714 Table 2-2 Q 2. Would you say things in country are going in the right direction or have they gotten off on the wrong track? PARTY BY GENDER PARTY BY AGE ----------------------------------------------------------------- -------------------------------------------------------------------------------------------------------------------------------------- TOTAL --------- GOP MEN --------- GOP WO- MEN -------- DEM MEN --------- DEM WO- MEN --------- IND MEN --------- IND WO- MEN --------- GOP 18-44 -------- GOP 45-54 --------- GOP 55-64 --------- GOP 65+ --------- DEM 18-44 --------- DEM 45-54 -------- DEM 55-64 --------- DEM 65+ --------- IND 18-44 -------- IND 45-54 --------- IND 55-64 --------- IND 65+ --------- TOTAL 100.0% 100.0% 100.0% 100.0% 100.0% 100.0% 100.0% 100.0% 100.0% 100.0% 100.0% 100.0% 100.0% 100.0% 100.0% 100.0% 100.0% 100.0% 100.0% RIGHT DIRECTION 35.1% 8.0% 11.6% 70.0% 66.3% 29.4% 35.3% 11.9% 6.8% 12.5% 8.2% 73.7% 65.4% 64.6% 66.1% 34.3% 26.8% 35.6% 31.9% WRONG TRACK 64.9% 92.0% 88.4% 30.0% 33.7% 70.6% 64.7% 88.1% 93.2% 87.5% 91.8% 26.3% 34.6% 35.4% 33.9% 65.7% 73.2% 64.4% 68.1%
- 7. NEW HAMPSHIRE SURVEY-0714 Table 2-3 Q 2. Would you say things in country are going in the right direction or have they gotten off on the wrong track? BROWN IMAGE SHAHEEN IMAGE OBAMA JOB APPROVAL GENERIC BALLOT MOOD ----------------------------------------------------------------- ----------------------------------------------------------------- ------------------------------- ------------------------------- -------------------- TOTAL --------- TOT FAV --------- TOT UN FAV -------- HRD NO OPIN --------- NVR HRD --------- NAME ID --------- HARD ID --------- TOT FAV -------- TOT UN FAV --------- HRD NO OPIN --------- NVR HRD --------- NAME ID --------- HARD ID -------- TOT APRV --------- TOT DIS- APRV --------- UND -------- GOP --------- DEM --------- UND --------- RD --------- WT -------- TOTAL 100.0% 100.0% 100.0% 100.0% 100.0% 100.0% 100.0% 100.0% 100.0% 100.0% 100.0% 100.0% 100.0% 100.0% 100.0% 100.0% 100.0% 100.0% 100.0% 100.0% 100.0% RIGHT DIRECTION 35.1% 11.5% 56.8% 29.3% 33.5% 35.1% 36.6% 66.1% 4.0% 22.3% 29.9% 35.1% 36.4% 83.6% 3.1% 40.5% 5.6% 71.4% 31.4% 100.0% WRONG TRACK 64.9% 88.5% 43.2% 70.7% 66.5% 64.9% 63.4% 33.9% 96.0% 77.7% 70.1% 64.9% 63.6% 16.4% 96.9% 59.5% 94.4% 28.6% 68.6% 100.0%
- 8. NEW HAMPSHIRE SURVEY-0714 Table 2-4 Q 2. Would you say things in country are going in the right direction or have they gotten off on the wrong track? US SENATE BALLOT --------------------------------------------------------------------------------------------------- TOTAL --------- PROB BRWN --------- DEF BRWN -------- TOT BRWN --------- TOT UND --------- TOT SHA HEEN --------- DEF SHA HEEN --------- PROB SHA HEEN -------- UN FAV BOTH --------- UND UND --------- TOTAL 100.0% 100.0% 100.0% 100.0% 100.0% 100.0% 100.0% 100.0% 100.0% 100.0% RIGHT DIRECTION 35.1% 4.3% 4.9% 4.7% 13.7% 68.2% 74.1% 48.2% 6.5% 15.5% WRONG TRACK 64.9% 95.7% 95.1% 95.3% 86.3% 31.8% 25.9% 51.8% 93.5% 84.5%
- 9. NEW HAMPSHIRE SURVEY-0714 Table 3-1 Q 3. If the election for US Senate were being held today, and all you knew about the two candidates was that one was a Republican and the other was a Democrat, for whom would you vote? AGE PARTY GENDER REGION ------------------------------------------------------ ---------------------------------------------------------------------------- ------------------- ------------------------------------------------------------------ TOTAL --------- 18-34 --------- 35-44 -------- 45-54 --------- 55-64 --------- 65+ --------- SOFT GOP --------- STR GOP -------- TOT GOP --------- TOT IND --------- TOT DEM --------- STR DEM --------- SOFT DEM -------- MALE --------- FE- MALE --------- HILL BOR -------- ROCK ING HAM --------- MER MACK --------- GAF TON --------- STR FORD --------- REST -------- TOTAL 100.0% 100.0% 100.0% 100.0% 100.0% 100.0% 100.0% 100.0% 100.0% 100.0% 100.0% 100.0% 100.0% 100.0% 100.0% 100.0% 100.0% 100.0% 100.0% 100.0% 100.0% REPUBLICAN CANDIDATE 42.1% 33.5% 42.4% 45.0% 40.1% 45.7% 54.3% 90.9% 79.3% 32.4% 10.5% 3.5% 24.7% 48.6% 35.8% 40.4% 51.3% 33.9% 36.9% 39.9% 40.6% DEMOCRATIC CANDIDATE 36.3% 32.5% 36.1% 33.6% 39.7% 37.7% 16.8% 2.8% 7.2% 28.6% 79.0% 93.2% 49.8% 30.2% 42.1% 39.0% 29.7% 39.7% 31.8% 40.8% 37.8% UNDECIDED 21.6% 34.1% 21.4% 21.4% 20.2% 16.6% 28.9% 6.3% 13.4% 38.9% 10.5% 3.2% 25.5% 21.2% 22.0% 20.6% 19.0% 26.4% 31.3% 19.3% 21.6%
- 10. NEW HAMPSHIRE SURVEY-0714 Table 3-2 Q 3. If the election for US Senate were being held today, and all you knew about the two candidates was that one was a Republican and the other was a Democrat, for whom would you vote? PARTY BY GENDER PARTY BY AGE ----------------------------------------------------------------- -------------------------------------------------------------------------------------------------------------------------------------- TOTAL --------- GOP MEN --------- GOP WO- MEN -------- DEM MEN --------- DEM WO- MEN --------- IND MEN --------- IND WO- MEN --------- GOP 18-44 -------- GOP 45-54 --------- GOP 55-64 --------- GOP 65+ --------- DEM 18-44 --------- DEM 45-54 -------- DEM 55-64 --------- DEM 65+ --------- IND 18-44 -------- IND 45-54 --------- IND 55-64 --------- IND 65+ --------- TOTAL 100.0% 100.0% 100.0% 100.0% 100.0% 100.0% 100.0% 100.0% 100.0% 100.0% 100.0% 100.0% 100.0% 100.0% 100.0% 100.0% 100.0% 100.0% 100.0% REPUBLICAN CANDIDATE 42.1% 81.0% 77.0% 11.1% 10.1% 35.8% 29.5% 75.1% 78.5% 83.1% 80.7% 16.1% 9.0% 7.3% 8.5% 31.2% 31.9% 32.6% 35.3% DEMOCRATIC CANDIDATE 36.3% 6.0% 9.0% 74.6% 81.8% 28.3% 28.9% 10.9% 4.5% 8.4% 6.4% 72.3% 83.9% 81.4% 79.8% 21.0% 29.6% 31.0% 37.4% UNDECIDED 21.6% 13.0% 14.0% 14.3% 8.1% 35.9% 41.6% 13.9% 17.0% 8.5% 12.9% 11.7% 7.1% 11.2% 11.7% 47.8% 38.5% 36.4% 27.3%
- 11. NEW HAMPSHIRE SURVEY-0714 Table 3-3 Q 3. If the election for US Senate were being held today, and all you knew about the two candidates was that one was a Republican and the other was a Democrat, for whom would you vote? BROWN IMAGE SHAHEEN IMAGE OBAMA JOB APPROVAL GENERIC BALLOT MOOD ----------------------------------------------------------------- ----------------------------------------------------------------- ------------------------------- ------------------------------- -------------------- TOTAL --------- TOT FAV --------- TOT UN FAV -------- HRD NO OPIN --------- NVR HRD --------- NAME ID --------- HARD ID --------- TOT FAV -------- TOT UN FAV --------- HRD NO OPIN --------- NVR HRD --------- NAME ID --------- HARD ID -------- TOT APRV --------- TOT DIS- APRV --------- UND -------- GOP --------- DEM --------- UND --------- RD --------- WT -------- TOTAL 100.0% 100.0% 100.0% 100.0% 100.0% 100.0% 100.0% 100.0% 100.0% 100.0% 100.0% 100.0% 100.0% 100.0% 100.0% 100.0% 100.0% 100.0% 100.0% 100.0% 100.0% REPUBLICAN CANDIDATE 42.1% 76.6% 16.5% 40.2% 22.3% 42.6% 43.2% 10.0% 79.6% 32.7% 22.8% 42.3% 43.3% 4.4% 70.8% 9.0% 100.0% 6.8% 61.2% DEMOCRATIC CANDIDATE 36.3% 10.8% 62.5% 22.3% 48.1% 36.0% 39.5% 68.9% 4.9% 15.3% 44.3% 36.2% 38.3% 79.8% 7.9% 39.1% 100.0% 73.9% 16.0% UNDECIDED 21.6% 12.6% 21.0% 37.5% 29.6% 21.4% 17.3% 21.1% 15.5% 52.1% 32.8% 21.5% 18.4% 15.8% 21.2% 51.9% 100.0% 19.4% 22.8%
- 12. NEW HAMPSHIRE SURVEY-0714 Table 3-4 Q 3. If the election for US Senate were being held today, and all you knew about the two candidates was that one was a Republican and the other was a Democrat, for whom would you vote? US SENATE BALLOT --------------------------------------------------------------------------------------------------- TOTAL --------- PROB BRWN --------- DEF BRWN -------- TOT BRWN --------- TOT UND --------- TOT SHA HEEN --------- DEF SHA HEEN --------- PROB SHA HEEN -------- UN FAV BOTH --------- UND UND --------- TOTAL 100.0% 100.0% 100.0% 100.0% 100.0% 100.0% 100.0% 100.0% 100.0% 100.0% REPUBLICAN CANDIDATE 42.1% 80.1% 90.6% 86.7% 27.7% 6.3% 4.5% 12.4% 62.1% DEMOCRATIC CANDIDATE 36.3% 2.9% 3.4% 3.2% 9.1% 73.4% 81.3% 46.5% 10.2% UNDECIDED 21.6% 16.9% 6.0% 10.1% 63.2% 20.3% 14.1% 41.1% 27.7% 100.0%
- 13. NEW HAMPSHIRE SURVEY-0714 Table 4-1 Q 4. Do you have a favorable or unfavorable opinion of Scott Brown? AGE PARTY GENDER REGION ------------------------------------------------------ ---------------------------------------------------------------------------- ------------------- ------------------------------------------------------------------ TOTAL --------- 18-34 --------- 35-44 -------- 45-54 --------- 55-64 --------- 65+ --------- SOFT GOP --------- STR GOP -------- TOT GOP --------- TOT IND --------- TOT DEM --------- STR DEM --------- SOFT DEM -------- MALE --------- FE- MALE --------- HILL BOR -------- ROCK ING HAM --------- MER MACK --------- GAF TON --------- STR FORD --------- REST -------- TOTAL 100.0% 100.0% 100.0% 100.0% 100.0% 100.0% 100.0% 100.0% 100.0% 100.0% 100.0% 100.0% 100.0% 100.0% 100.0% 100.0% 100.0% 100.0% 100.0% 100.0% 100.0% FAVORABLE 34.5% 30.9% 41.0% 32.6% 28.6% 40.9% 45.4% 59.6% 55.1% 30.1% 15.9% 8.9% 30.2% 36.5% 32.6% 35.2% 44.8% 24.9% 22.7% 29.2% 32.3% UNFAVORABLE 43.0% 37.1% 44.2% 42.9% 49.6% 39.0% 29.2% 18.2% 21.7% 46.3% 63.9% 74.8% 41.8% 41.3% 44.7% 45.5% 39.7% 43.1% 40.0% 51.5% 40.8% HEARD OF BUT NO OPINION 20.0% 27.1% 11.8% 21.7% 21.0% 18.1% 20.6% 20.9% 20.8% 21.2% 17.5% 12.6% 27.6% 19.1% 20.8% I17.3% 17.3% 14.7% 30.1% 35.0% 16.1% 21.6% NEVER HEARD OF 2.5% 4.9% 3.1% 2.8% 0.9% 2.1% 4.8% 1.3% 2.4% 2.4% 2.6% 3.7% 0.4% 3.1% 1.9% 2.0% 0.8% 1.9% 2.2% 3.2% 5.4%
- 14. NEW HAMPSHIRE SURVEY-0714 Table 4-2 Q 4. Do you have a favorable or unfavorable opinion of Scott Brown? PARTY BY GENDER PARTY BY AGE ----------------------------------------------------------------- -------------------------------------------------------------------------------------------------------------------------------------- TOTAL --------- GOP MEN --------- GOP WO- MEN -------- DEM MEN --------- DEM WO- MEN --------- IND MEN --------- IND WO- MEN --------- GOP 18-44 -------- GOP 45-54 --------- GOP 55-64 --------- GOP 65+ --------- DEM 18-44 --------- DEM 45-54 -------- DEM 55-64 --------- DEM 65+ --------- IND 18-44 -------- IND 45-54 --------- IND 55-64 --------- IND 65+ --------- TOTAL 100.0% 100.0% 100.0% 100.0% 100.0% 100.0% 100.0% 100.0% 100.0% 100.0% 100.0% 100.0% 100.0% 100.0% 100.0% 100.0% 100.0% 100.0% 100.0% FAVORABLE 34.5% 54.7% 55.7% 11.6% 18.7% 31.8% 28.5% 60.5% 48.0% 50.1% 62.6% 22.7% 15.4% 9.9% 14.6% 30.8% 27.0% 26.6% 37.9% UNFAVORABLE 43.0% 24.9% 17.0% 64.8% 63.4% 44.8% 47.6% 14.2% 28.5% 26.2% 16.4% 51.4% 60.0% 76.7% 69.2% 49.8% 47.2% 46.3% 38.8% HEARD OF BUT NO OPINION 20.0% 17.6% 25.4% 19.5% 16.2% 20.7% 21.7% 16.1% 23.4% 23.7% 19.2% 25.8% 16.5% 12.3% 14.0% 15.9% 23.9% 25.7% 20.9% NEVER HEARD OF 2.5% 2.8% 1.9% 4.2% 1.6% 2.6% 2.2% 9.2% 1.8% 8.1% 1.2% 2.1% 3.6% 1.9% 1.4% 2.4%
- 15. NEW HAMPSHIRE SURVEY-0714 Table 4-3 Q 4. Do you have a favorable or unfavorable opinion of Scott Brown? BROWN IMAGE SHAHEEN IMAGE OBAMA JOB APPROVAL GENERIC BALLOT MOOD ----------------------------------------------------------------- ----------------------------------------------------------------- ------------------------------- ------------------------------- -------------------- TOTAL --------- TOT FAV --------- TOT UN FAV -------- HRD NO OPIN --------- NVR HRD --------- NAME ID --------- HARD ID --------- TOT FAV -------- TOT UN FAV --------- HRD NO OPIN --------- NVR HRD --------- NAME ID --------- HARD ID -------- TOT APRV --------- TOT DIS- APRV --------- UND -------- GOP --------- DEM --------- UND --------- RD --------- WT -------- TOTAL 100.0% 100.0% 100.0% 100.0% 100.0% 100.0% 100.0% 100.0% 100.0% 100.0% 100.0% 100.0% 100.0% 100.0% 100.0% 100.0% 100.0% 100.0% 100.0% 100.0% 100.0% FAVORABLE 34.5% 100.0% 35.4% 44.5% 14.2% 58.1% 29.8% 19.6% 34.7% 35.2% 9.3% 53.2% 16.3% 62.8% 10.3% 20.1% 11.3% 47.1% UNFAVORABLE 43.0% 100.0% 44.1% 55.5% 67.2% 23.0% 16.2% 15.0% 43.4% 46.1% 73.8% 23.1% 44.2% 16.9% 74.1% 41.8% 69.7% 28.7% HEARD OF BUT NO OPINION 20.0% 100.0% 20.5% 16.1% 18.3% 47.9% 22.2% 19.9% 17.1% 14.5% 21.7% 33.4% 19.0% 12.3% 34.7% 16.7% 21.7% NEVER HEARD OF 2.5% 100.0% 2.5% 0.6% 6.1% 43.3% 2.0% 1.6% 2.4% 2.1% 6.1% 1.3% 3.3% 3.4% 2.4% 2.5%
- 16. NEW HAMPSHIRE SURVEY-0714 Table 4-4 Q 4. Do you have a favorable or unfavorable opinion of Scott Brown? US SENATE BALLOT --------------------------------------------------------------------------------------------------- TOTAL --------- PROB BRWN --------- DEF BRWN -------- TOT BRWN --------- TOT UND --------- TOT SHA HEEN --------- DEF SHA HEEN --------- PROB SHA HEEN -------- UN FAV BOTH --------- UND UND --------- TOTAL 100.0% 100.0% 100.0% 100.0% 100.0% 100.0% 100.0% 100.0% 100.0% 100.0% FAVORABLE 34.5% 38.9% 90.0% 71.1% 10.4% 8.6% 5.7% 18.5% 11.7% UNFAVORABLE 43.0% 22.6% 3.8% 10.8% 36.6% 73.7% 77.5% 60.7% 100.0% 30.6% HEARD OF BUT NO OPINION 20.0% 35.9% 5.7% 16.9% 46.8% 15.2% 15.0% 15.8% 49.7% NEVER HEARD OF 2.5% 2.6% 0.5% 1.3% 6.2% 2.5% 1.8% 5.0% 8.0%
- 17. NEW HAMPSHIRE SURVEY-0714 Table 5-1 Q 5. Do you have a favorable or unfavorable opinion of Jeanne Shaheen? AGE PARTY GENDER REGION ------------------------------------------------------ ---------------------------------------------------------------------------- ------------------- ------------------------------------------------------------------ TOTAL --------- 18-34 --------- 35-44 -------- 45-54 --------- 55-64 --------- 65+ --------- SOFT GOP --------- STR GOP -------- TOT GOP --------- TOT IND --------- TOT DEM --------- STR DEM --------- SOFT DEM -------- MALE --------- FE- MALE --------- HILL BOR -------- ROCK ING HAM --------- MER MACK --------- GAF TON --------- STR FORD --------- REST -------- TOTAL 100.0% 100.0% 100.0% 100.0% 100.0% 100.0% 100.0% 100.0% 100.0% 100.0% 100.0% 100.0% 100.0% 100.0% 100.0% 100.0% 100.0% 100.0% 100.0% 100.0% 100.0% FAVORABLE 46.9% 53.0% 39.3% 40.8% 53.7% 47.5% 33.8% 9.0% 16.9% 48.1% 80.0% 89.7% 60.1% 39.1% 54.3% 47.4% 39.9% 58.3% 41.5% 49.3% 48.6% UNFAVORABLE 43.0% 32.9% 49.8% 48.3% 38.0% 44.2% 51.3% 81.7% 72.1% 40.7% 12.3% 5.6% 26.0% 49.2% 37.1% 44.1% 48.9% 34.1% 37.4% 46.7% 39.6% HEARD OF BUT NO OPINION 9.0% 14.1% 8.4% 9.2% 8.1% 7.2% 12.9% 8.4% 9.8% 10.1% 6.6% 3.1% 13.9% 10.3% 7.7% 6.6% 10.5% 7.4% 20.1% 4.0% 10.2% NEVER HEARD OF 1.1% 2.6% 1.7% 0.2% 1.1% 2.0% 0.9% 1.2% 1.1% 1.1% 1.6% 1.3% 0.9% 1.9% 0.7% 0.3% 1.0% 1.6% UNFAV BOTH 9.9% 11.1% 14.0% 12.8% 7.3% 6.3% 11.5% 14.5% 13.6% 11.9% 3.4% 1.7% 6.9% 13.3% 6.7% 11.2% 10.4% 7.4% 8.1% 14.2% 7.6%
- 18. NEW HAMPSHIRE SURVEY-0714 Table 5-2 Q 5. Do you have a favorable or unfavorable opinion of Jeanne Shaheen? PARTY BY GENDER PARTY BY AGE ----------------------------------------------------------------- -------------------------------------------------------------------------------------------------------------------------------------- TOTAL --------- GOP MEN --------- GOP WO- MEN -------- DEM MEN --------- DEM WO- MEN --------- IND MEN --------- IND WO- MEN --------- GOP 18-44 -------- GOP 45-54 --------- GOP 55-64 --------- GOP 65+ --------- DEM 18-44 --------- DEM 45-54 -------- DEM 55-64 --------- DEM 65+ --------- IND 18-44 -------- IND 45-54 --------- IND 55-64 --------- IND 65+ --------- TOTAL 100.0% 100.0% 100.0% 100.0% 100.0% 100.0% 100.0% 100.0% 100.0% 100.0% 100.0% 100.0% 100.0% 100.0% 100.0% 100.0% 100.0% 100.0% 100.0% FAVORABLE 46.9% 15.4% 19.0% 74.6% 83.5% 43.0% 52.7% 16.8% 14.6% 20.9% 16.3% 70.3% 74.5% 89.5% 86.7% 45.9% 46.6% 50.8% 50.2% UNFAVORABLE 43.0% 73.7% 69.7% 11.3% 12.9% 46.2% 35.7% 63.9% 76.7% 73.6% 72.0% 16.2% 16.5% 6.3% 10.0% 46.7% 38.1% 35.3% 41.0% HEARD OF BUT NO OPINION 9.0% 9.4% 10.4% 12.8% 2.6% 9.5% 10.7% 15.7% 8.7% 5.5% 9.9% 13.5% 4.6% 4.2% 2.9% 6.4% 13.5% 13.3% 7.8% NEVER HEARD OF 1.1% 1.5% 0.9% 1.3% 1.0% 1.3% 0.9% 3.6% 1.7% 4.4% 0.5% 1.0% 1.8% 0.6% 1.0% UNFAV BOTH 9.9% 18.7% 6.2% 3.4% 3.4% 13.7% 10.2% 7.4% 21.9% 13.4% 9.5% 5.8% 3.9% 0.7% 2.7% 21.1% 8.5% 7.8% 5.5%
- 19. NEW HAMPSHIRE SURVEY-0714 Table 5-3 Q 5. Do you have a favorable or unfavorable opinion of Jeanne Shaheen? BROWN IMAGE SHAHEEN IMAGE OBAMA JOB APPROVAL GENERIC BALLOT MOOD ----------------------------------------------------------------- ----------------------------------------------------------------- ------------------------------- ------------------------------- -------------------- TOTAL --------- TOT FAV --------- TOT UN FAV -------- HRD NO OPIN --------- NVR HRD --------- NAME ID --------- HARD ID --------- TOT FAV -------- TOT UN FAV --------- HRD NO OPIN --------- NVR HRD --------- NAME ID --------- HARD ID -------- TOT APRV --------- TOT DIS- APRV --------- UND -------- GOP --------- DEM --------- UND --------- RD --------- WT -------- TOTAL 100.0% 100.0% 100.0% 100.0% 100.0% 100.0% 100.0% 100.0% 100.0% 100.0% 100.0% 100.0% 100.0% 100.0% 100.0% 100.0% 100.0% 100.0% 100.0% 100.0% 100.0% FAVORABLE 46.9% 19.2% 73.2% 37.9% 47.1% 46.8% 49.2% 100.0% 47.4% 52.1% 91.4% 15.7% 65.5% 11.1% 89.0% 45.8% 88.4% 24.4% UNFAVORABLE 43.0% 72.4% 23.0% 39.3% 11.1% 43.9% 45.0% 100.0% 43.5% 47.9% 3.3% 73.2% 8.7% 81.3% 5.8% 30.9% 4.9% 63.6% HEARD OF BUT NO OPINION 9.0% 7.7% 3.4% 21.5% 22.1% 8.6% 5.3% 100.0% 9.1% 4.7% 10.2% 20.3% 7.0% 3.8% 21.6% 5.7% 10.7% NEVER HEARD OF 1.1% 0.6% 0.4% 1.3% 19.7% 0.7% 0.5% 100.0% 0.6% 0.9% 5.6% 0.6% 1.4% 1.7% 1.0% 1.2% UNFAV BOTH 9.9% 23.0% 10.2% 12.8% 23.0% 10.0% 11.0% 2.0% 15.8% 4.2% 14.6% 2.8% 12.7% 1.8% 14.3%
- 20. NEW HAMPSHIRE SURVEY-0714 Table 5-4 Q 5. Do you have a favorable or unfavorable opinion of Jeanne Shaheen? US SENATE BALLOT --------------------------------------------------------------------------------------------------- TOTAL --------- PROB BRWN --------- DEF BRWN -------- TOT BRWN --------- TOT UND --------- TOT SHA HEEN --------- DEF SHA HEEN --------- PROB SHA HEEN -------- UN FAV BOTH --------- UND UND --------- TOTAL 100.0% 100.0% 100.0% 100.0% 100.0% 100.0% 100.0% 100.0% 100.0% 100.0% FAVORABLE 46.9% 8.8% 6.0% 7.0% 26.1% 88.2% 93.9% 69.0% 26.8% UNFAVORABLE 43.0% 76.8% 88.0% 83.9% 46.3% 5.6% 1.5% 19.5% 100.0% 38.0% HEARD OF BUT NO OPINION 9.0% 14.3% 5.6% 8.8% 24.7% 4.7% 4.0% 7.0% 31.2% NEVER HEARD OF 1.1% 0.1% 0.4% 0.3% 2.8% 1.4% 0.5% 4.4% 4.0% UNFAV BOTH 9.9% 20.3% 3.4% 9.7% 29.9% 4.5% 1.1% 16.0% 100.0% 22.5%
- 21. NEW HAMPSHIRE SURVEY-0714 Table 6-1 Q 6. And do you approve or disapprove of the job that Barack Obama is doing as President? AGE PARTY GENDER REGION ------------------------------------------------------ ---------------------------------------------------------------------------- ------------------- ------------------------------------------------------------------ TOTAL --------- 18-34 --------- 35-44 -------- 45-54 --------- 55-64 --------- 65+ --------- SOFT GOP --------- STR GOP -------- TOT GOP --------- TOT IND --------- TOT DEM --------- STR DEM --------- SOFT DEM -------- MALE --------- FE- MALE --------- HILL BOR -------- ROCK ING HAM --------- MER MACK --------- GAF TON --------- STR FORD --------- REST -------- TOTAL 100.0% 100.0% 100.0% 100.0% 100.0% 100.0% 100.0% 100.0% 100.0% 100.0% 100.0% 100.0% 100.0% 100.0% 100.0% 100.0% 100.0% 100.0% 100.0% 100.0% 100.0% APPROVE 36.1% 46.3% 34.6% 28.9% 41.3% 33.9% 19.9% 3.3% 8.5% 31.3% 73.8% 84.3% 52.4% 30.1% 41.9% 36.8% 30.8% 44.4% 38.9% 35.2% 36.4% DISAPPROVE 56.2% 50.6% 59.4% 62.2% 50.4% 57.2% 70.6% 94.9% 87.2% 56.9% 19.6% 8.7% 42.1% 63.0% 49.8% 56.5% 61.4% 47.6% 52.5% 60.9% 53.7% UNDECIDED 7.6% 3.1% 6.1% 9.0% 8.3% 9.0% 9.6% 1.8% 4.2% 11.8% 6.5% 7.0% 5.5% 6.9% 8.3% 6.7% 7.8% 7.9% 8.6% 3.8% 9.9%
- 22. NEW HAMPSHIRE SURVEY-0714 Table 6-2 Q 6. And do you approve or disapprove of the job that Barack Obama is doing as President? PARTY BY GENDER PARTY BY AGE ----------------------------------------------------------------- -------------------------------------------------------------------------------------------------------------------------------------- TOTAL --------- GOP MEN --------- GOP WO- MEN -------- DEM MEN --------- DEM WO- MEN --------- IND MEN --------- IND WO- MEN --------- GOP 18-44 -------- GOP 45-54 --------- GOP 55-64 --------- GOP 65+ --------- DEM 18-44 --------- DEM 45-54 -------- DEM 55-64 --------- DEM 65+ --------- IND 18-44 -------- IND 45-54 --------- IND 55-64 --------- IND 65+ --------- TOTAL 100.0% 100.0% 100.0% 100.0% 100.0% 100.0% 100.0% 100.0% 100.0% 100.0% 100.0% 100.0% 100.0% 100.0% 100.0% 100.0% 100.0% 100.0% 100.0% APPROVE 36.1% 7.0% 10.7% 74.3% 73.5% 27.2% 35.0% 10.0% 6.7% 10.3% 8.0% 75.7% 67.9% 79.7% 71.1% 32.8% 25.1% 35.0% 31.1% DISAPPROVE 56.2% 88.6% 85.3% 20.5% 19.1% 61.7% 52.5% 83.7% 89.6% 84.8% 89.3% 22.1% 24.6% 14.9% 17.1% 61.8% 58.1% 51.8% 54.0% UNDECIDED 7.6% 4.4% 3.9% 5.1% 7.4% 11.1% 12.5% 6.3% 3.7% 4.9% 2.7% 2.3% 7.5% 5.4% 11.8% 5.4% 16.8% 13.2% 14.9%
- 23. NEW HAMPSHIRE SURVEY-0714 Table 6-3 Q 6. And do you approve or disapprove of the job that Barack Obama is doing as President? BROWN IMAGE SHAHEEN IMAGE OBAMA JOB APPROVAL GENERIC BALLOT MOOD ----------------------------------------------------------------- ----------------------------------------------------------------- ------------------------------- ------------------------------- -------------------- TOTAL --------- TOT FAV --------- TOT UN FAV -------- HRD NO OPIN --------- NVR HRD --------- NAME ID --------- HARD ID --------- TOT FAV -------- TOT UN FAV --------- HRD NO OPIN --------- NVR HRD --------- NAME ID --------- HARD ID -------- TOT APRV --------- TOT DIS- APRV --------- UND -------- GOP --------- DEM --------- UND --------- RD --------- WT -------- TOTAL 100.0% 100.0% 100.0% 100.0% 100.0% 100.0% 100.0% 100.0% 100.0% 100.0% 100.0% 100.0% 100.0% 100.0% 100.0% 100.0% 100.0% 100.0% 100.0% 100.0% 100.0% APPROVE 36.1% 9.8% 62.0% 26.2% 34.8% 36.2% 38.8% 70.5% 2.8% 18.8% 19.0% 36.3% 38.1% 100.0% 3.8% 79.5% 26.5% 86.2% 9.1% DISAPPROVE 56.2% 86.6% 30.2% 61.1% 46.6% 56.5% 55.3% 18.8% 95.7% 64.0% 43.4% 56.4% 55.6% 100.0% 94.6% 12.3% 55.2% 5.0% 83.9% UNDECIDED 7.6% 3.6% 7.8% 12.7% 18.6% 7.3% 5.9% 10.6% 1.5% 17.2% 37.7% 7.3% 6.3% 100.0% 1.6% 8.2% 18.3% 8.8% 7.0%
- 24. NEW HAMPSHIRE SURVEY-0714 Table 6-4 Q 6. And do you approve or disapprove of the job that Barack Obama is doing as President? US SENATE BALLOT --------------------------------------------------------------------------------------------------- TOTAL --------- PROB BRWN --------- DEF BRWN -------- TOT BRWN --------- TOT UND --------- TOT SHA HEEN --------- DEF SHA HEEN --------- PROB SHA HEEN -------- UN FAV BOTH --------- UND UND --------- TOTAL 100.0% 100.0% 100.0% 100.0% 100.0% 100.0% 100.0% 100.0% 100.0% 100.0% APPROVE 36.1% 3.4% 2.9% 3.1% 10.0% 73.0% 80.9% 46.4% 7.3% 12.1% DISAPPROVE 56.2% 92.5% 96.4% 95.0% 71.7% 17.3% 10.7% 39.5% 89.5% 64.2% UNDECIDED 7.6% 4.1% 0.7% 1.9% 18.3% 9.7% 8.4% 14.1% 3.2% 23.7%
- 25. NEW HAMPSHIRE SURVEY-0714 Table 7-1 Q 7-9. If the election was being held today, for whom would you vote if the candidates were Scott Brown, Republican, or Jeanne Shaheen, Democrat? AGE PARTY GENDER REGION ------------------------------------------------------ ---------------------------------------------------------------------------- ------------------- ------------------------------------------------------------------ TOTAL --------- 18-34 --------- 35-44 -------- 45-54 --------- 55-64 --------- 65+ --------- SOFT GOP --------- STR GOP -------- TOT GOP --------- TOT IND --------- TOT DEM --------- STR DEM --------- SOFT DEM -------- MALE --------- FE- MALE --------- HILL BOR -------- ROCK ING HAM --------- MER MACK --------- GAF TON --------- STR FORD --------- REST -------- TOTAL 100.0% 100.0% 100.0% 100.0% 100.0% 100.0% 100.0% 100.0% 100.0% 100.0% 100.0% 100.0% 100.0% 100.0% 100.0% 100.0% 100.0% 100.0% 100.0% 100.0% 100.0% SCOTT BROWN 41.1% 31.5% 43.8% 43.9% 37.8% 45.2% 55.5% 83.0% 74.3% 35.0% 10.0% 3.9% 22.5% 48.2% 34.3% 37.4% 52.5% 29.0% 38.8% 38.4% 41.5% JEANNE SHAHEEN 46.0% 53.1% 44.8% 40.0% 51.1% 43.9% 27.3% 5.6% 12.5% 46.3% 84.5% 92.8% 67.5% 38.6% 53.1% 48.8% 37.5% 53.3% 46.6% 50.9% 45.8% UNDECIDED 12.9% 15.4% 11.5% 16.1% 11.0% 10.9% 17.2% 11.4% 13.3% 18.7% 5.5% 3.3% 10.0% 13.2% 12.6% 13.8% 10.0% 17.7% 14.6% 10.7% 12.7% DEFINITELY BROWN 25.9% 13.7% 32.7% 27.8% 21.3% 31.2% 32.1% 56.9% 49.1% 19.6% 6.5% 2.7% 14.1% 32.0% 20.0% 23.2% 33.8% 17.4% 27.1% 18.9% 27.6% PROBABLY BROWN 15.2% 17.9% 11.1% 16.2% 16.6% 14.0% 23.4% 26.1% 25.2% 15.4% 3.5% 1.2% 8.4% 16.2% 14.3% 14.2% 18.7% 11.6% 11.6% 19.5% 13.9% PROBABLY SHAHEEN 10.5% 20.5% 11.0% 9.6% 9.7% 6.1% 8.0% 1.9% 3.8% 15.2% 12.5% 8.1% 21.5% 8.0% 12.8% 14.0% 9.3% 9.5% 9.1% 9.7% 7.9% DEFINITELY SHAHEEN 35.5% 32.5% 33.7% 30.4% 41.4% 37.8% 19.3% 3.7% 8.6% 31.1% 72.0% 84.7% 46.0% 30.6% 40.2% 34.8% 28.2% 43.7% 37.6% 41.2% 37.9% UND GENERIC/UND BALLOT 8.2% 12.9% 10.6% 8.9% 5.8% 5.6% 11.6% 3.7% 6.2% 14.9% 2.4% 0.6% 5.9% 8.1% 8.2% 9.1% 6.0% 9.1% 10.2% 7.5% 8.4%
- 26. NEW HAMPSHIRE SURVEY-0714 Table 7-2 Q 7-9. If the election was being held today, for whom would you vote if the candidates were Scott Brown, Republican, or Jeanne Shaheen, Democrat? PARTY BY GENDER PARTY BY AGE ----------------------------------------------------------------- -------------------------------------------------------------------------------------------------------------------------------------- TOTAL --------- GOP MEN --------- GOP WO- MEN -------- DEM MEN --------- DEM WO- MEN --------- IND MEN --------- IND WO- MEN --------- GOP 18-44 -------- GOP 45-54 --------- GOP 55-64 --------- GOP 65+ --------- DEM 18-44 --------- DEM 45-54 -------- DEM 55-64 --------- DEM 65+ --------- IND 18-44 -------- IND 45-54 --------- IND 55-64 --------- IND 65+ --------- TOTAL 100.0% 100.0% 100.0% 100.0% 100.0% 100.0% 100.0% 100.0% 100.0% 100.0% 100.0% 100.0% 100.0% 100.0% 100.0% 100.0% 100.0% 100.0% 100.0% SCOTT BROWN 41.1% 75.0% 73.2% 14.0% 7.4% 39.6% 30.8% 77.8% 70.4% 74.7% 75.5% 12.3% 11.2% 6.7% 9.6% 31.7% 37.0% 33.7% 39.9% JEANNE SHAHEEN 46.0% 11.2% 14.3% 81.6% 86.3% 41.9% 50.3% 10.9% 12.5% 14.9% 11.7% 81.5% 83.0% 89.6% 84.0% 48.3% 39.9% 48.9% 47.0% UNDECIDED 12.9% 13.8% 12.5% 4.4% 6.3% 18.5% 18.9% 11.3% 17.1% 10.4% 12.8% 6.2% 5.8% 3.6% 6.5% 20.0% 23.0% 17.4% 13.1% DEFINITELY BROWN 25.9% 51.8% 45.2% 8.6% 5.1% 24.5% 15.2% 50.4% 47.1% 43.8% 54.2% 8.1% 10.0% 3.2% 4.6% 18.2% 17.6% 18.0% 26.8% PROBABLY BROWN 15.2% 23.3% 28.0% 5.4% 2.3% 15.2% 15.6% 27.4% 23.2% 31.0% 21.2% 4.2% 1.2% 3.5% 4.9% 13.5% 19.4% 15.7% 13.2% PROBABLY SHAHEEN 10.5% 5.3% 1.8% 8.1% 15.4% 11.3% 18.7% 2.6% 5.7% 3.3% 3.2% 20.4% 13.5% 8.1% 6.7% 20.1% 11.5% 16.2% 9.7% DEFINITELY SHAHEEN 35.5% 5.9% 12.5% 73.6% 70.9% 30.5% 31.6% 8.3% 6.7% 11.6% 8.5% 61.1% 69.5% 81.6% 77.3% 28.1% 28.4% 32.7% 37.3% UND GENERIC/UND BALLOT 8.2% 6.1% 6.3% 3.1% 1.9% 13.9% 15.8% 11.3% 6.3% 3.4% 4.4% 2.4% 1.9% 1.7% 3.3% 18.9% 17.9% 11.0% 9.9%
- 27. NEW HAMPSHIRE SURVEY-0714 Table 7-3 Q 7-9. If the election was being held today, for whom would you vote if the candidates were Scott Brown, Republican, or Jeanne Shaheen, Democrat? BROWN IMAGE SHAHEEN IMAGE OBAMA JOB APPROVAL GENERIC BALLOT MOOD ----------------------------------------------------------------- ----------------------------------------------------------------- ------------------------------- ------------------------------- -------------------- TOTAL --------- TOT FAV --------- TOT UN FAV -------- HRD NO OPIN --------- NVR HRD --------- NAME ID --------- HARD ID --------- TOT FAV -------- TOT UN FAV --------- HRD NO OPIN --------- NVR HRD --------- NAME ID --------- HARD ID -------- TOT APRV --------- TOT DIS- APRV --------- UND -------- GOP --------- DEM --------- UND --------- RD --------- WT -------- TOTAL 100.0% 100.0% 100.0% 100.0% 100.0% 100.0% 100.0% 100.0% 100.0% 100.0% 100.0% 100.0% 100.0% 100.0% 100.0% 100.0% 100.0% 100.0% 100.0% 100.0% 100.0% SCOTT BROWN 41.1% 84.6% 10.3% 34.8% 21.5% 41.6% 43.4% 6.2% 80.1% 40.4% 10.4% 41.5% 41.6% 3.5% 69.4% 10.5% 84.6% 3.7% 19.1% 5.5% 60.4% JEANNE SHAHEEN 46.0% 11.5% 78.7% 35.0% 46.3% 46.0% 48.8% 86.6% 6.0% 24.1% 57.6% 45.9% 48.0% 92.9% 14.1% 58.5% 6.9% 93.1% 43.1% 89.5% 22.5% UNDECIDED 12.9% 3.9% 11.0% 30.2% 32.2% 12.4% 7.8% 7.2% 13.9% 35.5% 32.0% 12.7% 10.4% 3.6% 16.4% 31.0% 8.5% 3.2% 37.7% 5.0% 17.1% DEFINITELY BROWN 25.9% 67.5% 2.3% 7.4% 5.6% 26.4% 31.3% 3.3% 52.9% 16.1% 8.7% 26.1% 27.1% 2.1% 44.3% 2.3% 55.6% 2.4% 7.2% 3.6% 37.9% PROBABLY BROWN 15.2% 17.2% 8.0% 27.4% 15.8% 15.2% 12.1% 2.9% 27.2% 24.2% 1.7% 15.4% 14.5% 1.4% 25.1% 8.2% 29.0% 1.2% 11.9% 1.9% 22.5% PROBABLY SHAHEEN 10.5% 5.6% 14.8% 8.3% 21.1% 10.2% 10.7% 15.4% 4.7% 8.2% 41.1% 10.1% 10.3% 13.4% 7.3% 19.3% 3.1% 13.4% 19.9% 14.4% 8.3% DEFINITELY SHAHEEN 35.5% 5.9% 64.0% 26.7% 25.3% 35.8% 38.1% 71.2% 1.3% 15.9% 16.5% 35.8% 37.7% 79.5% 6.8% 39.2% 3.8% 79.7% 23.3% 75.1% 14.2% UND GENERIC/UND BALLOT 8.2% 2.8% 5.8% 20.3% 26.3% 7.7% 4.4% 4.7% 7.2% 28.3% 28.9% 7.9% 5.9% 2.7% 9.3% 25.4% 37.7% 3.6% 10.6%
- 28. NEW HAMPSHIRE SURVEY-0714 Table 7-4 Q 7-9. If the election was being held today, for whom would you vote if the candidates were Scott Brown, Republican, or Jeanne Shaheen, Democrat? US SENATE BALLOT --------------------------------------------------------------------------------------------------- TOTAL --------- PROB BRWN --------- DEF BRWN -------- TOT BRWN --------- TOT UND --------- TOT SHA HEEN --------- DEF SHA HEEN --------- PROB SHA HEEN -------- UN FAV BOTH --------- UND UND --------- TOTAL 100.0% 100.0% 100.0% 100.0% 100.0% 100.0% 100.0% 100.0% 100.0% 100.0% SCOTT BROWN 41.1% 100.0% 100.0% 100.0% 40.1% JEANNE SHAHEEN 46.0% 100.0% 100.0% 100.0% 20.9% UNDECIDED 12.9% 100.0% 38.9% 100.0% DEFINITELY BROWN 25.9% 100.0% 62.9% 8.9% PROBABLY BROWN 15.2% 100.0% 37.1% 31.3% PROBABLY SHAHEEN 10.5% 22.7% 100.0% 16.9% DEFINITELY SHAHEEN 35.5% 77.3% 100.0% 4.0% UND GENERIC/UND BALLOT 8.2% 63.2% 18.5% 100.0%
- 29. NEW HAMPSHIRE SURVEY-0714 Table 10-1 10. These last few questions are for statistical purposes only. Press 1 if you are male or 2 if you are female. AGE PARTY GENDER REGION ------------------------------------------------------ ---------------------------------------------------------------------------- ------------------- ------------------------------------------------------------------ TOTAL --------- 18-34 --------- 35-44 -------- 45-54 --------- 55-64 --------- 65+ --------- SOFT GOP --------- STR GOP -------- TOT GOP --------- TOT IND --------- TOT DEM --------- STR DEM --------- SOFT DEM -------- MALE --------- FE- MALE --------- HILL BOR -------- ROCK ING HAM --------- MER MACK --------- GAF TON --------- STR FORD --------- REST -------- TOTAL 100.0% 100.0% 100.0% 100.0% 100.0% 100.0% 100.0% 100.0% 100.0% 100.0% 100.0% 100.0% 100.0% 100.0% 100.0% 100.0% 100.0% 100.0% 100.0% 100.0% 100.0% MALE 49.0% 45.9% 52.6% 55.4% 47.3% 43.3% 55.7% 60.4% 58.9% 47.4% 39.4% 33.2% 52.1% 100.0% 45.2% 51.4% 45.6% 58.3% 53.4% 48.9% FEMALE 51.0% 54.1% 47.4% 44.6% 52.7% 56.7% 44.3% 39.6% 41.1% 52.6% 60.6% 66.8% 47.9% 100.0% 54.8% 48.6% 54.4% 41.7% 46.6% 51.1%
- 30. NEW HAMPSHIRE SURVEY-0714 Table 10-2 10. These last few questions are for statistical purposes only. Press 1 if you are male or 2 if you are female. PARTY BY GENDER PARTY BY AGE ----------------------------------------------------------------- -------------------------------------------------------------------------------------------------------------------------------------- TOTAL --------- GOP MEN --------- GOP WO- MEN -------- DEM MEN --------- DEM WO- MEN --------- IND MEN --------- IND WO- MEN --------- GOP 18-44 -------- GOP 45-54 --------- GOP 55-64 --------- GOP 65+ --------- DEM 18-44 --------- DEM 45-54 -------- DEM 55-64 --------- DEM 65+ --------- IND 18-44 -------- IND 45-54 --------- IND 55-64 --------- IND 65+ --------- TOTAL 100.0% 100.0% 100.0% 100.0% 100.0% 100.0% 100.0% 100.0% 100.0% 100.0% 100.0% 100.0% 100.0% 100.0% 100.0% 100.0% 100.0% 100.0% 100.0% MALE 49.0% 100.0% 100.0% 100.0% 69.0% 68.7% 48.5% 48.6% 49.1% 38.9% 35.1% 32.7% 37.2% 52.1% 56.2% 47.1% FEMALE 51.0% 100.0% 100.0% 100.0% 31.0% 31.3% 51.5% 51.4% 50.9% 61.1% 64.9% 67.3% 62.8% 47.9% 43.8% 52.9%
- 31. NEW HAMPSHIRE SURVEY-0714 Table 10-3 10. These last few questions are for statistical purposes only. Press 1 if you are male or 2 if you are female. BROWN IMAGE SHAHEEN IMAGE OBAMA JOB APPROVAL GENERIC BALLOT MOOD ----------------------------------------------------------------- ----------------------------------------------------------------- ------------------------------- ------------------------------- -------------------- TOTAL --------- TOT FAV --------- TOT UN FAV -------- HRD NO OPIN --------- NVR HRD --------- NAME ID --------- HARD ID --------- TOT FAV -------- TOT UN FAV --------- HRD NO OPIN --------- NVR HRD --------- NAME ID --------- HARD ID -------- TOT APRV --------- TOT DIS- APRV --------- UND -------- GOP --------- DEM --------- UND --------- RD --------- WT -------- TOTAL 100.0% 100.0% 100.0% 100.0% 100.0% 100.0% 100.0% 100.0% 100.0% 100.0% 100.0% 100.0% 100.0% 100.0% 100.0% 100.0% 100.0% 100.0% 100.0% 100.0% 100.0% MALE 49.0% 51.8% 47.0% 46.9% 60.9% 48.7% 49.2% 40.9% 56.1% 56.1% 58.5% 48.9% 48.2% 40.8% 54.9% 44.4% 56.6% 40.7% 48.0% 42.3% 52.6% FEMALE 51.0% 48.2% 53.0% 53.1% 39.1% 51.3% 50.8% 59.1% 43.9% 43.9% 41.5% 51.1% 51.8% 59.2% 45.1% 55.6% 43.4% 59.3% 52.0% 57.7% 47.4%
- 32. NEW HAMPSHIRE SURVEY-0714 Table 10-4 10. These last few questions are for statistical purposes only. Press 1 if you are male or 2 if you are female. US SENATE BALLOT --------------------------------------------------------------------------------------------------- TOTAL --------- PROB BRWN --------- DEF BRWN -------- TOT BRWN --------- TOT UND --------- TOT SHA HEEN --------- DEF SHA HEEN --------- PROB SHA HEEN -------- UN FAV BOTH --------- UND UND --------- TOTAL 100.0% 100.0% 100.0% 100.0% 100.0% 100.0% 100.0% 100.0% 100.0% 100.0% MALE 49.0% 52.1% 60.6% 57.4% 50.0% 41.2% 42.2% 37.6% 65.7% 48.6% FEMALE 51.0% 47.9% 39.4% 42.6% 50.0% 58.8% 57.8% 62.4% 34.3% 51.4%
- 33. NEW HAMPSHIRE SURVEY-0714 Table 11-1 11-13. Regardless of how you feel today, with which party are you registered to vote? AGE PARTY GENDER REGION ------------------------------------------------------ ---------------------------------------------------------------------------- ------------------- ------------------------------------------------------------------ TOTAL --------- 18-34 --------- 35-44 -------- 45-54 --------- 55-64 --------- 65+ --------- SOFT GOP --------- STR GOP -------- TOT GOP --------- TOT IND --------- TOT DEM --------- STR DEM --------- SOFT DEM -------- MALE --------- FE- MALE --------- HILL BOR -------- ROCK ING HAM --------- MER MACK --------- GAF TON --------- STR FORD --------- REST -------- TOTAL 100.0% 100.0% 100.0% 100.0% 100.0% 100.0% 100.0% 100.0% 100.0% 100.0% 100.0% 100.0% 100.0% 100.0% 100.0% 100.0% 100.0% 100.0% 100.0% 100.0% 100.0% REPUBLICAN 34.6% 21.8% 31.2% 41.1% 30.4% 41.2% 100.0% 100.0% 100.0% 41.6% 27.9% 33.3% 39.4% 25.6% 34.3% 34.4% 36.0% DEMOCRAT 29.9% 31.4% 31.4% 26.4% 30.9% 30.8% 100.0% 100.0% 100.0% 24.0% 35.5% 30.9% 23.6% 39.3% 30.6% 27.1% 31.8% INDEPENDENT OR OTHER 35.5% 46.8% 37.4% 32.4% 38.7% 28.0% 100.0% 34.4% 36.6% 35.8% 37.0% 35.1% 35.1% 38.5% 32.1% STR REPUBLICAN 23.7% 14.2% 16.7% 28.8% 21.0% 30.4% 100.0% 68.4% 29.1% 18.4% 21.2% 28.5% 14.0% 28.1% 26.6% 24.4% NSS REPUBLICAN 10.9% 7.6% 14.5% 12.4% 9.4% 10.7% 100.0% 31.6% 12.5% 9.5% 12.1% 10.9% 11.6% 6.2% 7.8% 11.7% NSS DEMOCRATIC 9.8% 13.9% 18.7% 5.4% 7.9% 8.8% 32.8% 100.0% 10.4% 9.2% 9.4% 8.3% 15.8% 14.3% 8.3% 8.0% STR DEMOCRAT 20.1% 17.4% 12.7% 21.1% 23.0% 22.0% 67.2% 100.0% 13.6% 26.3% 21.5% 15.2% 23.5% 16.3% 18.7% 23.8%
- 34. NEW HAMPSHIRE SURVEY-0714 Table 11-2 11-13. Regardless of how you feel today, with which party are you registered to vote? PARTY BY GENDER PARTY BY AGE ----------------------------------------------------------------- -------------------------------------------------------------------------------------------------------------------------------------- TOTAL --------- GOP MEN --------- GOP WO- MEN -------- DEM MEN --------- DEM WO- MEN --------- IND MEN --------- IND WO- MEN --------- GOP 18-44 -------- GOP 45-54 --------- GOP 55-64 --------- GOP 65+ --------- DEM 18-44 --------- DEM 45-54 -------- DEM 55-64 --------- DEM 65+ --------- IND 18-44 -------- IND 45-54 --------- IND 55-64 --------- IND 65+ --------- TOTAL 100.0% 100.0% 100.0% 100.0% 100.0% 100.0% 100.0% 100.0% 100.0% 100.0% 100.0% 100.0% 100.0% 100.0% 100.0% 100.0% 100.0% 100.0% 100.0% REPUBLICAN 34.6% 100.0% 100.0% 100.0% 100.0% 100.0% 100.0% DEMOCRAT 29.9% 100.0% 100.0% 100.0% 100.0% 100.0% 100.0% INDEPENDENT OR OTHER 35.5% 100.0% 100.0% 100.0% 100.0% 100.0% 100.0% STR REPUBLICAN 23.7% 70.1% 65.9% 58.1% 70.0% 69.2% 73.9% NSS REPUBLICAN 10.9% 29.9% 34.1% 41.9% 30.0% 30.8% 26.1% NSS DEMOCRATIC 9.8% 43.4% 26.0% 52.3% 20.3% 25.6% 28.5% STR DEMOCRAT 20.1% 56.6% 74.0% 47.7% 79.7% 74.4% 71.5%
- 35. NEW HAMPSHIRE SURVEY-0714 Table 11-3 11-13. Regardless of how you feel today, with which party are you registered to vote? BROWN IMAGE SHAHEEN IMAGE OBAMA JOB APPROVAL GENERIC BALLOT MOOD ----------------------------------------------------------------- ----------------------------------------------------------------- ------------------------------- ------------------------------- -------------------- TOTAL --------- TOT FAV --------- TOT UN FAV -------- HRD NO OPIN --------- NVR HRD --------- NAME ID --------- HARD ID --------- TOT FAV -------- TOT UN FAV --------- HRD NO OPIN --------- NVR HRD --------- NAME ID --------- HARD ID -------- TOT APRV --------- TOT DIS- APRV --------- UND -------- GOP --------- DEM --------- UND --------- RD --------- WT -------- TOTAL 100.0% 100.0% 100.0% 100.0% 100.0% 100.0% 100.0% 100.0% 100.0% 100.0% 100.0% 100.0% 100.0% 100.0% 100.0% 100.0% 100.0% 100.0% 100.0% 100.0% 100.0% REPUBLICAN 34.6% 55.3% 17.4% 36.0% 34.1% 34.6% 34.3% 12.5% 57.9% 37.9% 37.6% 34.6% 34.2% 8.2% 53.7% 19.2% 65.2% 6.9% 21.5% 9.3% 48.2% DEMOCRAT 29.9% 13.8% 44.4% 26.3% 31.4% 29.9% 30.8% 51.1% 8.5% 22.1% 28.7% 29.9% 30.7% 61.1% 10.4% 25.6% 7.5% 65.1% 14.6% 57.8% 14.9% INDEPENDENT OR OTHER 35.5% 30.9% 38.2% 37.7% 34.5% 35.5% 35.0% 36.5% 33.5% 40.0% 33.7% 35.5% 35.1% 30.7% 35.9% 55.2% 27.4% 28.0% 63.9% 32.9% 36.9% STR REPUBLICAN 23.7% 40.8% 10.0% 24.7% 12.8% 23.9% 23.7% 4.6% 44.9% 22.2% 18.1% 23.7% 23.9% 2.2% 39.9% 5.5% 51.1% 1.8% 6.9% 3.9% 34.3% NSS REPUBLICAN 10.9% 14.4% 7.4% 11.3% 21.3% 10.7% 10.5% 7.9% 13.0% 15.7% 19.5% 10.8% 10.4% 6.0% 13.7% 13.8% 14.1% 5.1% 14.6% 5.5% 13.9% NSS DEMOCRATIC 9.8% 8.6% 9.5% 13.6% 1.5% 10.0% 9.1% 12.6% 5.9% 15.2% 9.9% 9.4% 14.2% 7.3% 7.1% 5.8% 13.5% 11.6% 14.4% 7.3% STR DEMOCRAT 20.1% 5.2% 34.9% 12.7% 29.9% 19.8% 21.7% 38.5% 2.6% 6.8% 28.7% 20.0% 21.3% 46.8% 3.1% 18.5% 1.7% 51.6% 3.0% 43.3% 7.5%
- 36. NEW HAMPSHIRE SURVEY-0714 Table 11-4 11-13. Regardless of how you feel today, with which party are you registered to vote? US SENATE BALLOT --------------------------------------------------------------------------------------------------- TOTAL --------- PROB BRWN --------- DEF BRWN -------- TOT BRWN --------- TOT UND --------- TOT SHA HEEN --------- DEF SHA HEEN --------- PROB SHA HEEN -------- UN FAV BOTH --------- UND UND --------- TOTAL 100.0% 100.0% 100.0% 100.0% 100.0% 100.0% 100.0% 100.0% 100.0% 100.0% REPUBLICAN 34.6% 57.2% 65.6% 62.5% 35.6% 9.4% 8.4% 12.7% 47.4% 26.4% DEMOCRAT 29.9% 6.9% 7.5% 7.3% 12.8% 54.9% 60.6% 35.7% 10.2% 8.6% INDEPENDENT OR OTHER 35.5% 35.8% 26.9% 30.2% 51.6% 35.7% 31.1% 51.5% 42.4% 65.0% STR REPUBLICAN 23.7% 40.4% 52.0% 47.7% 21.0% 2.9% 2.4% 4.4% 34.6% 10.8% NSS REPUBLICAN 10.9% 16.8% 13.6% 14.8% 14.6% 6.5% 5.9% 8.3% 12.7% 15.6% NSS DEMOCRATIC 9.8% 5.4% 5.4% 5.4% 7.6% 14.4% 12.7% 20.2% 6.8% 7.1% STR DEMOCRAT 20.1% 1.5% 2.1% 1.9% 5.2% 40.5% 47.9% 15.5% 3.4% 1.5%
- 37. NEW HAMPSHIRE SURVEY-0714 Table 14-1 14. Which of the following age group applies to you? AGE PARTY GENDER REGION ------------------------------------------------------ ---------------------------------------------------------------------------- ------------------- ------------------------------------------------------------------ TOTAL --------- 18-34 --------- 35-44 -------- 45-54 --------- 55-64 --------- 65+ --------- SOFT GOP --------- STR GOP -------- TOT GOP --------- TOT IND --------- TOT DEM --------- STR DEM --------- SOFT DEM -------- MALE --------- FE- MALE --------- HILL BOR -------- ROCK ING HAM --------- MER MACK --------- GAF TON --------- STR FORD --------- REST -------- TOTAL 100.0% 100.0% 100.0% 100.0% 100.0% 100.0% 100.0% 100.0% 100.0% 100.0% 100.0% 100.0% 100.0% 100.0% 100.0% 100.0% 100.0% 100.0% 100.0% 100.0% 100.0% 18-34 13.0% 100.0% 9.1% 7.8% 8.2% 17.1% 13.6% 11.3% 18.4% 12.2% 13.8% 13.1% 12.7% 13.5% 9.9% 12.0% 14.3% 35-44 14.4% 100.0% 19.0% 10.2% 13.0% 15.2% 15.1% 9.1% 27.4% 15.5% 13.4% 17.5% 18.3% 9.3% 10.0% 12.0% 10.2% 45-54 25.1% 100.0% 28.3% 30.5% 29.8% 22.9% 22.2% 26.3% 13.7% 28.4% 21.9% 30.2% 21.9% 30.3% 19.7% 22.8% 21.0% 55-64 24.3% 100.0% 20.8% 21.6% 21.4% 26.5% 25.1% 27.8% 19.6% 23.5% 25.1% 19.7% 26.6% 22.0% 32.6% 34.5% 22.7% 65 PLUS 23.2% 100.0% 22.8% 29.8% 27.6% 18.3% 23.9% 25.4% 20.8% 20.5% 25.8% 19.6% 20.4% 25.0% 27.8% 18.6% 31.7%
- 38. NEW HAMPSHIRE SURVEY-0714 Table 14-2 14. Which of the following age group applies to you? PARTY BY GENDER PARTY BY AGE ----------------------------------------------------------------- -------------------------------------------------------------------------------------------------------------------------------------- TOTAL --------- GOP MEN --------- GOP WO- MEN -------- DEM MEN --------- DEM WO- MEN --------- IND MEN --------- IND WO- MEN --------- GOP 18-44 -------- GOP 45-54 --------- GOP 55-64 --------- GOP 65+ --------- DEM 18-44 --------- DEM 45-54 -------- DEM 55-64 --------- DEM 65+ --------- IND 18-44 -------- IND 45-54 --------- IND 55-64 --------- IND 65+ --------- TOTAL 100.0% 100.0% 100.0% 100.0% 100.0% 100.0% 100.0% 100.0% 100.0% 100.0% 100.0% 100.0% 100.0% 100.0% 100.0% 100.0% 100.0% 100.0% 100.0% 18-34 13.0% 9.7% 6.1% 18.5% 10.5% 10.8% 22.9% 38.7% 47.4% 53.0% 35-44 14.4% 15.1% 9.9% 17.3% 13.7% 14.6% 15.7% 61.3% 52.6% 47.0% 45-54 25.1% 34.8% 22.7% 21.9% 22.4% 25.2% 20.9% 100.0% 100.0% 100.0% 55-64 24.3% 17.6% 26.8% 22.4% 26.9% 31.3% 22.1% 100.0% 100.0% 100.0% 65 PLUS 23.2% 22.8% 34.5% 19.9% 26.5% 18.2% 18.4% 100.0% 100.0% 100.0%
- 39. NEW HAMPSHIRE SURVEY-0714 Table 14-3 14. Which of the following age group applies to you? BROWN IMAGE SHAHEEN IMAGE OBAMA JOB APPROVAL GENERIC BALLOT MOOD ----------------------------------------------------------------- ----------------------------------------------------------------- ------------------------------- ------------------------------- -------------------- TOTAL --------- TOT FAV --------- TOT UN FAV -------- HRD NO OPIN --------- NVR HRD --------- NAME ID --------- HARD ID --------- TOT FAV -------- TOT UN FAV --------- HRD NO OPIN --------- NVR HRD --------- NAME ID --------- HARD ID -------- TOT APRV --------- TOT DIS- APRV --------- UND -------- GOP --------- DEM --------- UND --------- RD --------- WT -------- TOTAL 100.0% 100.0% 100.0% 100.0% 100.0% 100.0% 100.0% 100.0% 100.0% 100.0% 100.0% 100.0% 100.0% 100.0% 100.0% 100.0% 100.0% 100.0% 100.0% 100.0% 100.0% 18-34 13.0% 11.6% 11.2% 17.6% 25.8% 12.7% 11.4% 14.7% 9.9% 20.4% 13.1% 12.4% 16.7% 11.7% 5.3% 10.3% 11.6% 20.5% 19.4% 9.6% 35-44 14.4% 17.1% 14.8% 8.5% 17.9% 14.3% 15.8% 12.1% 16.6% 13.5% 33.1% 14.2% 14.3% 13.8% 15.2% 11.5% 14.5% 14.4% 14.3% 12.4% 15.5% 45-54 25.1% 23.7% 25.0% 27.3% 28.0% 25.0% 24.4% 21.9% 28.2% 25.6% 38.7% 24.9% 24.9% 20.0% 27.7% 29.6% 26.8% 23.3% 24.8% 20.6% 27.5% 55-64 24.3% 20.1% 28.0% 25.5% 8.9% 24.7% 24.5% 27.8% 21.4% 22.0% 5.2% 24.5% 24.8% 27.8% 21.8% 26.4% 23.2% 26.6% 22.7% 26.0% 23.4% 65 PLUS 23.2% 27.5% 21.0% 21.0% 19.4% 23.3% 23.9% 23.5% 23.8% 18.5% 22.9% 23.2% 23.7% 21.7% 23.6% 27.3% 25.2% 24.1% 17.8% 21.6% 24.0%
- 40. NEW HAMPSHIRE SURVEY-0714 Table 14-4 14. Which of the following age group applies to you? US SENATE BALLOT --------------------------------------------------------------------------------------------------- TOTAL --------- PROB BRWN --------- DEF BRWN -------- TOT BRWN --------- TOT UND --------- TOT SHA HEEN --------- DEF SHA HEEN --------- PROB SHA HEEN -------- UN FAV BOTH --------- UND UND --------- TOTAL 100.0% 100.0% 100.0% 100.0% 100.0% 100.0% 100.0% 100.0% 100.0% 100.0% 18-34 13.0% 15.2% 6.9% 10.0% 15.5% 15.0% 11.9% 25.5% 14.6% 20.6% 35-44 14.4% 10.5% 18.2% 15.3% 12.8% 14.0% 13.7% 15.2% 20.4% 18.7% 45-54 25.1% 26.6% 26.9% 26.8% 31.3% 21.8% 21.5% 23.1% 32.4% 27.4% 55-64 24.3% 26.4% 20.0% 22.4% 20.8% 27.0% 28.3% 22.6% 17.9% 17.3% 65 PLUS 23.2% 21.2% 28.0% 25.5% 19.7% 22.1% 24.7% 13.5% 14.7% 16.0%
- 41. NEW HAMPSHIRE SURVEY-0714 Table 15-1 COUNTY AGE PARTY GENDER REGION ------------------------------------------------------ ---------------------------------------------------------------------------- ------------------- ------------------------------------------------------------------ TOTAL --------- 18-34 --------- 35-44 -------- 45-54 --------- 55-64 --------- 65+ --------- SOFT GOP --------- STR GOP -------- TOT GOP --------- TOT IND --------- TOT DEM --------- STR DEM --------- SOFT DEM -------- MALE --------- FE- MALE --------- HILL BOR -------- ROCK ING HAM --------- MER MACK --------- GAF TON --------- STR FORD --------- REST -------- TOTAL 100.0% 100.0% 100.0% 100.0% 100.0% 100.0% 100.0% 100.0% 100.0% 100.0% 100.0% 100.0% 100.0% 100.0% 100.0% 100.0% 100.0% 100.0% 100.0% 100.0% 100.0% HILLSBOROUGH 29.6% 29.8% 36.0% 35.6% 24.0% 25.0% 32.8% 26.5% 28.5% 29.9% 30.6% 31.7% 28.4% 27.3% 31.8% 100.0% ROCKINGHAM 24.7% 24.2% 31.4% 21.6% 27.0% 21.8% 24.6% 29.8% 28.1% 25.7% 19.5% 18.7% 21.0% 25.9% 23.5% 100.0% MERRIMACK 11.6% 12.0% 7.5% 14.0% 10.5% 12.5% 12.2% 6.9% 8.6% 11.5% 15.3% 13.6% 18.7% 10.8% 12.4% 100.0% STRAFFORD 8.5% 7.9% 7.1% 7.7% 12.1% 6.8% 6.1% 9.6% 8.5% 9.2% 7.7% 7.9% 7.2% 9.3% 7.8% 100.0% GRAFTON 6.1% 4.6% 4.3% 4.8% 8.2% 7.3% 3.5% 7.2% 6.0% 6.0% 6.3% 5.0% 8.9% 7.3% 5.0% 100.0% CHESHIRE 5.5% 2.9% 4.0% 4.5% 6.0% 8.4% 5.9% 4.9% 5.2% 5.1% 6.4% 7.4% 4.2% 5.0% 6.0% 28.2% BELKNAP 4.8% 6.7% 3.5% 2.8% 4.5% 7.0% 5.3% 5.2% 5.2% 3.4% 6.0% 6.7% 4.6% 5.6% 4.1% 24.6% CARROLL 3.9% 2.1% 2.7% 4.2% 2.7% 6.5% 3.2% 6.3% 5.4% 3.8% 2.3% 2.7% 1.7% 3.9% 3.9% 20.0% SULLIVAN 3.1% 5.3% 1.7% 2.5% 3.7% 2.8% 3.1% 1.7% 2.2% 2.6% 4.8% 5.6% 3.1% 2.6% 3.6% 15.9% COOS 2.2% 4.5% 2.0% 2.2% 1.3% 2.0% 3.2% 1.9% 2.3% 2.8% 1.3% 0.8% 2.2% 2.4% 2.0% 11.3%
- 42. NEW HAMPSHIRE SURVEY-0714 Table 15-2 COUNTY PARTY BY GENDER PARTY BY AGE ----------------------------------------------------------------- -------------------------------------------------------------------------------------------------------------------------------------- TOTAL --------- GOP MEN --------- GOP WO- MEN -------- DEM MEN --------- DEM WO- MEN --------- IND MEN --------- IND WO- MEN --------- GOP 18-44 -------- GOP 45-54 --------- GOP 55-64 --------- GOP 65+ --------- DEM 18-44 --------- DEM 45-54 -------- DEM 55-64 --------- DEM 65+ --------- IND 18-44 -------- IND 45-54 --------- IND 55-64 --------- IND 65+ --------- TOTAL 100.0% 100.0% 100.0% 100.0% 100.0% 100.0% 100.0% 100.0% 100.0% 100.0% 100.0% 100.0% 100.0% 100.0% 100.0% 100.0% 100.0% 100.0% 100.0% HILLSBOROUGH 29.6% 30.0% 26.3% 26.0% 33.6% 25.0% 34.3% 27.2% 40.1% 22.5% 21.5% 33.3% 30.7% 25.8% 32.2% 36.5% 33.8% 23.6% 22.2% ROCKINGHAM 24.7% 26.9% 29.9% 22.6% 17.5% 27.0% 24.6% 37.9% 24.4% 30.5% 22.9% 20.0% 15.0% 22.7% 19.7% 27.6% 23.4% 27.8% 22.4% MERRIMACK 11.6% 6.9% 11.0% 15.2% 15.3% 12.4% 10.6% 4.1% 8.4% 10.3% 10.8% 14.6% 23.9% 8.3% 15.2% 9.4% 13.0% 12.3% 12.0% STRAFFORD 8.5% 9.9% 6.3% 6.5% 8.5% 10.4% 8.2% 10.1% 7.1% 10.1% 7.4% 4.2% 9.6% 11.6% 6.1% 8.3% 7.0% 14.0% 6.7% GRAFTON 6.1% 5.2% 7.2% 10.3% 3.6% 7.6% 4.6% 1.6% 4.2% 10.3% 8.1% 10.0% 2.8% 5.9% 5.4% 2.1% 7.1% 8.3% 8.2% CHESHIRE 5.5% 5.5% 4.7% 4.1% 7.8% 4.9% 5.2% 3.1% 4.2% 3.8% 9.1% 2.3% 6.6% 9.2% 8.0% 4.6% 3.3% 5.2% 7.8% BELKNAP 4.8% 4.8% 5.9% 10.7% 2.9% 2.9% 3.8% 4.1% 3.3% 5.9% 7.8% 8.8% 3.5% 6.4% 4.6% 2.7% 1.8% 2.0% 8.4% CARROLL 3.9% 5.3% 5.5% 0.9% 3.3% 4.4% 3.2% 6.2% 4.1% 2.0% 8.6% 3.3% 3.0% 3.6% 1.8% 5.1% 3.0% 6.7% SULLIVAN 3.1% 2.9% 1.1% 2.3% 6.4% 2.3% 2.9% 3.1% 1.5% 2.0% 2.3% 5.6% 3.5% 6.4% 3.1% 1.8% 3.0% 2.8% 3.1% COOS 2.2% 2.5% 2.1% 1.5% 1.2% 3.0% 2.7% 2.5% 2.7% 2.6% 1.5% 1.2% 1.2% 0.7% 2.2% 5.2% 2.3% 0.7% 2.4%
- 43. NEW HAMPSHIRE SURVEY-0714 Table 15-3 COUNTY BROWN IMAGE SHAHEEN IMAGE OBAMA JOB APPROVAL GENERIC BALLOT MOOD ----------------------------------------------------------------- ----------------------------------------------------------------- ------------------------------- ------------------------------- -------------------- TOTAL --------- TOT FAV --------- TOT UN FAV -------- HRD NO OPIN --------- NVR HRD --------- NAME ID --------- HARD ID --------- TOT FAV -------- TOT UN FAV --------- HRD NO OPIN --------- NVR HRD --------- NAME ID --------- HARD ID -------- TOT APRV --------- TOT DIS- APRV --------- UND -------- GOP --------- DEM --------- UND --------- RD --------- WT -------- TOTAL 100.0% 100.0% 100.0% 100.0% 100.0% 100.0% 100.0% 100.0% 100.0% 100.0% 100.0% 100.0% 100.0% 100.0% 100.0% 100.0% 100.0% 100.0% 100.0% 100.0% 100.0% HILLSBOROUGH 29.6% 30.1% 31.3% 25.6% 24.5% 29.7% 30.8% 29.9% 30.3% 21.8% 50.1% 29.4% 30.1% 30.2% 29.7% 26.1% 28.4% 31.8% 28.2% 29.9% 29.4% ROCKINGHAM 24.7% 32.0% 22.8% 18.2% 8.1% 25.1% 26.9% 21.1% 28.0% 28.9% 14.5% 24.8% 24.4% 21.1% 27.0% 25.3% 30.1% 20.2% 21.7% 21.5% 26.4% MERRIMACK 11.6% 8.4% 11.6% 17.5% 8.7% 11.7% 10.2% 14.4% 9.2% 9.5% 3.0% 11.7% 11.9% 14.3% 9.8% 12.0% 9.3% 12.7% 14.2% 15.4% 9.5% STRAFFORD 8.5% 7.2% 10.2% 6.9% 10.9% 8.4% 8.8% 8.9% 9.2% 3.8% 8.6% 9.1% 8.3% 9.2% 4.3% 8.0% 9.6% 7.6% 7.8% 8.9% GRAFTON 6.1% 4.0% 5.7% 10.7% 5.4% 6.1% 4.9% 5.4% 5.3% 13.7% 5.2% 6.1% 5.4% 6.6% 5.7% 6.9% 5.3% 5.3% 8.8% 6.8% 5.7% CHESHIRE 5.5% 5.6% 5.4% 5.4% 5.8% 5.5% 5.5% 6.4% 4.7% 5.4% 5.6% 5.6% 5.4% 5.0% 9.8% 5.1% 6.0% 5.6% 4.7% 5.9% BELKNAP 4.8% 5.8% 2.9% 6.8% 7.5% 4.7% 4.2% 4.5% 4.6% 6.2% 15.5% 4.7% 4.5% 5.0% 4.6% 5.1% 5.0% 5.3% 3.6% 5.1% 4.6% CARROLL 3.9% 3.3% 3.9% 4.6% 6.3% 3.8% 3.6% 3.0% 5.5% 1.2% 2.4% 3.9% 4.2% 3.1% 4.6% 2.4% 5.1% 2.8% 3.3% 2.8% 4.5% SULLIVAN 3.1% 1.8% 4.0% 2.9% 7.1% 3.0% 3.0% 4.0% 1.7% 4.5% 9.4% 3.0% 2.9% 4.1% 2.1% 5.8% 1.8% 4.9% 2.6% 4.3% 2.5% COOS 2.2% 1.8% 2.2% 1.3% 15.8% 1.9% 2.0% 2.3% 1.5% 5.0% 2.2% 1.9% 2.0% 2.3% 2.2% 1.8% 1.4% 4.4% 1.6% 2.5%
- 44. NEW HAMPSHIRE SURVEY-0714 Table 15-4 COUNTY US SENATE BALLOT --------------------------------------------------------------------------------------------------- TOTAL --------- PROB BRWN --------- DEF BRWN -------- TOT BRWN --------- TOT UND --------- TOT SHA HEEN --------- DEF SHA HEEN --------- PROB SHA HEEN -------- UN FAV BOTH --------- UND UND --------- TOTAL 100.0% 100.0% 100.0% 100.0% 100.0% 100.0% 100.0% 100.0% 100.0% 100.0% HILLSBOROUGH 29.6% 27.6% 26.5% 26.9% 31.8% 31.4% 29.0% 39.6% 33.5% 33.1% ROCKINGHAM 24.7% 30.3% 32.3% 31.6% 19.1% 20.1% 19.6% 21.9% 25.8% 18.3% MERRIMACK 11.6% 8.8% 7.8% 8.2% 15.9% 13.4% 14.3% 10.6% 8.7% 12.9% STRAFFORD 8.5% 10.9% 6.2% 7.9% 7.1% 9.4% 9.9% 7.9% 12.2% 7.9% GRAFTON 6.1% 4.7% 6.4% 5.8% 6.9% 6.2% 6.4% 5.3% 5.0% 7.6% CHESHIRE 5.5% 5.1% 6.1% 5.7% 5.0% 5.4% 6.2% 2.9% 3.4% 5.9% BELKNAP 4.8% 4.6% 6.2% 5.6% 3.1% 4.5% 5.3% 2.1% 1.1% 3.9% CARROLL 3.9% 5.1% 4.8% 4.9% 4.6% 2.8% 3.1% 1.7% 7.2% 2.7% SULLIVAN 3.1% 1.7% 2.1% 1.9% 1.6% 4.6% 4.9% 3.4% 1.0% 1.4% COOS 2.2% 1.3% 1.6% 1.5% 4.9% 2.1% 1.3% 4.6% 2.1% 6.2%