National Mining Association Kentucky EPA Regulation Survey Summary 091014
•
1 j'aime•2,036 vues

The survey found that a majority of Kentucky voters still oppose the proposed EPA emission regulation, with 32% supporting it and 53% opposing it. The survey also shows Mitch McConnell leading Alison Lundergan Grimes in the race for US Senate by 8 points. Additional information and questions about the emission regulation showed most voters were more likely to oppose it, especially when informed it could increase energy costs and eliminate jobs.

Recommandé
Recommandé
Contenu connexe
Tendances
Tendances (19)
En vedette
En vedette (17)
Similaire à National Mining Association Kentucky EPA Regulation Survey Summary 091014
Similaire à National Mining Association Kentucky EPA Regulation Survey Summary 091014 (20)
Dernier
Dernier (20)
National Mining Association Kentucky EPA Regulation Survey Summary 091014
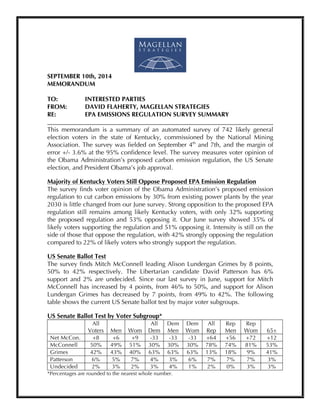
- 1. ! SEPTEMBER 10th, 2014 MEMORANDUM TO: INTERESTED PARTIES FROM: DAVID FLAHERTY, MAGELLAN STRATEGIES RE: EPA EMISSIONS REGULATION SURVEY SUMMARY ________________________________________________________________________ This memorandum is a summary of an automated survey of 742 likely general election voters in the state of Kentucky, commissioned by the National Mining Association. The survey was fielded on September 4th and 7th, and the margin of error +/- 3.6% at the 95% confidence level. The survey measures voter opinion of the Obama Administration’s proposed carbon emission regulation, the US Senate election, and President Obama’s job approval. Majority of Kentucky Voters Still Oppose Proposed EPA Emission Regulation The survey finds voter opinion of the Obama Administration’s proposed emission regulation to cut carbon emissions by 30% from existing power plants by the year 2030 is little changed from our June survey. Strong opposition to the proposed EPA regulation still remains among likely Kentucky voters, with only 32% supporting the proposed regulation and 53% opposing it. Our June survey showed 35% of likely voters supporting the regulation and 51% opposing it. Intensity is still on the side of those that oppose the regulation, with 42% strongly opposing the regulation compared to 22% of likely voters who strongly support the regulation. US Senate Ballot Test The survey finds Mitch McConnell leading Alison Lundergan Grimes by 8 points, 50% to 42% respectively. The Libertarian candidate David Patterson has 6% support and 2% are undecided. Since our last survey in June we find an 11-point swing in favor of Mitch McConnell, with support for him increasing by 4 points, from 46% to 50%, and support for Alison Lundergan Grimes declining by 7 points, from 49% to 42%. The following table shows the current US Senate ballot test by major voter subgroups. US Senate Ballot Test by Voter Subgroup* All Voters Men Wom All Dem Dem Men Dem Wom All Rep Rep Men Rep Wom 65+ Net McCon. +8 +6 +9 -33 -33 -33 +64 +56 +72 +12 McConnell 50% 49% 51% 30% 30% 30% 78% 74% 81% 53% Grimes 42% 43% 40% 63% 63% 63% 13% 18% 9% 41% Patterson 6% 5% 7% 4% 3% 6% 7% 7% 7% 3% Undecided 2% 3% 2% 3% 4% 1% 2% 0% 3% 3% *Percentages are rounded to the nearest whole number.
- 2. Magellan Strategies-NMA Kentucky EPA Emissions Regulation Survey Summary September 9th, 2014 Magellan Strategies |1685 Boxelder Street, Suite 300 | Louisville, CO 80027 MagellanStrategies.com | 303-861-8585 2 Key Findings: ! 32.3% of likely voters supporting the emissions proposal, 52.8% oppose the proposal and 14.9% of voters not having an opinion about the proposal. ! 57.1% of respondents are more likely to oppose a candidate for the US Senate that supports the new emission regulation and 28.3% are more likely to support a candidate that supports the regulation. ! When voters were informed of EPA Administrator Gina McCarthy’s quote that there will be a “short term hit” to consumers, 63.6% of respondents were more likely to oppose the proposal, 16.8% were more likely to support it, and 17.6% responded it made no difference in their decision to support or oppose the proposal. ! When voters are informed that the EPA proposal would require 50 states to meet their carbon emission target limits through state-based cap and trade, tax and regulatory programs, 51.9% of respondents are more likely to oppose the proposal, 19.1% are more likely to support it, and 23.7% responded that it made no difference in their decision to support or oppose the proposal. ! When voters are informed the US Chamber of Commerce found that a similar carbon emissions proposal would result in the loss of 224,000 jobs each year through 2030, and cost $50 billion to the economy, an average of 64.9% of respondents are more likely to oppose the proposal, 15.1% are more likely to support it, and the information made no difference to 16.6% of respondents. ! When asked which candidate for the United States Senate best represents and supports the coal miners of Kentucky, 54.1% chose Mitch McConnell and 39.2% chose Alison Lundergan Grimes. Conclusions The findings of the survey clearly indicates that the Obama administration’s proposed emission regulation is unpopular among likely voters in Kentucky, and that Mitch McConnell is viewed as the candidate that best represents the significant voting block of coal miners in Kentucky. In addition, the President is extremely unpopular with a dismal job approval rating of 32% approve/63% disapprove. The administration’s emission proposal is opposed by 53% of likely voters, including 40% of Democrat voters. Considering the importance of coal and coal mining jobs to the Kentucky economy, it is no surprise that this is a very difficult issue for Alison Lundergan Grimes to navigate in this political environment.
- 3. Magellan Strategies-NMA Kentucky EPA Emissions Regulation Survey Summary September 9th, 2014 Magellan Strategies |1685 Boxelder Street, Suite 300 | Louisville, CO 80027 MagellanStrategies.com | 303-861-8585 3 Survey Commissioned By The National Mining Association, the national trade group representing the US mining industry, commissioned this survey research project. Survey Methodology This survey was conducted using automated voice recorded technology. The sample for each state was randomly drawn from a Kentucky voter file. The results were weighted based upon past voting demographics of the non-Presidential voting population, and are included in this document. Any questions regarding the methodology of this survey should be directed to David Flaherty of Magellan Strategies at dflaherty@magellanstrategies.com or 303-861-8585. About Magellan Strategies Magellan Strategies is a full-service survey research firm offering quantitative, qualitative, and predictive data modeling services to Republican candidates, campaigns and trade associations.
- 4. !!!!! Kentucky NMA EPA Regulation Issue Survey Topline Results Magellan Strategies are pleased to present the topline results for a 742n autodial survey of likely general election voters in the state of Kentucky. The interviews were conducted September 4th and 7th, 2014. This survey has a margin of error of +/- 3.6% at the 95 percent confidence interval. This survey was weighted based upon past general election voting demographics. T1. Are you registered to vote as a Republican, a Democrat or an independent voter? Democrat ................................................................ 56% Republican .............................................................. 40% Independent .............................................................. 4% T2. How likely are you to vote in the 2014 November general election? Extremely likely ....................................................... 88% Very likely ................................................................. 9% Somewhat likely ........................................................ 3% T3. Do you approve or disapprove of the job Barack Obama is doing as President? Approve .................................................................. 32% Disapprove ............................................................. 62% Unsure or no opinion ................................................ 6% T4. If the election for the United States Senate were being held today, would you vote for Alison Lundergan Grimes, the Democrat candidate, Mitch McConnell, the Republican candidate or David Patterson, the Libertarian candidate? Mitch McConnell .................................................... 50% Alison Lundergan Grimes ........................................ 42% David Patterson ......................................................... 6% Undecided ................................................................ 2%
- 5. Magellan ID#: KYNMA-090414 Kentucky NMA EPA Regulation Issue Survey Topline Results Field Dates: 9/4/14 and 9/7/14, MoE +/- 3.6%, 742n, CONFIDENTIAL Magellan Strategies | 1685 Boxelder St. Suite 300 | Louisville, CO 80027 www.MagellanStrategies.com | (303) 861-8585 2 T5. Which candidate for the United States Senate do you think best represents and supports the coal miners of Kentucky, Alison Lundergan Grimes or Mitch McConnell? Mitch McConnell .................................................... 54% Alison Lundergan Grimes ........................................ 39% Undecided ................................................................ 7% T6. As you may know, the Obama Administration’s Environmental Protection Agency in June proposed a new regulation to cut carbon emissions by 30% from existing power plants by the year 2030. From what you have seen, read and heard about the new regulation, do you support it or oppose it? Total Support .......................................................... 32% Total Oppose .......................................................... 53% Strongly support ...................................................... 22% Somewhat support ................................................. 10% Strongly oppose ...................................................... 42% Somewhat oppose .................................................. 11% Unsure or no opinion .............................................. 15% T7. Which is more important to you, President Obama focusing his time and attention on creating a new regulation for power plants to combat climate change or focusing his attention on creating jobs and growing our economy? Focusing on creating jobs and the economy ........... 81% Focusing on new regulation for power plants .......... 12% Unsure or no opinion ................................................ 7% I am now going to read to you some more information about the new regulation. After hearing the information, please tell me if you are more likely to support or oppose the new regulation, or if it makes no difference in your opinion. T8. The EPA regulation requires the states to reduce carbon emissions by 30% by 2030, which would reduce global carbon emissions by a very small amount. More likely to support the new regulation ............... 22% More likely to oppose the new regulation .............. 53% No difference in your decision ................................ 20% Unsure or no opinion ............................................... 5%
- 6. Magellan ID#: KYNMA-090414 Kentucky NMA EPA Regulation Issue Survey Topline Results Field Dates: 9/4/14 and 9/7/14, MoE +/- 3.6%, 742n, CONFIDENTIAL Magellan Strategies | 1685 Boxelder St. Suite 300 | Louisville, CO 80027 www.MagellanStrategies.com | (303) 861-8585 3 T9. The EPA regulation would require the 50 states to meet their carbon emission target limits through state based cap-and-trade, tax, and regulatory programs. More likely to support the new regulation ............... 19% More likely to oppose the new regulation .............. 52% No difference in your decision ................................ 24% Unsure or no opinion ............................................... 5% T10. If the proposed regulation goes into effect consumer’s and businesses electricity bills will increase. The Administrator of the Environmental Protection Agency Gina McCarthy herself admitted that there would be a short-term hit to consumers. More likely to support the new regulation ............... 17% More likely to oppose the new regulation .............. 64% No difference in your decision ................................ 17% Unsure or no opinion ............................................... 2% T11. The US Chamber of Commerce, a pro-business organization has found that a similar carbon regulations proposal would result in 224,000 job losses each year through 2030, and impose $50 billion dollars in costs to the economy. More likely to support the new regulation ............... 15% More likely to oppose the new regulation .............. 65% No difference in your decision ................................ 17% Unsure or no opinion ............................................... 3% T12. Thinking now about the election this November, are you more likely to support or oppose a candidate for the United States Senate that supports the Obama Administration’s new carbon emission regulation? More likely to support a candidate that supports ..... 28% More likely to oppose a candidate that supports ..... 57% Unsure or no opinion ............................................. 15% T13. For statistical purposes, are you a man or a woman? Woman ................................................................... 52% Man ........................................................................ 48%
- 7. Magellan ID#: KYNMA-090414 Kentucky NMA EPA Regulation Issue Survey Topline Results Field Dates: 9/4/14 and 9/7/14, MoE +/- 3.6%, 742n, CONFIDENTIAL Magellan Strategies | 1685 Boxelder St. Suite 300 | Louisville, CO 80027 www.MagellanStrategies.com | (303) 861-8585 4 T14. Which of the following age groups applies to you? 18-29 ........................................................................ 6% 30-44 ...................................................................... 20% 45-54 ...................................................................... 20% 55-64 ...................................................................... 23% 65+ ......................................................................... 31% Unsure or no opinion ................................................ 0% T15. For statistical purposes only, what is your race? Press 1 if you are white, press 2 if you are Hispanic or Latino, press 3 if you are black or African American, press 4 if you belong to another racial group. White ...................................................................... 90% Black or African American ........................................ 5% Hispanic or Latino ..................................................... 2% Another ethnic group ................................................ 3% Survey Methodology This survey was conducted using automated telephone touchtone technology. The sample used for this survey was randomly drawn from a Kentucky voter file. The survey response data was weighted based upon past general election voting demographics. The interviews were conducted on September 4th and 7th, 2014. Three attempts were made to interview each household in the sample. This survey has a margin of error of 3.6% at the 95 percent confidence interval.
- 8. Magellan Strategies Kentucky Statewide General Election Survey Demographics Gender 2012 General 2010 General 2008 General 2006 General Female 975,988 53.8% 726,107 52.3% 966,372 54.4% 0 NaN Male 837,519 46.2% 660,993 47.7% 808,701 45.6% 0 NaN Unknown 57 0.0% 35 0.0% 68 0.0% 0 NaN Total 1,813,564 1,387,135 1,775,141 0 Age Group 2012 General 2010 General 2008 General 2006 General (1) 18 to 29 199,956 11.0% 77,186 5.6% 129,105 7.3% 0 NaN (2) 30 to 44 417,068 23.0% 277,715 20.0% 421,958 23.8% 0 NaN (3) 45 to 54 350,598 19.3% 275,031 19.8% 353,753 19.9% 0 NaN (4) 55 to 64 379,067 20.9% 320,774 23.1% 381,309 21.5% 0 NaN (5) 65 + 466,299 25.7% 435,842 31.4% 488,095 27.5% 0 NaN (6) Age Unk 576 0.0% 587 0.0% 921 0.1% 0 NaN Total 1,813,564 1,387,135 1,775,141 0 Party 2012 General 2010 General 2008 General 2006 General (1) Rep 724,345 39.9% 556,499 40.1% 681,829 38.4% 0 NaN (2) Dem 989,234 54.5% 771,546 55.6% 1,000,492 56.4% 0 NaN (3) Oth 99,985 5.5% 59,090 4.3% 92,820 5.2% 0 NaN Total 1,813,564 1,387,135 1,775,141 0 Hispanic 2012 General 2010 General 2008 General 2006 General (1) Hisp Surname 11,252 0.6% 6,067 0.4% 10,180 0.6% 0 NaN (2) Not Hisp Surname 1,802,312 99.4% 1,381,068 99.6% 1,764,961 99.4% 0 NaN Total 1,813,564 1,387,135 1,775,141 0 DMA 2012 General 2010 General 2008 General 2006 General 12,330 0.7% 9,974 0.7% 11,898 0.7% 0 NaN 515 194,515 10.7% 130,699 9.4% 190,029 10.7% 0 NaN 529 570,806 31.5% 436,889 31.5% 566,624 31.9% 0 NaN 531 13,966 0.8% 13,088 0.9% 12,189 0.7% 0 NaN 541 503,454 27.8% 393,699 28.4% 489,494 27.6% 0 NaN 557 26,566 1.5% 23,673 1.7% 23,917 1.3% 0 NaN 564 109,627 6.0% 85,080 6.1% 106,912 6.0% 0 NaN 632 106,811 5.9% 81,871 5.9% 104,256 5.9% 0 NaN 649 123,484 6.8% 94,280 6.8% 121,223 6.8% 0 NaN 659 70,509 3.9% 55,800 4.0% 68,408 3.9% 0 NaN 736 81,496 4.5% 62,082 4.5% 80,191 4.5% 0 NaN Total 1,813,564 1,387,135 1,775,141 0 Region 2012 General 2010 General 2008 General 2006 General CD01 298,385 16.5% 235,701 17.0% 289,912 16.3% 0 NaN CD02 296,230 16.3% 226,871 16.4% 291,537 16.4% 0 NaN CD03 328,235 18.1% 245,107 17.7% 328,847 18.5% 0 NaN CD04 313,858 17.3% 222,800 16.1% 307,844 17.3% 0 NaN CD05 266,648 14.7% 224,909 16.2% 253,701 14.3% 0 NaN CD06 310,208 17.1% 231,747 16.7% 303,300 17.1% 0 NaN Total 1,813,564 1,387,135 1,775,141 0 Gender Tot Reg Female 1,611,986 52.9% Male 1,436,956 47.1% Unknown 124 0.0% Total 3,049,066 Age Group Tot Reg (1) 18 to 29 464,461 15.2% (2) 30 to 44 807,592 26.5% (3) 45 to 54 566,355 18.6% (4) 55 to 64 547,464 18.0% (5) 65 + 660,931 21.7% (6) Age Unk 2,263 0.1% Total 3,049,066 Party Tot Reg (1) Rep 1,158,820 38.0% (2) Dem 1,667,357 54.7% (3) Oth 222,889 7.3% Total 3,049,066 Hispanic Tot Reg (1) Hisp Surname 26,263 0.9% (2) Not Hisp Surname 3,022,803 99.1% Total 3,049,066 DMA Tot Reg 18,416 0.6% 515 328,192 10.8% 529 914,596 30.0% 531 24,959 0.8% 541 858,743 28.2% 557 51,031 1.7% 564 212,671 7.0% 632 172,625 5.7% 649 203,964 6.7% 659 126,312 4.1% 736 137,557 4.5% Total 3,049,066 Region Tot Reg CD01 502,870 16.5% CD02 498,765 16.4% CD03 513,679 16.8% CD04 523,127 17.2% CD05 508,863 16.7% CD06 501,762 16.5% Total 3,049,066 Page 1 - 9/3/2014 12:09:07 PM Report Type: General Election Demographics Summary Kentucky Geography: Statewide - Kentucky Demographics: Age= ALL, Gender= ALL, Ethnicity= ALL, Party= ALL