EIA Drilling Productivity Report - Oct 2013
•
1 j'aime•1,093 vues

The very first Drilling Productivity Report (DRP) issued by the U.S. Energy Information Administation. The report, using charts and graphs, shows how efficient (or not) rigs are at drilling, and how productive (or not) wells are, by region/shale play. Among the very important metrics tracked is the decline rate of newly drilled wells–how quickly the gas and oil flowing out of shale wells peters out. This first report shows the Marcellus Shale has (astonishingly) hit 12 billion cubic feet per day of natural gas production.

Recommandé
Recommandé
Contenu connexe
Tendances
Tendances (19)
Similaire à EIA Drilling Productivity Report - Oct 2013
Similaire à EIA Drilling Productivity Report - Oct 2013 (12)
Plus de Marcellus Drilling News
Plus de Marcellus Drilling News (20)
Dernier
Dernier (13)
EIA Drilling Productivity Report - Oct 2013
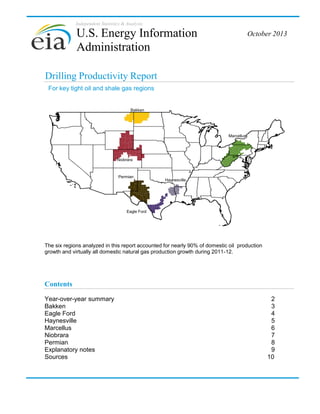
- 1. Independent Statistics & Analysis U.S. Energy Information Administration October 2013 Drilling Productivity Report For key tight oil and shale gas regions Bakken Marcellus Niobrara Permian Haynesville Eagle Ford The six regions analyzed in this report accounted for nearly 90% of domestic oil production growth and virtually all domestic natural gas production growth during 2011-12. Contents Year-over-year summary Bakken Eagle Ford Haynesville Marcellus Niobrara Permian Explanatory notes Sources 2 3 4 5 6 7 8 9 10
- 2. Year-over-year summary October 2013 drilling data through September projected production through November Drilling Productivity Report New-well oil production per rig New-well gas production per rig barrels/day thousand cubic feet/day November-2012 November-2013 November-2012 1,000 November-2013 6,000 5,000 750 4,000 3,000 500 2,000 250 1,000 0 0 Bakken Eagle Ford Haynesville Marcellus Niobrara Legacy oil production change Eagle Ford Haynesville Marcellus Niobrara Permian Marcellus Niobrara Permian Legacy gas production change thousand barrels/day Bakken Bakken Permian million cubic feet/day Eagle Ford Haynesville Marcellus Niobrara Permian 0 Bakken Eagle Ford Haynesville 0 (50) (10) (100) (20) (150) (30) (200) (40) (250) (300) (50) (350) (60) (400) November-2012 November-2013 (450) (70) November-2012 November-2013 Indicated monthly change in oil production (Nov vs. Oct) Indicated monthly change in gas production (Nov vs. Oct) thousand barrels/day million cubic feet/day November-2012 November-2012 November-2013 November-2013 500 40 400 30 300 20 200 10 100 0 0 -100 -10 -200 -300 -20 Bakken Eagle Ford Haynesville Marcellus Niobrara Bakken Permian Eagle Ford Haynesville Oil production Niobrara Permian Natural gas production thousand barrels/day Marcellus million cubic feet/day November-2012 November-2012 November-2013 2,000 12,000 1,600 November-2013 10,000 8,000 1,200 6,000 800 4,000 400 2,000 0 0 Bakken Eagle Ford Haynesville Marcellus Niobrara Permian U. S. Energy Information Administration | Drilling Productivity Report Bakken Eagle Ford Haynesville Marcellus Niobrara Permian 2
- 3. Bakken October 2013 drilling data through September projected production through November Drilling Productivity Report 482 459 Oil +23 barrels/day month over month Monthly additions from one average rig November October barrels/day Bakken New-well oil production per rig Rig count rigs barrels/day 600 October Bakken New-well gas production per rig 200 400 thousand cubic feet/day month over month thousand cubic feet/day 250 rig count Gas +18 Rig count rigs thousand cubic feet/day 3,600 3,000 new-well oil production per rig 500 463 445 November 150 300 250 new-well gas production per rig 2,400 200 rig count 150 1,800 100 200 50 100 0 2007 0 2008 2009 2010 2011 2012 2013 100 1,200 50 600 0 2007 0 2008 2009 2010 Bakken Legacy oil production change 2012 2013 Bakken Legacy gas production change thousand barrels/day 0 2011 million cubic feet/day 0 (10) (10) (20) (20) (30) (30) (40) (40) (50) (60) (50) (70) 2007 (60) 2007 2008 2009 2010 2011 2012 2013 2008 2009 2010 2011 2012 2013 Bakken Indicated change in oil production (Nov vs. Oct) Bakken Indicated change in natural gas production (Nov vs. Oct) thousand barrels/day 100 million cubic feet/day 100 +86 -60 +26 50 -54 +29 50 0 +83 0 Oct 935 Mbbl/d Production from new wells Legacy production change Bakken Oil production Net change Nov 961 Mbbl/d Oil +26 thousand barrels/day month over month thousand barrels/day 1,000 Oct 1,067 MMcf/d Production from new wells Legacy production change Bakken Natural gas production Net change Nov 1,096 MMcf/d Gas +29 million cubic feet/day month over month million cubic feet/day 6,000 5,000 800 4,000 600 3,000 400 2,000 200 0 2007 1,000 2008 2009 2010 2011 2012 U. S. Energy Information Administration | Drilling Productivity Report 2013 0 2007 2008 2009 2010 2011 2012 2013 3
- 4. Eagle Ford October 2013 drilling data through September projected production through November Drilling Productivity Report 404 396 Oil +8 barrels/day month over month Monthly additions from one average rig November October barrels/day Eagle Ford New-well oil production per rig Rig count rigs barrels/day 600 Eagle Ford New-well gas production per rig 150 200 100 100 50 0 2008 2009 2010 2011 2012 2013 Rig count rigs 3,000 200 300 thousand cubic feet/day month over month thousand cubic feet/day 3,600 250 400 Gas +16 thousand cubic feet/day 300 rig count 0 2007 October 1,010 994 350 new-well oil production per rig 500 November 350 new-well gas production per rig 2,400 300 rig count 250 200 1,800 150 1,200 100 600 0 2007 50 0 2008 2009 2010 Eagle Ford Legacy oil production change 2012 2013 Eagle Ford Legacy gas production change thousand barrels/day 0 (10) (20) (30) (40) (50) (60) (70) (80) (90) 2007 2008 2011 million cubic feet/day 0 (20) (40) (60) (80) (100) (120) 2009 2010 2011 2012 2013 (140) 2007 2008 2009 2010 2011 2012 2013 Eagle Ford Indicated change in oil production (Nov vs. Oct) Eagle Ford Indicated change in natural gas production (Nov vs. Oct) thousand barrels/day million cubic feet/day +261 300 250 200 150 100 50 0 Oct Production 4,404 from MMcf/d new wells +105 -81 +24 100 50 0 Oct 1,069 Mbbl/d Production from new wells Legacy production change Eagle Ford Oil production Net change Nov 1,093 Mbbl/d Oil +24 thousand barrels/day month over month thousand barrels/day 1,200 +128 Legacy production change Eagle Ford Natural gas production Net change Nov 4,532 MMcf/d Gas +128 million cubic feet/day month over month million cubic feet/day 7,000 6,000 1,000 5,000 800 4,000 600 3,000 400 2,000 200 0 2007 -133 1,000 2008 2009 2010 2011 2012 U. S. Energy Information Administration | Drilling Productivity Report 2013 0 2007 2008 2009 2010 2011 2012 2013 4
- 5. Haynesville October 2013 drilling data through September projected production through November Drilling Productivity Report 45 44 Oil +1 barrels/day month over month Monthly additions from one average rig November October barrels/day Haynesville New-well oil production per rig Rig count rigs barrels/day 1,000 November October 5,018 4,983 Gas +35 thousand cubic feet/day month over month thousand cubic feet/day Haynesville New-well gas production per rig Rig count rigs 300 250 400 200 0 2007 150 2,000 100 50 600 3,000 100 rig count 4,000 150 800 5,000 200 new-well oil production per rig thousand cubic feet/day 6,000 1,000 50 0 2008 2009 2010 2011 2012 2013 300 new-well gas production per rig 250 rig count 0 2007 200 0 2008 2009 2010 Haynesville Legacy oil production change 2012 2013 Haynesville Legacy gas production change thousand barrels/day 0 2011 million cubic feet/day 0 (100) (200) (1) (300) (400) (2) (500) (600) (3) 2007 2008 2009 2010 2011 2012 2013 (700) 2007 2008 2009 2010 2011 2012 2013 Haynesville Indicated change in oil production (Nov vs. Oct) Haynesville Indicated change in natural gas production (Nov vs. Oct) thousand barrels/day million cubic feet/day 250 2.0 +2 +1 -1 1.5 -50 0.0 -120 50 0.5 -348 150 1.0 +228 -150 Oct 61 Mbbl/d Production from new wells Legacy production change Haynesville Oil production Net change Nov 62 Mbbl/d Oil +1 thousand barrels/day month over month thousand barrels/day 2,000 Oct 6,721 MMcf/d Production from new wells Legacy production change Haynesville Natural gas production Net change Nov 6,601 MMcf/d Gas -120 million cubic feet/day month over month million cubic feet/day 12,000 10,000 1,600 8,000 1,200 6,000 800 4,000 400 0 2007 2,000 2008 2009 2010 2011 2012 U. S. Energy Information Administration | Drilling Productivity Report 2013 0 2007 2008 2009 2010 2011 2012 2013 5
- 6. Marcellus October 2013 drilling data through September projected production through November Drilling Productivity Report 38 36 Oil +2 barrels/day month over month Monthly additions from one average rig November October barrels/day Marcellus New-well oil production per rig Rig count rigs barrels/day 1,000 160 140 120 100 80 60 40 20 0 new-well oil production per rig 800 rig count 600 400 200 0 2007 2008 2009 2010 2011 2012 2013 November October 5,980 5,820 Gas +160 thousand cubic feet/day month over month thousand cubic feet/day Marcellus New-well gas production per rig Rig count rigs thousand cubic feet/day 6,000 160 140 120 100 80 60 40 20 0 new-well gas production per rig 4,800 rig count 3,600 2,400 1,200 0 2007 2008 2009 2010 Marcellus Legacy oil production change 2012 2013 Marcellus Legacy gas production change thousand barrels/day 0 2011 million cubic feet/day 0 (40) (1) (80) (120) (2) (160) (3) 2007 2008 2009 2010 2011 2012 2013 (200) 2007 2008 2009 2010 2011 2012 2013 Marcellus Indicated change in oil production (Nov vs. Oct) Marcellus Indicated change in natural gas production (Nov vs. Oct) thousand barrels/day 4.0 million cubic feet/day 600 +4 +3 -1 3.0 +579 -171 +408 400 2.0 200 1.0 0.0 0 Oct 48 Mbbl/d Production from new wells Legacy production change Marcellus Oil production Net change Nov 51 Mbbl/d Oil +3 thousand barrels/day month over month thousand barrels/day 2,000 Oct 12,237 MMcf/d Production from new wells Legacy production change Marcellus Natural gas production Net change Nov 12,645 MMcf/d Gas +408 million cubic feet/day month over month million cubic feet/day 14,000 12,000 1,600 10,000 1,200 8,000 800 6,000 4,000 400 0 2007 2,000 2008 2009 2010 2011 2012 U. S. Energy Information Administration | Drilling Productivity Report 2013 0 2007 2008 2009 2010 2011 2012 2013 6
- 7. Niobrara October 2013 drilling data through September projected production through November Drilling Productivity Report 312 305 Oil +7 barrels/day month over month Monthly additions from one average rig November October barrels/day Niobrara New-well oil production per rig Rig count rigs barrels/day 600 October 978 1,038 rig count 3,000 80 300 60 200 40 100 20 0 2008 2009 2010 2011 2012 2013 Rig count rigs thousand cubic feet/day 3,600 100 400 thousand cubic feet/day month over month Niobrara New-well gas production per rig 120 new-well oil production per rig Gas -60 thousand cubic feet/day 140 500 0 2007 November 140 120 100 2,400 80 1,800 60 1,200 600 0 2007 40 new-well gas production per rig 20 rig count 2008 2009 0 2010 Niobrara Legacy oil production change 2012 2013 Niobrara Legacy gas production change thousand barrels/day 0 2011 million cubic feet/day 0 (5) (50) (10) (100) (15) (150) (20) (200) (25) 2007 (250) 2007 2008 2009 2010 2011 2012 2013 2008 2009 2010 2011 2012 2013 Niobrara Indicated change in oil production (Nov vs. Oct) Niobrara Indicated change in natural gas production (Nov vs. Oct) thousand barrels/day million cubic feet/day 100 +30 +7 -23 30 +94 -154 -60 50 20 0 10 -50 0 -100 Oct 260 Mbbl/d Production from new wells Legacy production change Niobrara Oil production Net change Nov 267 Mbbl/d Oil +7 thousand barrels/day month over month thousand barrels/day 1,000 Oct 4,610 MMcf/d Production from new wells Legacy production change Niobrara Natural gas production Net change Nov 4,550 MMcf/d Gas -60 million cubic feet/day month over month million cubic feet/day 6,000 5,000 800 4,000 600 3,000 400 2,000 200 0 2007 1,000 2008 2009 2010 2011 2012 U. S. Energy Information Administration | Drilling Productivity Report 2013 0 2007 2008 2009 2010 2011 2012 2013 7
- 8. Permian October 2013 drilling data through September projected production through November Drilling Productivity Report 79 79 Oil 0 barrels/day month over month Monthly additions from one average rig November October barrels/day Permian New-well oil production per rig Rig count rigs barrels/day 600 175 173 November October Gas +2 thousand cubic feet/day month over month thousand cubic feet/day Permian New-well gas production per rig Rig count rigs 600 thousand cubic feet/day 3,600 500 3,000 400 400 2,400 300 300 1,800 300 200 200 1,200 200 100 100 600 100 new-well oil production per rig 500 rig count 0 2007 0 2008 2009 2010 2011 2012 2013 600 new-well gas production per rig 0 2007 500 rig count 400 0 2008 2009 2010 Permian Legacy oil production change 2012 2013 Permian Legacy gas production change thousand barrels/day 0 2011 million cubic feet/day 0 (5) (20) (10) (40) (15) (60) (20) (80) (25) (30) (100) (35) (120) (40) 2007 (140) 2007 2008 2009 2010 2011 2012 2013 2008 2009 2010 2011 2012 2013 Permian Indicated change in oil production (Nov vs. Oct) Permian Indicated change in natural gas production (Nov vs. Oct) thousand barrels/day million cubic feet/day 80 +35 +1 -34 30 +77 -74 +3 60 20 40 10 20 0 0 Oct 1,292 Mbbl/d Production from new wells Legacy production change Permian Oil production Net change Nov 1,292 Mbbl/d Oil +1 thousand barrels/day month over month thousand barrels/day 1,400 1,200 1,000 800 600 400 200 0 2007 2008 2009 2010 2011 2012 U. S. Energy Information Administration | Drilling Productivity Report 2013 Oct 4,735 MMcf/d Production from new wells Legacy production change Permian Natural gas production million cubic feet/day 8,000 7,000 6,000 5,000 4,000 3,000 2,000 1,000 0 2007 2008 2009 Net change Nov 4,739 MMcf/d Gas +3 million cubic feet/day month over month 2010 2011 2012 2013 8
- 9. Explanatory notes October 2013 Drilling Productivity Report The Drilling Productivity Report uses recent data on the total number of drilling rigs in operation along with estimates of drilling productivity and estimated changes in production from existing oil and natural gas wells to provide estimated changes in oil and natural gas production for six key fields. EIA’s approach does not distinguish between oil-directed rigs and gas-directed rigs because once a well is completed it may produce both oil and gas; more than half of the wells do that. Monthly additions from one average rig Monthly additions from one average rig represent EIA’s estimate of an average rig’s1 contribution to production of oil and natural gas from new wells.2 The estimation of new-well production per rig uses several months of recent historical data on total production from new wells for each field divided by the region's monthly rig count, lagged by two months.3 Current- and next-month values are listed on the top header. The month-over-month change is listed alongside, with +/- signs and color-coded arrows to highlight the growth or decline in oil (brown) or natural gas (blue). New-well oil/gas production per rig Charts present historical estimated monthly additions from one average rig coupled with the number of total drilling rigs as reported by Baker Hughes. Legacy oil and natural gas production change Charts present EIA’s estimates of total oil and gas production changes from all the wells other than the new wells. The trend is dominated by the well depletion rates, but other circumstances can influence the direction of the change. For example, well freeze-offs or hurricanes can cause production to significantly decline in any given month, resulting in a production increase the next month when production simply returns to normal levels. Projected change in monthly oil/gas production Charts present the combined effects of new-well production and changes to legacy production. Total new-well production is offset by the anticipated change in legacy production to derive the net change in production. The estimated change in production does not reflect external circumstances that can affect the actual rates, such as infrastructure constraints, bad weather, or shut-ins based on environmental or economic issues. Oil/gas production Charts present oil and natural gas production from both new and legacy wells since 2007. This production is based on all wells reported to the state oil and gas agencies. Where state data are not immediately available, EIA estimates the production based on estimated changes in new-well oil/gas production and the corresponding legacy change. Footnotes: 1. The monthly average rig count used in this report is calculated from weekly data on total oil and gas rigs reported by Baker Hughes 2. A new well is defined as one that began producing for the first time in the previous month. Each well belongs to the new-well category for only one month. Reworked and recompleted wells are excluded from the calculation. 3. Rig count data lag production data because EIA has observed that the best predictor of the number of new wells beginning production in a given month is the count of rigs in operation two months earlier. U. S. Energy Information Administration | Drilling Productivity Report 9
- 10. Sources October 2013 Drilling Productivity Report The data used in the preparation of this report come from the following sources. EIA is solely responsible for the analysis, calculations, and conclusions. Drilling Info (http://www.drillinginfo.com) Source of production, permit, and spud data for counties associated with this report. Source of real-time rig location to estimate new wells spudded and completed throughout the United States. Baker Hughes (http://www.bakerhughes.com) Source of rig and well counts by county, state, and basin. North Dakota Oil and Gas Division (https://www.dmr.nd.gov/oilgas) Source of well production, permit, and completion data in the counties associated with this report in North Dakota Railroad Commission of Texas (http://www.rrc.state.tx.us) Source of well production, permit, and completion data in the counties associated with this report in Texas Pennsylvania Department of Environmental Protection (https://www.paoilandgasreporting.state.pa.us/publicreports/Modules/Welcome/Welcome.aspx) Source of well production, permit, and completion data in the counties associated with this report in Pennsylvania West Virginia Department of Environmental Protection (http://www.dep.wv.gov/oil-andgas/Pages/default.aspx) Source of well production, permit, and completion data in the counties associated with this report in West Virginia Colorado Oil and Gas Conservation Commission (http://cogcc.state.co.us) Source of well production, permit, and completion data in the counties associated with this report in Colorado Wyoming Oil and Conservation Commission (http://wogcc.state.wy.us ) Source of well production, permit, and completion data in the counties associated with this report in Wyoming Louisiana Department of Natural Resources (http://dnr.louisiana.gov) Source of well production, permit, and completion data in the counties associated with this report in Louisiana U. S. Energy Information Administration | Drilling Productivity Report 10