1221 w wagnermarket19141
•
0 j'aime•314 vues

Market Tend for Philadelphia Zipcode 19141

Recommandé
Recommandé
Contenu connexe
En vedette
En vedette (20)
Similaire à 1221 w wagnermarket19141
Similaire à 1221 w wagnermarket19141 (20)
Plus de Coldwell Banker Preferred Blue Bell
Plus de Coldwell Banker Preferred Blue Bell (11)
Dernier
Dernier (20)
1221 w wagnermarket19141
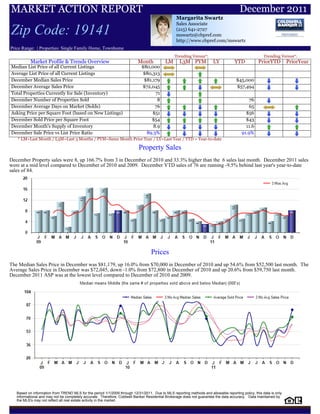
- 1. MARKET ACTION REPORT December 2011 Margarita Swartz Sales Associate Zip Code: 19141 (215) 641-2727 mswartz@cbpref.com http://www.cbpref.com/mswartz Price Range: | Properties: Single Family Home, Townhome Trending Versus*: Trending Versus*: Market Profile & Trends Overview Month LM L3M PYM LY YTD PriorYTD PriorYear Median List Price of all Current Listings $80,000 Average List Price of all Current Listings $80,313 December Median Sales Price $81,179 $45,000 December Average Sales Price $72,045 $57,494 Total Properties Currently for Sale (Inventory) 71 December Number of Properties Sold 8 76 December Average Days on Market (Solds) 76 65 Asking Price per Square Foot (based on New Listings) $51 $56 December Sold Price per Square Foot $54 $43 December Month's Supply of Inventory 8.9 11.6 December Sale Price vs List Price Ratio 89.3% 91.9% * LM=Last Month / L3M=Last 3 Months / PYM=Same Month Prior Year / LY=Last Year / YTD = Year-to-date Property Sales December Property sales were 8, up 166.7% from 3 in December of 2010 and 33.3% higher than the 6 sales last month. December 2011 sales were at a mid level compared to December of 2010 and 2009. December YTD sales of 76 are running -9.5% behind last year's year-to-date sales of 84. Prices The Median Sales Price in December was $81,179, up 16.0% from $70,000 in December of 2010 and up 54.6% from $52,500 last month. The Average Sales Price in December was $72,045, down -1.0% from $72,800 in December of 2010 and up 20.6% from $59,750 last month. December 2011 ASP was at the lowest level compared to December of 2010 and 2009. Based on information from TREND MLS for the period 1/1/2009 through 12/31/2011. Due to MLS reporting methods and allowable reporting policy, this data is only informational and may not be completely accurate. Therefore, Coldwell Banker Residential Brokerage does not guarantee the data accuracy. Data maintained by the MLS's may not reflect all real estate activity in the market.
- 2. MARKET ACTION REPORT December 2011 Margarita Swartz Sales Associate Zip Code: 19141 (215) 641-2727 mswartz@cbpref.com http://www.cbpref.com/mswartz Price Range: | Properties: Single Family Home, Townhome Inventory & MSI The Total Inventory of Properties available for sale as of December was 71, down -6.6% from 76 last month and up 4.4% from 68 in December of last year. December 2011 Inventory was at highest level compared to December of 2010 and 2009. A comparatively lower MSI is more beneficial for sellers while a higher MSI is better for buyers. The December 2011 MSI of 8.9 months was at a mid range compared with December of 2010 and 2009. Market Time The average Days On Market(DOM) shows how many days the average Property is on the Market before it sells. An upward trend in DOM tends to indicate a move towards more of a Buyer's market, a downward trend a move towards more of a Seller's market. The DOM for December was 76, up 2.7% from 74 days last month and down -20.0% from 95 days in December of last year. The December 2011 DOM was at a mid range compared with December of 2010 and 2009. Selling Price per Square Foot The Selling Price per Square Foot is a great indicator for the direction of Property values. Since Median Sales Price and Average Sales price can be impacted by the 'mix' of high or low end Properties in the market, the selling price per square foot is a more normalized indicator on the direction of Property values. The December 2011 Selling Price per Square Foot of $54 was up 28.6% from $42 last month and up 14.9% from $47 in December of last year. Based on information from TREND MLS for the period 1/1/2009 through 12/31/2011. Due to MLS reporting methods and allowable reporting policy, this data is only informational and may not be completely accurate. Therefore, Coldwell Banker Residential Brokerage does not guarantee the data accuracy. Data maintained by the MLS's may not reflect all real estate activity in the market.
- 3. MARKET ACTION REPORT December 2011 Margarita Swartz Sales Associate Zip Code: 19141 (215) 641-2727 mswartz@cbpref.com http://www.cbpref.com/mswartz Price Range: | Properties: Single Family Home, Townhome Selling Price vs Original Listing Price The Selling Price vs Original Listing Price reveals the average amount that Sellers are agreeing to come down from their original list price. The lower the ratio is below 100% the more of a Buyer's market exists, a ratio at or above 100% indicates more of a Seller's market. The December 2011 Selling Price vs Original List Price of 89.3% was up from 82.1% last month and down from 99.6% in December of last year. Inventory / New Listings / Sales 'This last view of the market combines monthly inventory of Properties for sale along with New Listings and Sales. The graph shows the basic annual seasonality of the market as well as the relationship between these items. The number of New Listings in December 2011 was 13, down -23.5% from 17 last month and down -23.5% from 17 in December of last year. Based on information from TREND MLS for the period 1/1/2009 through 12/31/2011. Due to MLS reporting methods and allowable reporting policy, this data is only informational and may not be completely accurate. Therefore, Coldwell Banker Residential Brokerage does not guarantee the data accuracy. Data maintained by the MLS's may not reflect all real estate activity in the market.
- 4. MARKET ACTION REPORT December 2011 Margarita Swartz Sales Associate Zip Code: 19141 (215) 641-2727 mswartz@cbpref.com http://www.cbpref.com/mswartz Price Range: | Properties: Single Family Home, Townhome J 09 F M A M J J A S O N D J 10 F M A M J J A S O N D J 11 F M A M J J A S O N D Homes Sold 8 8 6 11 2 8 13 16 7 16 7 8 8 5 10 14 8 5 6 8 8 5 4 3 3 4 5 10 5 7 8 9 4 7 6 8 3 Mo. Roll Avg 7 8 6 7 8 12 12 13 10 10 8 7 8 10 11 9 6 6 7 7 6 4 3 3 4 6 7 7 7 8 7 7 6 7 (000's) J 09 F M A M J J A S O N D J 10 F M A M J J A S O N D J 11 F M A M J J A S O N D MedianSalePrice 41 90 62 81 42 81 65 66 63 72 53 86 60 40 89 76 90 90 41 65 89 90 90 70 47 36 45 48 37 78 36 55 34 55 53 81 3 Mo. Roll Avg 64 78 62 68 63 70 65 67 63 70 66 62 63 68 85 85 74 65 65 81 90 83 69 51 43 43 43 54 50 56 41 48 47 63 J 09 F M A M J J A S O N D J 10 F M A M J J A S O N D J 11 F M A M J J A S O N D Inventory 81 84 69 70 77 76 67 64 64 67 73 62 63 70 70 64 63 67 68 71 64 68 72 68 63 54 62 61 62 63 61 64 73 73 76 71 MSI 10 11 12 6 39 10 5 4 9 4 10 8 8 14 7 5 8 13 11 9 8 14 18 23 21 14 12 6 12 9 8 7 18 10 13 9 J 09 F M A M J J A S O N D J 10 F M A M J J A S O N D J 11 F M A M J J A S O N D Days On Market 38 142 64 66 37 62 89 76 99 44 97 16 29 17 21 75 100 42 106 90 62 126 32 95 20 110 126 46 50 80 44 64 60 45 74 76 3 Mo. Roll Avg 81 91 56 55 63 76 88 73 80 52 47 21 22 38 65 72 83 79 86 93 73 84 49 75 85 94 74 59 58 63 56 56 60 65 J 09 F M A M J J A S O N D J 10 F M A M J J A S O N D J 11 F M A M J J A S O N D Price per Sq Ft 40 61 56 59 29 62 51 52 53 60 51 59 45 40 59 56 60 57 32 52 60 52 63 47 28 39 38 43 36 46 34 47 43 46 42 54 3 Mo. Roll Avg 52 59 48 50 47 55 52 55 55 57 52 48 48 52 58 58 50 47 48 55 58 54 46 38 35 40 39 42 39 42 41 45 44 47 J 09 F M A M J J A S O N D J 10 F M A M J J A S O N D J 11 F M A M J J A S O N D Sale to List Price 0.892 0.971 0.923 0.917 0.852 0.961 0.974 0.925 0.895 0.967 0.926 0.972 0.983 0.933 0.951 0.962 0.975 0.965 0.865 0.941 0.920 1.002 0.928 0.996 0.952 0.878 0.840 0.949 0.915 0.967 0.905 0.886 0.976 0.919 0.821 0.893 3 Mo. Roll Avg 0.929 0.937 0.897 0.910 0.929 0.953 0.931 0.929 0.929 0.955 0.960 0.963 0.956 0.949 0.963 0.967 0.935 0.924 0.909 0.954 0.950 0.975 0.959 0.942 0.890 0.889 0.901 0.944 0.929 0.919 0.922 0.927 0.905 0.878 J 09 F M A M J J A S O N D J 10 F M A M J J A S O N D J 11 F M A M J J A S O N D New Listings 19 16 11 15 24 24 14 17 18 17 17 11 19 16 22 18 12 21 13 17 11 16 14 17 8 11 21 15 15 19 15 21 23 21 17 13 Inventory 81 84 69 70 77 76 67 64 64 67 73 62 63 70 70 64 63 67 68 71 64 68 72 68 63 54 62 61 62 63 61 64 73 73 76 71 Sales 8 8 6 11 2 8 13 16 7 16 7 8 8 5 10 14 8 5 6 8 8 5 4 3 3 4 5 10 5 7 8 9 4 7 6 8 (000's) J 09 F M A M J J A S O N D J 10 F M A M J J A S O N D J 11 F M A M J J A S O N D Avg Sale Price 56 81 65 75 42 87 61 70 72 75 63 77 65 52 80 75 89 75 44 70 80 75 84 73 41 51 57 58 50 64 47 66 45 57 60 72 3 Mo. Roll Avg 67 74 61 68 63 73 67 72 70 72 68 64 65 69 81 80 69 63 65 75 80 77 66 55 50 55 55 57 54 59 53 56 54 63 Based on information from TREND MLS for the period 1/1/2009 through 12/31/2011. Due to MLS reporting methods and allowable reporting policy, this data is only informational and may not be completely accurate. Therefore, Coldwell Banker Residential Brokerage does not guarantee the data accuracy. Data maintained by the MLS's may not reflect all real estate activity in the market.