Contenu connexe
Plus de Marty Daniel with ThunderActive
Plus de Marty Daniel with ThunderActive (9)
SM 187A Managed Care Pull Through Report Summary
- 1. Report Summary: Managed Care Pull-Through Excellence – From Formulary Access to Increased Market Share
Managed Care Pull-Through
Excellence: From Formulary Access
To Increased Market Share
PROJECT BACKGROUND
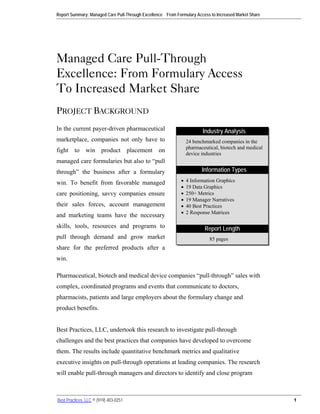
In the current payer-driven pharmaceutical Industry Analysis
marketplace, companies not only have to 24 benchmarked companies in the
pharmaceutical, biotech and medical
fight to win product placement on device industries
managed care formularies but also to “pull
through” the business after a formulary Information Types
win. To benefit from favorable managed • 4 Information Graphics
• 19 Data Graphics
care positioning, savvy companies ensure • 250+ Metrics
• 19 Manager Narratives
their sales forces, account management • 40 Best Practices
• 2 Response Matrices
and marketing teams have the necessary
skills, tools, resources and programs to Report Length
pull through demand and grow market 85 pages
share for the preferred products after a
win.
Pharmaceutical, biotech and medical device companies “pull-through” sales with
complex, coordinated programs and events that communicate to doctors,
pharmacists, patients and large employers about the formulary change and
product benefits.
Best Practices, LLC, undertook this research to investigate pull-through
challenges and the best practices that companies have developed to overcome
them. The results include quantitative benchmark metrics and qualitative
executive insights on pull-through operations at leading companies. The research
will enable pull-through managers and directors to identify and close program
Best Practices, LLC © (919) 403-0251 1
- 2. Report Summary: Managed Care Pull-Through Excellence – From Formulary Access to Increased Market Share
gaps and discover success factors that they can
Study Participants
use to develop program excellence.
• Abbott Laboratories
• Alcon
STUDY METHODOLOGY •
•
Allergan
AstraZeneca
• Bayer
Research involved a survey of 33 pull-through • Boehringer Ingelheim
• Caldera
leaders at 24 companies within the • Daiichi-Sankyo
pharmaceutical, biotechnology and medical • Galderma
device industries. Best Practices analysts also • GlaxoSmithKline
• Johnson & Johnson
conducted a series of in-depth interviews with
• Merck & Co.
selected to uncover insights and identify • Novo Nordisk
successful tactics and practices for achieving • Perkin Elmer
formulary pull-through. The survey was focused • Pfizer
• Sanofi-Aventis
on collecting quantitative data, while interviews • Smith & Nephew
collected qualitative data, process descriptions • Solvay
and executive insights. • Takeda
• Taro
• Tibotec
This research is focused on several major topic • Upsher-Smith
areas including: • Wyeth Pharmaceuticals
• Xanodyne
• Contracting strategies that support pull-
through results
• Collaboration across corporate channels and functions
• Effective internal and external communication processes and tools
• Customer segmentation
• Customer communication topics, channels and timing
• Effective activities and programs
• Key Opinion Leader management
• Use of program evaluation metrics
• Trends in pull-through resource levels
• Key challenges faced in accomplishing managed care pull-through
• Best practices for achieving managed care pull-through results
Best Practices, LLC © (919) 403-0251 2
- 3. Report Summary: Managed Care Pull-Through Excellence – From Formulary Access to Increased Market Share
SAMPLE FINDINGS
Among the findings that emerged from this research are the following:
• Programs: Pull-through programs can be highly effective at driving results.
In rating four types of pull-through programs, 45 percent of benchmark
participants gave the top rating of high impact to general pull-through support
programs (aimed at increasing provider awareness of products), while 24
percent rated therapeutic intervention programs and 23 percent rated
education support programs high impact. In contrast, only 4 percent found
adherence/persistency programs to have a high impact.
• Targeted Audience: Companies most frequently aim their pull-through
efforts at physicians (97 percent) and physicians’ staff (79 percent), but
patients, health plan members, government agencies and large employers are
also common pull-through targets.
• Measurement: Continual measurement of pull-through results helps
companies understand the true cost (ROI) of the market share gained with
their pull-through initiatives. In addition, regular and consistent measurement
and analysis enable pull-through leaders to identify and rapidly change
ineffective activities and strategies and improve results. Yet good
measurement practices are a challenge for most of the participating
companies.
REPORT EXCERPTS
Preferred Channels for Customer Education
Benchmark participants deliver education programs to their customers through an array of
different channels, ranging from websites to direct mail. The rationale for multichannel
communication may be driven in part by the desire to reach (1) different customer segments, as
Best Practices, LLC © (919) 403-0251 3
- 4. Report Summary: Managed Care Pull-Through Excellence – From Formulary Access to Increased Market Share
well as (2) customers with varying channel format preferences. However, another driver may be
that none of the individual channels is viewed as highly effective in getting the pull-through
message out.
Less than a quarter of respondents judge any channel as highly effective, with the exception of
special events (such as screenings or health fairs), which were seen as highly effective by only
33 percent of benchmark participants.
Websites, Special Events Effective for Customer Education
Q. Please rate the effectiveness of the following channels/media for delivering education
programs to customers? (Choose one for each channel/medium.)
Channel Effectiveness Other:
Highly Effective Moderately Effective • Call center
Total support for
Effective patients
Websites 3% 81% 84% • Web training
• Mobile tech
Special events (e.g., screenings, 76%
33% 43% • KOL speakers
health fairs, fitness events
• Roundtables
Patient handouts 13% 50% 63% • Patient letters
• Patient
Instructional videos 21% 41% 62% assistance/
scholarships
55% 58% • Non-branded
E-mail flashes 3% disease
awareness
48% 54% modules
Direct mail 6%
• Detailing.
(n=29-32)
% Respondents
Copyright © Best Practices®, LLC
BEST PRACTICES, ®
LLC
Figure 1: Websites, Special Events Effective for Customer Education
Websites are the channel with the highest overall effectiveness score, with 84 percent finding
them either moderately (81 percent) or highly (3 percent) effective. Instructional video are seen
as highly effective by 21 percent and patient handouts by 13 percent. Although widely used,
direct mail and email flashes received the lowest ratings with around half rating them moderately
effective and few rating them higher.
Best Practices, LLC © (919) 403-0251 4
- 5. Report Summary: Managed Care Pull-Through Excellence – From Formulary Access to Increased Market Share
Other channels the benchmark class uses effectively include roundtables, call center support for
patients, web training, mobile tech, patient letters, patient assistance/scholarships, non-branded
disease awareness modules, detailing and KOL speakers.
Changing Resource Levels for Pull-Through
Pull-through is clearly a high priority in the payer-dominated market today, with many more
companies experiencing increases rather than cuts in resources. Despite the slow economy, 67
percent of participating companies expect to see pull-through resources increase over the next
two years—nearly as many as the 69 percent that saw actual increases in the last two years.
Moreover, nearly one -hird expect increases of 10 percent or more in the near future, compared
with about a quarter that saw increaes that large in the preceding two years.
Majority Expects Recent Resource Increases to Continue
Q. Please estimate the level of change in resources (budget and staff) for pull-through activities and
programs you have seen over the past two years. Also estimate the level of change in pull-through
resources you anticipate for the next two years. (Choose one for each time period.)
Pull-Through Resource Levels
Actual Change Anticipated Change
Previous 2 Years Next 2 Years
19% 17%
Decrease >10%
0%
0%
10% Decrease 1-10% 17%
No Change
45% 37%
Increase 1-10%
69% 67%
Increase >10%
24% 30%
(n=29) (n=30)
% Respondents % Respondents
Copyright © Best Practices®, LLC
BEST PRACTICES, ®
LLC
Figure 2: Majority Expects Recent Resource Increases to Continue
Best Practices, LLC © (919) 403-0251 5
- 6. Report Summary: Managed Care Pull-Through Excellence – From Formulary Access to Increased Market Share
A minority of benchmark partners—17 percent—anticipate any form of budget or staff cuts
whatsoever for pull-through on the horizon. All of those partners expect cuts of at least 10
percent from the current levels. Those who are experiencing decreasing resources made a
number of comments about facing subsequent budget and personnel reductions. Among those
are the following:
• “Budget constraints are slowing down our efforts to develop new media to reach
physicians.”
• “Cuts have hurt our ability to do lunches and educational events.”
• “Our competitors have a better ratio of reps to customers. We are spread very thin.”
Over the past two years, 19 percent of survey respondents saw a decline in resources averaging
above 10 percent, compared with more than two-thirds whose resources increased.
Approximately 10 percent of the benchmark class experienced no change. Projections for
resource levels expected over the next two years followed a similar pattern.
SAMPLE BEST PRACTICE
6. Coordinate across all the “5 Ps” to engage all external stakeholders and avoid
pull-through disconnects.
One key to successful pull-through is understanding that there are many different healthcare
decision- makers who each play a part in ensuring that a patient can access the appropriate
medicines. If any one of these is unaware of a formulary change, the preferred product may not
get into the patient’s hands as intended by the plan.
“Budget constraints are
slowing down our efforts to
Patients, physicians, pharmacists, payers and plan develop new media to reach
physicians.”
sponsors (including employers, Medicare and --Global Franchise Director
Medicaid) all make healthcare decisions, and pharmas
Best Practices, LLC © (919) 403-0251 6
- 7. Report Summary: Managed Care Pull-Through Excellence – From Formulary Access to Increased Market Share
must reach all these “5 Ps” to
“There are many potential gaps along
prevent gaps in the flow of on- the way and you have to prevent the
formulary medicine to the intended patient from falling through them.”
--Interviewed Account Manager
patient. Savvy companies align the
Ps after a win and keep them informed on a regular basis through using multiple communication
channels – including emerging social and professional networking media.
After a plan has been engaged through contracting, companies must work closely with the plan
to develop a communication strategy that encompasses all decision-making groups. Said an
interviewed Account Manager: “You have to pay attention to every one of these groups and
make sure they know about the updates and understand the formulary and product benefits. A
doctor may prescribe the right product, but the pharmacist may change it. There are many
potential gaps along the way and you have to prevent the patient from falling through them.”
Include All External Stakeholders in Formulary Outreach
Key Healthcare Decision Markers: The 5 Ps
Patients
Patients
Physicians/
Physicians/ Pharmacies
Pharmacies
Prescribers
Prescribers Pull-Through
Pull-Through
Engagement
Engagement
Plan
Plan
Payers
Payers Sponsors
Sponsors
Patients
Physicians/ prescribers
Pharmacies (including mail order)
Plan Sponsors (employers, Medicare, Medicaid)
Payers/Plans
Additional stakeholders include 3rd party administrators, employee benefit consultants, therapeutic area educators,
KOLs and physician office staff.
Copyright © Best Practices®, LLC BEST PRACTICES, ®
LLC
Figure 3: Coordinate 5 Ps to Prevent Gaps between Patient and Product
Best Practices, LLC © (919) 403-0251 7
- 8. Report Summary: Managed Care Pull-Through Excellence – From Formulary Access to Increased Market Share
REPORT STRUCTURE AND ORGANIZATION
The project findings are organized into six sections:
• Executive Summary: The executive summary explains the survey objective
and methodology, identifies participating companies, provides definitions,
and reports key findings and insights.
• Building an Effective Pull-Through Operation: This section discusses
how companies establish structures and processes that optimize pull-
through. Areas covered include pull-through leadership, planning, training,
staff roles, cross-channel and cross-functional collaboration, internal
communications processes and tools, use of templates, effectiveness metrics,
and trends in budget and staffing levels.
• Pull-Through in Action: The section examines programs and activities that
companies use to increase pull-through effectiveness. Contracting strategies,
effective messaging, customer segmentation, effectiveness metrics, KOL
management, and communication topics, channels and timing are among the
topics covered.
• Key Challenges Faced in Accomplishing Pull-Through: Participants share
the current challenges they face in their efforts to increase pull-through.
• Best Practices for Pull-Through Excellence: This section highlights the
best practices for pull-through that were shared by participants in survey
responses.
• Appendix: Includes matrices of full responses to best practices and key
challenges questions. Includes survey instrument.
Best Practices, LLC © (919) 403-0251 8
- 9. Report Summary: Managed Care Pull-Through Excellence – From Formulary Access to Increased Market Share
ABOUT BENCHMARKINGREPORTS.COM
BenchmarkingReports.com is a service of Best Practices, LLC, world leader in
benchmarking research and analysis. BenchmarkingReports.com provides vital
insights and data from our primary research at a fraction of original project cost.
Best Practices, LLC has conducted pioneering benchmarking research for top
companies since 1991, providing clients with "Access and Intelligence for
Achieving World-Class Excellence." To learn how we can help you find
solutions to your current business issues, visit our site at www.best-in-class.com.
Best Practices, LLC © (919) 403-0251 9
- 10. Report Summary: Managed Care Pull-Through Excellence – From Formulary Access to Increased Market Share
TABLE OF CONTENTS
REPORT STRUCTURE AND ORGANIZATION 5
Executive Summary ....................................................................................................... 6
INTRODUCTION 6
RESEARCH FOCUS 6
RESEARCH APPROACH 7
PARTICIPATING COMPANIES 8
KEY INSIGHTS 10
KEY FINDINGS FROM SURVEY 12
DEFINITIONS FOR TERMS USED IN THIS STUDY 16
Building an Effective Pull-Through Operation......................................................... 17
PROGRAMS THAT DRIVE PULL-THROUGH 17
EFFECTIVE TOPICS FOR PULL-THROUGH EDUCATION 23
PREFERRED CHANNELS FOR CUSTOMER EDUCATION 25
KOL INTERACTION IMPACTS PULL-THROUGH EFFECTIVENESS 26
PULL-THROUGH LEADERSHIP 32
CHANGING RESOURCE LEVELS FOR PULL-THROUGH 36
Pull-Through in Action................................................................................................ 39
KEY STEPS TO PULL-THROUGH PROGRAM EXCELLENCE 39
Manage pull-through complexity by working to a detailed process model that
provides a template for rapid, effective response to a formulary win. 41
Use contract requirements to gain timely plan support for pull-through activities and
programs. 43
Foster, recognize and reward cross-company collaboration—especially between Sales
and Marketing. 46
Provide field force training on Managed Care basics, as well as on the specifics of
each pull-through initiative. 49
Improve physician access with messages that highlight both the product’s clinical
benefits and formulary advantages. 52
Coordinate across all the “5 Ps” to engage all external stakeholders and avoid pull-
through disconnects. 54
Maintain frequent cross-company communication to ensure that all internal channels
and functions can collaborate effectively on pull-through. 57
Continually measure and analyze results to understand ROI and to rapidly identify
and adjust ineffective strategies and tactics. 59
Key Challenges in Achieving Pull-Through .............................................................. 63
Best Practices, LLC © (919) 403-0251 10
- 11. Report Summary: Managed Care Pull-Through Excellence – From Formulary Access to Increased Market Share
LIST OF FIGURES
Figure 1: Participating Companies .............................................................................................................. 7
Figure 2: Participant’s Job Titles................................................................................................................. 8
Figure 3: Job Level and Function/Department of Participants.................................................................... 9
Figure 4: Therapeutic Areas Represented ................................................................................................... 9
Figure 5: Multiple Programs are Used to Generate Pull-Through ........................................................... 18
Figure 6: Programs Help Companies Capitalize on Formulary Wins ....................................................... 19
Figure 7: Efficacy Benefit Leads Therapeutic Intervention Tactics......................................................... 20
Figure 8: Top Adherence/Persistency Driver is Patient Education ........................................................... 21
Figure 9: Companies Target Multiple Customer Groups Beyond Providers........................................... 22
Figure 10: Clinical Data and Practice Guidelines are Best Provider Topics ............................................. 23
Figure 11: Co-Pay and Adherence are Best Topics for Patient Education ................................................ 24
Figure 12: Preferred Education Topics for Providers and Patients .......................................................... 25
Figure 13: Websites, Special Events Effective for Customer Education .................................................. 26
Figure 14: KOL Interactions Can Have High Pull-Through Impact ........................................................ 27
Figure 15: Educators Play Important Pull-Through Role.......................................................................... 28
Figure 16: Most Used Tools and Templates are for Accounts and Education ......................................... 29
Figure 17: Tools and Templates Boost Pull-Through Effectiveness......................................................... 30
Figure 18: Few Characterize Their Tools and Processes as Excellent ...................................................... 31
Figure 19: Account Managers Most Often Lead Pull-Through Efforts..................................................... 33
Figure 20: Sales and Account Manager Roles are Distinct but Changing................................................. 34
Figure 21: Use District Managers to Maintain Pull-Through Momentum ............................................... 35
Figure 22: Sales is the Primary Home of Pull-Through Employees ......................................................... 36
Figure 23: Majority Expects Recent Resource Increases to Continue....................................................... 37
Figure 24: Critical Practices for Achieving Pull-Through Excellence ...................................................... 39
Figure 25: Eight Steps to Pull-Through Excellence ................................................................................. 40
Figure 26 : Manage Complexity by Working to a Detailed Process Model.............................................. 42
Figure 27: Use Contact Requirements to Gain Timely Support from Plan ............................................... 43
Figure 28: Foster and Develop Cross-Company Collaboration on Pull-Through ..................................... 46
Figure 29: Train Sales on Managed Care Basics and Pull-Through Specifics .......................................... 49
Figure 30: Most View Pull-Through Training as Sufficient ..................................................................... 50
Figure 31: Performance Boosters .............................................................................................................. 51
Figure 32: Improve Physician Access with Clinical + Formulary Message.............................................. 53
Figure 33: Coordinate 5 Ps to Prevent Gaps Between Patient and Product .............................................. 54
Figure 34: Include All External Stakeholders in Formulary Outreach...................................................... 55
Figure 35: Maintain Frequent Communication to Ensure Internal Alignment.......................................... 57
Figure 36: Use Internal Website to Support Pull-Through Teams ............................................................ 58
Figure 37: Continually Measure Results to See ROI and Make Improvements........................................ 60
Figure 38: 96 Percent of Participants Use Market Share to Measure Effectiveness ................................. 61
Figure 39: Market Share is the Most Important Success Indicator ........................................................... 62
Figure 40: Top Pull-Through Challenge is Field Coordination/Training.................................................. 63
Figure 41: Challenges – Field Coordination, Training and Momentum ................................................... 64
Figure 42: Challenges – Limited Physician Access/MD Ambivalence..................................................... 65
Figure 43: Measuring Return on Pull-Through Investment ...................................................................... 66
Figure 44: Challenges-Resource Limits, Plan Support & Compliance ..................................................... 67
Figure 45: Provider Outreach is Top Area for Pull-Through Best Practices............................................. 68
Figure 46: Best Practices - Physician/Provider Focus............................................................................... 69
Figure 47: Best Practices – Messaging, Collateral and Communication................................................... 70
Figure 48: Best Practices - Goals, Measurement & Analysis.................................................................... 71
Figure 49: Best Practices – Internal and External Collaboration .............................................................. 72
Figure 50: Best Practices- Process, People & Programs ........................................................................... 73
Best Practices, LLC © (919) 403-0251 11
- 12. Report Summary: Managed Care Pull-Through Excellence – From Formulary Access to Increased Market Share
ORDER FORM
I’d like to order the following Best Practice Benchmarking Report.®
ID PUBLICATION TITLE QUANTITY PRICE SUBTOTAL
Managed Care Pull-Through
SM-187 Excellence: From Formulary Access to
Ordering
Increased Market Share
3 or more reports Deduct 10 percent
Options
Shipping and Handling: Add $48 per report
ONLINE
TOTAL
benchmarkingreports.com
PHONE
SHIP TO:
(919) 403-0251
Name
FAX
Title
(919) 403-0144
Company
EMAIL
Street Address
bestpractices@best-in-
class.com
City/State/Country Zip
MAIL
Phone Fax
Best Practices, LLC
6350 Quadrangle Drive
Email Suite 200
Chapel Hill, NC 27517
PAYMENT OPTIONS:
Check enclosed payable to “Best Practices, LLC”
Visa MasterCard American Express
Card Number Exp. Date
Authorized Signature
Best Practices, LLC © (919) 403-0251 12