Contenu connexe
Similaire à Lecture 3a edits
Similaire à Lecture 3a edits (20)
Lecture 3a edits
- 1. KATA
© 2016 The Leadership Network®
© 2016 Jidoka®
01
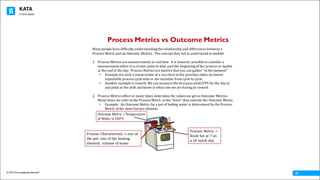
Process Metrics vs Outcome Metrics
Many people have difficulty understanding the relationship and differences between a
Process Metric and an Outcome Metrics. The concept they fail to understand is twofold:
1. Process Metrics are measurements in real time. It is however possible to consider a
measurement either at a certain point in time past the beginning of the process or maybe
at the end of the day. Process Metrics are metrics that you can gather “in the moment”
• Example are such a construction of a run chart in the previous slides on lowest
repeatable process cycle time or the variation from cycle to cycle.
• Another example is rework. We can measure the first pass yield (FPY for the day at
any point in the shift and know at what rate we are having to rework
2. Process Metrics affect or many times determine the values we get as Outcome Metrics.
Many times we refer to the Process Metric as the “lever” that controls the Outcome Metric.
• Example: An Outcome Metric for a pot of boiling water is determined by the Process
Metric of the stove burner element.
Outcome Metric = Temperature
of Water is 100oC
Process Metric =
Knob Set at 7 on
a 10 notch dial
Process Characteristic = size of
the pot; size of the heating
element; volume of water
- 2. KATA
© 2016 The Leadership Network®
© 2016 Jidoka®
02
Process Characteristic =
Cold vs Hot
- 3. KATA
© 2016 The Leadership Network®
© 2016 Jidoka®
03
Current Condition Side of the Storyboard –
Healthcare, Emergency Dept.
Achieve by: 3 July
Process Characteristics
• Capacity of 215 patients in 24 hours; 40% of total volume is 1500-2300
• 45 beds, Medical screening and Trauma
• No. of Nurses = 44 total; 16 on 0700-1500, 10 on 1500-2300, 18 on 2300-0700
• Two 15 min breaks, One 30 min lunch
Process Metrics
• Labs Turn around time (TAT):
• Blood panels = 45 min; Urinalysis = 35 min; Radiology = 60 min
Outcome Metrics
• Patient Length of Stay (LOS) to d/c = 260 min
• Patient Length of Stay (LOS) to admit = 310 min
EMS arrives
with
patient
Trauma or
Medical
Screening?
Medical
Screening
Exam -
Physician
Labs order
by
Physician
Physician
Diagnosis &
Treatment
by Nurse
Discharged
or admitted
- 4. KATA
© 2016 The Leadership Network®
© 2016 Jidoka®
04
Target Condition Side of the Storyboard –
Healthcare, Emergency Dept.
Achieve by: 3 July
Process Characteristics
• Capacity of 215 patients in 24 hours, 40% of total volume is 1500-2300
• 45 beds, Medical screening and Trauma
• No. of Nurses = 44 total 10 on 0700-1500, 20 on 1500-2300, 14 on 2300-0700
• Two 15 min breaks, One 30 min lunch
Process Metrics
• Labs Turn around time (TAT):
• Blood panels = 30 min; Urinalysis = 25 min; Radiology = 20 min
Outcome Metrics
• Patient Length of Stay (LOS) to d/c < 220 min
• Patient Length of Stay (LOS) to admit < 260 min
EMS arrives
with
patient
Trauma or
Medical
Screening?
Medical
Screening
Exam -
Physician
Labs order
by
Physician
Physician
Diagnosis &
Treatment
by Nurse
Discharged
or admitted
- 5. KATA
© 2016 The Leadership Network®
© 2016 Jidoka®
05
Target Condition
Achieve by: 06.10.2016
Current Condition
Process Metrics Process Metrics
Outcome Metrics Outcome Metrics
F/A - Pack
Mill 8
Mill 7
Mill 6
Mill 5
Mill 4
Mill 3
Mill 2
Mill 1
CNC 2
CNC 1
Shaper 6
Shaper 5
Shaper 4
Shaper 3
Shaper 2
Shaper 1
Hob 18
Hob 17
Hob 16
Hob 15
Hob 14
Hob 13
Hob 12
Hob 11
Hob 10
Hob 9
Hob 8
Hob 7
Hob 6
Hob 5
Hob 4
Hob 3
Hob 2
Hob 1
Hob 0
Hob 1
50
48
46
44
42
40
38
36
34
32
30
28
26
24
22
20
18
16
14
12
10
8
6
4
2
0
OTHER PROCESS METRICS:
Mill Reliability is 80%
Overtime is due to machine reliability at Turning Mills 1,7, & 8
NOTES AND OBSERVATIONS
PROCESS CHARACTERISTICS:
We have excess capacity and high variation in machine cycle
with our Hob Machines. Hob 18 cycle time exceeds Takt Time
We have excess capacity and high variation in machine cycle
with our Turning Mill Machines.
PPLH = 27.5
Scrap = 6.7%
OverTime = 8%
First Pass Yield = 93%
Exit Cycle Var(Pack) = 10 s +/- 12%
Hob 18 Lowest Repeatable Hi Var = +195%
Lo Var = - 24%= 14 seconds
Takt Time = 12.3 seconds
Planned Cycle Time= 10.5 Seconds
Number of Shifts = 3
Number of Operators = 10
CURRENT CONDITION SUMMARY SHEET
Outcome Metrics (See Charts)
Process Stability:
First Pass Yield > 95%
Mill Reliability > 85%
PPLH > 37.5
Scrap < 5%
Overtime < 10%
Focus Process: Challenge:It would be Colossal, if by 1.1.2017, the ACME machining cell occupied 50% less
floor space, operating 2 shifts with 50% of the machinery, so we can achieve:
50 PPLH, <3.5% Scrap, with No OvertimeACME Machining Cell
Obstacle
1
2
3
4
5
Workload on operators
Scrap
OBSTACLES PARKING LOT
How will you measure that?
Less number of Hobs
Less number of Turning Mills
The Learner should point and
touch the storyboard and
read from it. It is like his/her
handhold on the bus