1. 1
Krause Fund Research
Spring 2016
Tech (Beta)
Recommendation: HOLD
Analysts
Trevor Heimke
Trevor-heimke@uiowa.edu
Max Neumann
Maxwell-neumann@uiowa.edu
Ryan Crockett
Ryan-crockett@uiowa.edu
Nick Payne
Nick-payne@uiowa.edu
Company Overview
Salesforce.com Inc., (NYSE:CRM) is a provider of enterprise
cloud computing solutions that includes apps and platform
services, as well as professional services. They service businesses
of all sizes and process billions of transactions daily in real time.
Marc Benioff and Parker Harris founded Salesforce 17 years ago.
Benioff remains the Chairman and CEO while Harris is the
Executive VP of Technology. The business is headquartered in San
Francisco, California, U.S. and currently has over 16,000
employees. In the past 5 years their stock price has risen from
around $30 to the current $75. Their revenue has increased year
after year, and they currently are the third largest market share of
their industry in 2007, to now the leading market share in their
industry. Salesforce offers six core products that include sales,
customer service, marketing, community management, analytics,
and a cloud for app development. Salesforce aims to gain even
more market share going forward due to the increasing importance
of CRM while remaining the most innovative software company in
the world.
Stock Performance Highlights
52 week High $82.90
52 week Low $52.60
Beta Value 1.42
Average Daily Volume 4.55 m
Share Highlights
Market Capitalization $52.11 b
Shares Outstanding 670.93 m
Book Value per share $75.73
EPS (2015) $-0.42
P/S Ratio 6.8
Gross Profit Margin 76.01%
Company Performance Highlights
ROA 2%
ROE -7%
Sales $5373586
Financial Ratios
Current Ratio 0.81
Debt to Equity 1.69
Salesforce.com Inc. (NYSE: CRM)
April 18th
, 2016
Current Price $75.73
Target Price $79.78
Salesforce Exhibits Continued Growth
Salesforce will continue its fast growth and remain the
industry pioneer in cloud computing solutions for year’s to
come.
Cash is expected to grow by over 55% in the next 3 years,
as well as net income becoming positive and growing by over
5% in 3 years time.
Earnings per share are expected to turn positive and rise by
over 100% in 2 years and remain positive from there on after.
Sales are expected to grow by over 19% in the next year as
Salesforce continues its expansion and increased market share,
which is well above its competitors and the S&P 500 average.
An increased amount of companies are using data analytics
and cloud computing, which gives more growth potential to
Salesforce in a fast growing industry that is flush with new
customers.
There are expectations of 34% rise in earnings for 2016,
which is nearly seven times higher than the expected earnings
for the S&P 500.
Our target price of nearly $83 exceeds their current stock
price and the average target price of numerous other analysts is
around $90
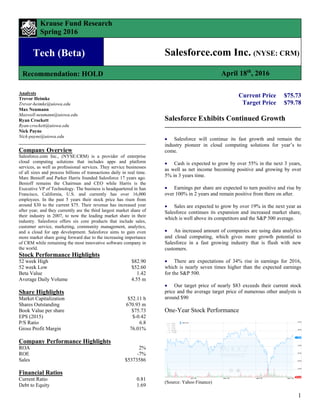
One-Year Stock Performance
(Source: Yahoo Finance)
2. 2
Economic Outlook
Real Gross Domestic Product
Real Gross Domestic Product for the United States
experienced an increase at an annualized rate of 2.4
percent in 2015 after the third revised estimate. After
these revisions, we have increased at the same rate as
2014.1
This increase signals a healthy economy, but
plateauing from the previous year hints at near future
uncertainty and should be handled with caution.
Salesforce is growing at an extremely fast rate. As a
top company in its industry, GDP growth is a fair
indicator of the direction Salesforce’s growth will
trend. Corporate profits decreased by 159.6 billion in
Q4 of 2015, compared to a 33 billion decrease in Q3
of the same year.2
The Personal Consumption Expenditures index
slowed down to a 1.1 Q4 increase in comparison to an
increase of 2.2 percent in the previous quarter.3
The
deceleration in PCE is likely heavily contributed to
the slowdown of GDP growth. PCE is necessary to
monitor for the rough estimates of disposable income
of consumers. According to the Federal Reserve, PCE
inflation is expected to rise significantly in 2016. This
is most likely attributable to the plans to gradually
increase interest rates and the proposed inflation
target of 2%. 4
Another factor that could drastically affect the Real
GDP is the impact of the presidential candidacy. The
Treasury Department in April of 2016 implemented
tighter restrictions on corporate taxation rules. Details
in this imposed change mean tax inversions have less
benefits towards earnings stripping and make
accessing foreign profits more difficult.5
New
regulations are expected to lower corporate profits for
international conglomerates, negatively effecting
GDP.
The capital markets started the year off with
substantial volatility. Significant positive correlations
with oil prices in combination with the poor economic
strategizing announcement from the Federal Reserve
are likely reasons for this. Near the end of Q1, the
markets have gained momentum and oil stagnation
has smoothed. We anticipate at least one rate increase
this year, rising to .75% and a supporting short term
GDP growth of 2.2% in 2016. In the longer horizon,
we expect the U.S. to increase GDP growth to an
annualized rate of 2.6%, contingent on the implied
independence between capital markets and oil prices.
Consumer Confidence & Sentiment Index
Consumer confidence is a survey put out by the
Conference Board that measures the attitudes
consumers have towards the economy. Surveyors
answer questions about their current and potential
future income, employment, and business conditions
as a whole. Consumer sentiment is a survey
conducted by The University of Michigan. This
survey is very similar to the confidence survey, where
both numbers are generally very similar to the other.
This survey has questions geared toward the attitudes
of the individuals towards the economy, and the
strength of consumer spending. For Q1 in 2016, U of
Michigan’s Consumer Sentiment stayed between the
91 – 95 range, slowly declining. April CSI came in at
89.7, which is lower than the expected 91, but is still
a healthy number considering the recent political and
macroeconomic growth conditions. 6
We want to keep
a close watch on consumer confidence numbers to
know what we can expect in revenues from Google
Network Members. As confidence remains higher,
inclinations to spend more money leads to higher
online traffic, and a greater likeliness businesses will
continue utilizing their web services. Minor
fluctuations in Consumer Confidence could have a
3. 3
small effect on Salesforce, however it would be
nothing significant. If consumers began to feel less
confident, some may stop utilizing the service, but we
feel that the customers’ information already stored on
the cloud based service would be too important to
give up.
Reports of a slowing in wage gains, inflationary
adjusted income weakening, and political
uncertainties as it pertains to the economy are
contributing to the lower CSI readings. Previous
consumer survey data remained extremely high
despite more uncertain economic conditions, making
this sub-90 rating partially admissible. Non-
recessionary years average at a rating of 87.6, while
the five recession periods averaged to 69.3; This
signaling that we still have far to fall before
adjusting.7
We believe that Consumer Confidence will
decrease and hang slightly around 94 in the short term
while Consumer Sentiment will hit 87.5. These
numbers centered on the slight increases in employee
compensations, the deteriorating income expectations
and the assumption that oil will rebalance and rise in
the capital markets. In the long term we anticipate the
CCI to increase and stay around 97 and CSI to move
back to
93.
Employment
Employment in the U.S. has continued to rise,
showing the demand for a larger labor force while
further ascertaining the strength of the job market as a
whole. This hiring of employees can signal an
expansive economy, as companies can afford to hire
more workers. Hourly earnings have risen 2.3 percent
through 2015, and non-farm payrolls have increased
215,000 – which was 5,000 higher than the
consensus.8
Salesforce, in order to hold market share, must hire
the best talent available to the industry. Engineers and
software developers will become ever more sought
after as this field continues to expand and new
entrants enter the industry. This will drive more
people into careers like these and potentially lead to
more people looking for work. Wage growth in the
United States has increased at a steady rate, and could
pose a potential problem for companies that are
expecting to be able to pay huge premiums for
talented labor. Having an already high salary
percentage with the expectations of growth may not
bode well.
In 2015 employment rose from the previous year as a
whole, leaving less people without a job. This shows
that companies are feeling confident in their
operations and futures, as they are making the
investment to hire new employees. We feel this is one
signal of a strong economy.
The employment cost index (ECI) rose in the fourth
quarter of 2015 by .6%. The ECI is a measure of
employee wage growth in the United States. This
measure is important to monitor because it is useful to
interpret cost pressures that can have an impact on the
inflation rate in the United States.9
The unemployment rate has held steady for year-end
2015, through March 2016 at 5%.10
4. 4
The graph below shows that unemployment has
continued to fall quarter after quarter for the last 2
years rather steadily. This could be because
individuals are now more optimistic about finding a
job, which can lead to a better performing economy,
or because companies are looking to expand their
operations and need new talent.
Bureau of Labor Statistics U.S. Department of Labor10
We feel that the economy is continuing to expand,
which leads to an increase in employment. In the
short-term (6 month outlook), we see the
unemployment rate staying at 5%. In the long-term
(2-3 year outlook), we see the unemployment rate
dropping below 5%, to around 4.7%.
Our belief in this comes from the consumer
confidence, which is at a high level right now,
showing consumers are feeling positive about their
financial future. For the software sector, we can
expect to see an increase in the amount of skilled
labor workers getting jobs. The software field is one
of ever changing developments and increased
innovation, which will be spurred on by the hiring of
new employees.
The software industry is comprised of only a few
companies that hold over 50% of the market share.
That being said, competition in this field is very high
among the top firms, as they don’t want to lose
potential ideas (workers) to their rivals. One of the
best ways for companies to stay innovative is to hire
new people who will in turn bring with them new
ideas.
Exchange Rates
The exchange rate is the price of a nation's currency
in terms of another currency.11
For simplicity; we will
be analyzing current exchange rates using the US
dollar, as a base currency.
Analyzing current exchange rates plays an important
role in the technology sector mainly due to the large
amount of sales from foreign markets. There has been
a notable correlation between the strength of the US
dollar and US technology performance. The graph
below shows that when the US is dollar is weak,
technology performance tends to excel due to foreign
buyers having more confidence in the US market.12
Fisher Investments on Technology pg. 56-57
Conversely, there are also benefits for US industries
when the US dollar is strong. Products imported from
foreign markets will be cheaper to US corporations
resulting in lower costs. Companies who have more
imports than exports in times of a strong US dollar
will benefit more than those who don't.13
5. 5
Shown above is a 10-year graph of the Trade
Weighted US Dollar index. This value is measured
by giving importance to currencies mainly used in
international trade.14
Due to recent decline of production recorded by the
Purchasing Managers Index (PMI) manufacturing
report, we estimate the Trade Weighted US dollar
Index to increase to 130 in the next 6 months.
However, we predict the Trade Weighted US dollar
Index to fall between 100-105 in the next 2-3 years.
We believe the main reason for this long-term Trade
Weighted US Dollar Index decline is the US export
estimates to increase over the next two years.21
Salesforce is continuing their efforts at entering into
emerging markets across seas. We feel a slight
decline in the value of the US dollar will help make
their products and services more affordable.
Capital Markets Outlook
The technology industry as a whole has performed
very well over 2015 (3.39% return from S&P 500
Information Technology Sector), and we see this
continuing on into the future. With the increase in
online traffic, companies that provide online services
are benefitting from more advertising to a broader
range of consumers, enhanced developments in the
specific technology hardware, and the increases in
online sales.22
We feel this is a good time to invest in the Internet
software and services sector of the tech industry. The
field is continuing to spend on innovation and
research to enhance the already expanding software
systems. The sector as a whole has an average
revenue growth rate over the last 5 years as 12.9%.15
A company similar to Salesforce that has been
thriving as of late is Oracle. Oracle has been in the
market for a longer time than Salesforce, which has
given it a three times larger market cap over
Salesforce. However, Salesforce’s growth rates in
revenues have been much higher on an average rate of
the last 5 years than have Oracles, which
demonstrates the continuing expansion of companies
in this field.
Analysis
Salesforce operates within the Internet software &
services industry inside of the technology sector. This
segment of the technology sector is responsible for
creating software & platforms that improve
company’s connections with clients and also improve
analysis of their data. Revenues for this industry are
generated through customers purchasing the right to
use the software, service packages, and software
subscriptions.
The industry is expected to continue strong growth
through 2021. High corporate profit, low interest
rates, and an increasing number of companies
preferring that their CRM services be accessible from
the Internet drive this growth. Industry competitors
will continue to improve their services to meet
customer needs and invest in even more cloud space
to ease the increasing population of clients. For the
next 5 years, industry revenue is forecast to grow at
an annualized rate of 11.1% to around $25.5 billion.
xvi.
Industry Trends
As a whole, the industry has focused on improving
cloud computing in an effort to provide their
customers with a more accessible product/service.
This is evident in the transition from SaaP systems to
SaaS systems. SaaP systems required clients to store
data, servers, and applications within their own
business and could only be accessed at the certain
location because it’s a purchasable product. SaaS
systems now allow clients to access their information
from nearly any Internet accessible device. This is
made possible by cloud computing that stores
customer information and data without linking it with
specific location or hardware. SaaS have a lower up
front cost and can be put into use at a quicker start up
6. 6
rate because of no longer needing expensive servers
and hardware to store the data.16
Competition
The industry has a medium concentration rate with
over 50% of the revenue being controlled by four
firms.
(Source: Yahoo Finance)
This can make it difficult for new entrants into the
industry as their main competitors are already proven
CRM pioneers.
Porters Five Forces
Industry Competition:
Threat of New Entrants: Barriers to enter this industry
are moderate. New entrants usually develop through
small businesses or more powerful software. Entrants
are deterred due to high startup costs and the
widespread usage of existing services by prospective
customers. The elite firms won’t lose its largest
contracts to smaller startups, so new entrants must
have superior software to grow market share.
Threat of Substitutes: Substitution is a moderate
industry threat. Currently, switching CRM providers
may be costly due to initial hardware and the
subsequent large support systems. However, with the
emergence of cloud computing and SaaS systems, this
switch cost will decrease and become less of a
deterrent in the coming years.
Buying Power: The customers buying power is high
in this industry. An increasing amount of customers
are looking to solve their always changing needs.
Companies must be flexible in order to meet customer
needs. Customers are also now demanding payment
plans that better suit them. They are no longer locked
into long-term contracts with their software provider,
as these companies now offer monthly payment plans.
Paired with no longer needed physical hardware,
customers control the ability to quickly switch
providers.
Supplier Power: Supplier power in this industry is
different from others because they require no raw
materials, but rather human capital and intellect. This
industry relies heavily upon the growth of research &
development, and the hiring of skilled employees is
paramount to retaining market share.17
Catalysts for Growth/Change
Increased Accessibility: With more Internet users and
an increasing amount of mobile usage, these services
are becoming more accessible to customers than ever
before. The accessibility is being driven by cloud
based computing that doesn’t limit customers to a
location or specific hardware. The consistent growth
in mobile phone users has lead to an increase in
demand for services CRM companies provide to be
accessible on cellular phones.
(Source: Yahoo Finance)
The amount of cellphones being used per year
continues to increase, specifically by an average of
5.35% over the last 3 years. People are becoming
more and more dependent on their phones, and utilize
them as not only a phone, but also a source to access
the Internet. Salesforce is capturing this increased
accessibility by offering an “App” marketplace,
where the customer can download specific CRM
7. 7
applications to their phone for use.
Customer Awareness: Customers take a larger interest
in how the product fits them and how the company
treats them. This fits into the software industry
producing specialized and customized products for
their customers in order to serve their special needs.
A recent study shows that 82% of customers will
leave a company if they feel they are not being cared
about. CRM software allows client corporations to be
more connected to their customers by supplying firms
with personalized data about their customers. This
could help eliminated or at least diminish the chances
of the customer feeling uncared about and keep them
happy. www.superoffice.com/blog/crm-charts
Investment Positive/Negative
Positive: The software industry, specifically the CRM
segment, has experienced significant growth. The
software industry has year to date returns of 4.1%,
with the S&P returning 1.35%.18
This is due in large
part to companies having easier access to the products
the firms in this industry supply.
Negative: Software companies, especially those
dealing with CRM, have to be extremely cautious of
their customer’s security. A possible breach into
customer data/information would be detrimental to
the industry’s credibility. In 2016 alone, 27% of
banks and financial institutions along with 26% of
online businesses use some form of CRM software.15
These banks and online retailers have contracts with
CRM companies that would be terminated if a breach
were to happen, as well as potential lawsuits that
would diminish the reputation and value of the
industry.
Company Analysis
Company Overview
Salesforce.com Inc., (NYSE:CRM) is a provider of
enterprise cloud computing solutions that includes
apps and platform services, as well as professional
services. They serve businesses of all sizes and
process billions of transactions daily in real time.
Salesforce was founded 17 years ago, and had its IPO
in 2006.In the past 5 years, the stock price for
Salesforce has risen from around $30 to the current
75$.
(Source: Yahoo Finance)
Salesforces revenues have increased year over year
for the past 4 years, by an average of 23%.
(Salesforce 10K). Salesforce offers six core products
that include sales, customer service, marketing,
community management, analytics and a cloud for
app development. Salesforce aims to gain even more
market share going forward due to the increasing
importance of CRM through its current revenue
streams, as well as branching out into new emerging
markets.
General Info
Salesforce is the leading customer relationship
management service available in the market.
Salesforce provides their customers with services and
products that Customers pay for a membership to the
service, and in return Salesforce provides them with
different applications and professional services that
supply the customer with an array of statistics,
analytics, and data. The objective of this service is to
provide the customer with in-depth, personalized
information and data to better connect with their end
customer. This objective is achieved through multiple
product lines, membership retention, detailed
applications, and professional support for customersi
8. 8
Products and Markets/Revenue Generation:
Salesforce is a provider of enterprise cloud computing
solutions that include apps and platform services, as
well as professional services. They are a company
that focuses on customer relationship management.
Salesforce offers six core cloud services that include
sales force automation, customer service and support,
marketing automation, community management,
analytics, and a cloud platform for building custom
applications. Salesforce also offers consulting,
deployment, training, implementation, and integration
services to its customers to facilitate the adoption of
its cloud solutions. It derives its solutions as a service
through all the Internet browsers and on mobile
devices, on a subscription basis, primarily through its
direct sales efforts and indirectly through partners.
Salesforce derives their revenue from two sources:
93% comes from subscription revenues and their
basic supportii
; and the second source is from related
professional service such as process mapping, project
management, implementation services and other
revenueiii
.
(Source: Salesforce 10K)
We observed the revenues generated through their
sales efforts by geography. Historically, the Americas
have been the most success at generating revenues
year over year at a high growth rate of close to 25%.
Europe and Asia Pacific lag behind the Americas, but
is becoming a more prominent portion of the revenues
generated. The Americas make up approximately
72% of the total revenues generated, which has been
the focus for much of their marketing strategy.8
Analysis of recent filings
Salesforce for the last three years has posted net
losses, however this number has decreased when
compared to total revenues recognized for the year.
The net losses as a percentage of total revenue have
decreased from 9% in 2013 to 5% 2015. The revenues
have continued to grow, specifically by 24.24% from
2014 to 2015, but they are matched by the marketing
and sales growth, which was 24.36% from 2014 to
2015iv
. Salesforce's largest cost comes from
marketing and sales, because of the attempt to expand
their customer base. Salesforce is put up large costs in
its previous years to try and set themselves up for
massive growth. Their R&D cost growth in 2010-
2012 were around 30% year over year. After which
Salesforce focused more on marketing expense, and
that became the leader in cost growth. The increased
spending on marketing and sales, and the increased
growth in revenue illustrates the overall growth of the
company. This growth can be expected to continue as
Salesforce has commented that they believe their
marketing cost will continue to be their largest.
Competition
The software industry is one that is extremely
competitive and evolving each day. Many firms in
this industry charge high prices for their base
services, and that can be a deterrent for customers to
switch to a new companyv
. This would lead to much
higher customer retention than in other fields, leading
to more focus on first time customers. With
increasing reliance on cloud-based software,
competition is expected to rise in the future. This will
force Salesforce to continue to spend on the
marketing of their services and products, as well as
spend more in research and development to stay
ahead of potentially new technologies. In this
industry, companies may believe they can come up
with a software like Salesforce's on their own for
cheaper. This added competition can help be
eliminated by continuing to spend on marketing and
sales, along with research and development.
9. 9
Catalysts For Growth/Change
In the United States, roughly 543,000 new businesses
are started each month. These businesses are
opportunities for Salesforce to implement their
services into these companiesvi
. The monthly
subscription to their services most commonly applied
are in the 12-36 month range. Of the companies that
acquire their services, between 9-10% did not renew
their services. This is slightly above the industry
average of about 80%vii
. Focusing on a solid retention
rate will help Salesforce grow even further. This
shows the importance of acquiring contracts with new
businesses because they will likely continue to use
their services and continue to grow their client base.
The economy and businesses as a whole are
becoming more reliant upon data analytics and
becoming more efficient. According to a study
conducted by BSA/The Software Alliance, 69% of
American senior executives said data analytics is
important to their companies. Furthermore, 79% of
American senior executives said data analytics helps
companies better meet their customers' needsviii
.
Salesforce's largest expenditure is from marketing and
sales, and will continue to be into the foreseeable
futureix
. This is connected to the ideology that
businesses are continuing to increase their focus on
data analytics.
Key Investments (SWOT Analysis)
Salesforce's current business model and software
already give them an advantage over their
competition. They're currently ranked number 1 in the
computer software industry by Fortune magazine, and
have been number 1 for a few years in a row. They
are the clear market leader and have increased their
market share over the competitionx
.
xi
Despite being the industry leader, Salesforce still has
some weaknesses to overcome. In the current market,
Salesforce's largest revenue stream is from their Sales
Cloud. However, when compared to their
competitors’ sales software, Salesforce's is
considerably more expensive per month per user. This
can have a negative effect on consumers because they
may be hesitant to invest in Salesforce due to the
higher price. However, this price gap is due to
salesforce offering more customization, professional
support for their products, and a more flexible
payment plan than its competitors. Salesforce wants
to penetrate the new market of emerging businesses,
but may not be as attractive compared to cheaper
options.
Company Cost/Month/User
Salesforce Enterprise $ 125.00
Microsoft Dynamic
CRM
$ 85.00
Infusionsoft Deluxe $ 75.00
Salesforce has many opportunities in the market due
to new acquisitions and partnerships. Below is a table
of Salesforce 5 most recent acquisitions. They’ve had
a total of 37 since 2011.
RECENT ACQUISITIONS
MetaMind April 4th
, 2016
PredictionIO February 19th
, 2016
SteelBrick December 23rd
, 2015
MiniHash December 14th
, 2015
Kerensen Consulting July 31st
, 2015
Salesforce formed a strategic global alliance with
Google by revolutionizing how customers and
businesses utilize the Internet. The two industry
leading platforms came together to announce a new
product: Salesforce Group Edition featuring Google
Adwords that delivers everything an organization
needs to jump start customer growth in a single
servicexii
. Salesforce also acquired InStranet, which
provides knowledge management software for call
centers. Salesforce can then integrate this newly
10. 10
acquired technology with their own software to
expand upon their customer base and target Oracle,
SAP, among other software companies. The growing
demand in the CRM software market provides an
opportunity of growth for Salesforce. As more
businesses emerge or increase in size, customer
relations becomes more and more important. As the
industry leader, these businesses will turn to
Salesforce to fill this new gap and to keep expanding.
The threat of data breaches and hacking has made
business even more difficult for software companies
around the world. Trust and safety are valued by
customers when investing in companies, so possible
data breaches and hacks could prove costly,
especially to software companies that are viewed as
impenetrable. These hacks could cost companies
millions in tech repair, a loss of existing dissatisfied
customers, and a negative association with their brand
that will ultimately leave a lasting effect on stock
prices. While this remains as a threat to the industry
as a whole, Salesforce has taken measures to combat
it, like limit IP ranges for logins, and double login
identificationxiii
.
There is also concern over government Internet and
data regulations pertaining to the cloud. Expansion of
the Internet, the cloud, and data sharing has asked for
increased regulation and attention from the
government. The attraction of the cloud is the promise
of simplification and standardization without physical
or geographic boundaries. However, Russia and many
more countries are in the process of putting in privacy
laws that mandate personal data on citizens to be
stored in databases physically located within the
country. This could be costly for cloud and data
companies that would have to provide increased
security measures and data servers.
Valuation Analysis
Valuation Overview
For our model, we found Salesforce’s intrinsic value
using discounted cash flow (DCF) valuation,
enterprise profit (EP) valuation, dividend discount
model (DDM), and relative PS valuation. We feel that
the intrinsic values generated from the DCF and EP
models better represent the future target price.
Our DCF and EP models yielded an intrinsic adjusted
value of $8 as of April 19th
, 2016. The intrinsic value
calculated is higher than its current stock price of
$77.27.
General Assumptions for Models
Revenue Decomposition: To better understand where
Salesforce revenue is being generated from, we
decomposed the revenue by geographic location.
Salesforce has been breaking into emerging markets,
specifically European markets. Salesforce primarily
derives revenue from two forms: subscription &
support sales, and professional services. Breaking it
down by geographic location would better represent
their efforts to break into emerging markets.
Salesforce customizes application software as specific
to the customers’ need, so decomposing revenue by
product would not be a fair representation of the
revenue.
The strongest revenue stream was the America’s,
which we continued its growth by 30% for the first 3
years, before slowing down to 4.5% in year 2021
(CV). We expect it to take this rate as they continue
to have a retention rate of around 90% since there are
few companies that have the level of service and
support as Salesforce.
Europe has continued to have high revenue growth
year over year, however we expect them to remain
more constant in their growth due to increased efforts
in Asian Pacific areas. The Asian Pacific areas are the
newest segment in revenue generation. With large
growth the last two years, and continued marketing in
the area, we feel starting revenue growth at 20% and
slowly decreasing it to 4.5% in 2021 (CV) reflects the
overall efforts in the emerging markets.
Dividends/Payout Ratio
Salesforce has not paid any dividends since its IPO in
2006. In their past 10K reports, they have emphasized
11. 11
that there will be no changing of this dividend policy
in the foreseeable future.
Since Salesforce does not pay dividends, we took an
industry average of current payout ratios and applied
that average to our forecasted earnings per share
(EPS).
Income Statement Assumptions
Cost of Goods Sold
Cost of Goods Sold is broken down into two
segments: subscription & support, and professional
services. Cost of goods sold for both segments has
remained relatively consistent over the past 5 years, at
17% and 7%, respectively. We continued these rates
to reflect a consistent cost to service Salesforce’s
products and service.
Marketing & Sales
Salesforce’s largest cost, historical, has been their
marketing & sales. Marketing and sales cost
continued to grow 24% year over year, and we
extended that into our forecast. Salesforce
representatives have said that marketing and sales will
continue to be their largest cost as they continue their
expansion efforts. We wanted to hold true to this
large but necessary cost. We kept it as their largest
cost, but decelerated its rate to a more economic
outlook in the CV year. By this year, we believe their
presence in the market will no longer require them to
continue at such a high rate.
Research & Development
Research and Development is a very important cost to
remain competitive force in an industry founded on
innovation. We took a 5-year average growth of R&D
to reflect recent developments for their company. We
used this rate for the near future and then decelerated
it at the CV year as to show Salesforce moving to a
more steady state.
Balance Sheet Assumptions
Cash & Cash Equivalents
Due to being in an industry that prioritizes R&D, it is
conceivable that a company would need a larger
amount of cash on hand. The cash was calculated by a
plug account in order for our assets to equal our
liabilities & stockholder’s equity.
Capitalized Software
Capitalized software is the internally developed or
acquired software that is used for the internal needs of
the business. Salesforce needs to continue its growth
rate of 6% but will decline to a more steady state once
growth decelerate.
Debt
We forecast their long-term debt as a percentage of
the sales due to the continued need to fund their
marketing and R&D costs. We link our short-term
debt to a percentage of long-term debt over the life of
the debt.
Weighted Average Cost of Capital (WACC)
In calculating our cost of equity, we used the capital
asset pricing model (CAPM). Our risk free rate is the
30-year treasury bond of 2.62%. For the equity risk
premium, we used the implied ERP on April 1st
,
2016, for the 12-month adjusted trailing payout. This
was 5.15%. We calculated the beta by averaging the
monthly beta from 2007 to 2016 to give us the beta of
1.42. We chose these parameters for our beta to
account for market fluctuations and how that affects
Salesforce directly.xxi.
Cost of Debt
Salesforce’s current bond market only has a 2-year
maturity date. So to accommodate for such a short
time horizon, we instead found the industry average
for a 30-year bond and applied that into our model.
This gave us a pretax cost of debt of 5.38%.
WACC
Under these assumptions, we derived a WACC of
9.64%. This accurately characterizes Salesforce’s cost
structure.
Discounted Cash Flows and Economic Profit
After running our DCF and EP model, we came to a
stock price of $79.78. We then adjusted the stock
price for the time since 12/31/2015 to arrive at our
adjusted stock price of $82.08. This price yields a
6.22% upside over the current stock price of $77.27.
12. 12
We derived this amount by discounting our free cash
flows back to a present value to arrive at our value of
operations. From there we added back in the short
tem marketable securities and accounted for the debt
obligations, operating leases and stock option plans to
arrive at our value of equity. We feel this model
accurately describes the intrinsic value of the stock
based on our assumptions built around the future
performance of the company.
Dividend Discount Model (DDM)
Salesforce does not pay out dividends to shareholders,
and sees no change in this practice in the foreseeable
future. We felt the best way to forecast around this
was to find the average payout ratio for similar
companies in the industry, and apply that payout ratio
to our forecasted EPS. We used the damodaran
website to locate an industry average payout ratio of
1.29%. This resulted in a lower intrinsic value of
$64.59, a 16.41% decrease in stock price. We do not
expect Salesforce to change their dividend policy, and
thus put less emphasis on the DDM intrinsic value.
Relative Valuation
We decided to use a Price/Sales relative valuation for
our model. It did not make sense to use a
Price/Earnings model as our projected net income for
2015 and 2016 were net loses. This would result in a
negative intrinsic value, which would supply no
insight into a potential price. The P/S model takes the
market capitalization of a firm, and divides that
number by the total number of sales for that year.
After finding companies that were comparable to
Salesforce based on sales and price, we multiplied the
average P/S ratio for 2016 estimates of comparable
companies to Salesforce’s estimated Sales for 2016.
This yielded a relative P/S (EPS16) of $46.22. The
company’s chosen for this model were similar
companies in the industry, such as Oracle, SAP,
NetSuite, and IBM.
Continuing Value
The continuing value is the present value in a future
point of time of all future cashflows where we expect
steady growth. We assumed Salesforce’s CV year
would be in 2021. We believed 2021 was the best
year because it allows time for Salesforce to grow and
finally earn a very high earnings after its recent years
of net loss, but was also a short enough time horizon
where the model would remain realistic and stable.
Forecasting our results past this period would be
impractical and unreasonable in predicting
macroeconomic and industry conditions.
Sensitivity Analysis
A valuable tool in analyzing Discounted Cash Flow
and Economic Profit models is using a sensitivity
analysis on the assumptions made in our calculations.
Continuing Value assumptions have a large weight on
the output of our models and should therefore be
evaluated. To test this sensitivity, we observed how
different inputs for these assumptions affected our
intrinsic price in the DCF and EP models. Below are
explanations of why we chose the certain variables
when performing these sensitivity analyses.
CV Growth of NOPLAT vs. R&D CV Year Growth
In order to find the intrinsic value in the DCF and EP
models, a CV value must be chosen at a steady
growth rate. We assumed this rate would be 4.5% at
CV year 2021. This growth rate is important to
expansion but realistically expanding within our
means. We compared this to R&D CV Year growth
rate because of how important R&D is to Salesforce’s
effort to expand and become a larger company. R&D
is a large cost that can catalyze a company to break
through and expand, or it can diminish the company’s
size due to very little R&D effort. After analyzing this
sensitivity table, it is clear that CV growth of
NOPLAT could widely change intrinsic price due to
small changes and even R&D growth could change
stock price by nearly $4 due to only a small
percentage change.
Marketing & Sales CV Growth vs. SG&A CV Growth
Marketing & sales and SG&A were two of our largest
operating expenses, so analyzing the change in their
growth is important to understanding how the two
affect intrinsic price. Salesforce has maintained their
stance that marketing & sales will remain a large
presence for the coming years as they expand their
company, however we have them decelerating this
rate to 3% in the CV year. Simply by increasing their
marketing & sales by 6%, the intrinsic value can
change by $7. The growth of this operating expense
should be kept in mind when evaluating this company
13. 13
in the future due to such a large impact on its stock
price.
WACC vs. CV Growth of NOPLAT
The weighted average cost of capital (WACC) is very
important to computing our intrinsic value in our
models. It is one of the lead drivers in determining the
CF to discount and its subsequent PV (CF). A simple
1% change in WACC could change the intrinsic value
by as much as $20. This showcases Salesforce
importance on future cash flows and how an increase
or decrease from estimated cash flows could affect
the company’s overall value very quickly.
CV Growth of NOPLAT vs. CV ROIC
CV ROIC is a measure of how well the company
utilizes its capital on hand. Capital on hand is very
important to the expansion and R&D possibilities in
this industry, so ROIC is a good measure of how well
companies are putting that capital to use. Salesforce
intrinsic price could change by over $1 with a 10%
change in ROIC, compared to about $14 change from
1% change in NOPLAT Growth.
15. 15
Important Disclaimer
This report was created by students enrolled in the Security
Analysis (6F:112) class at the University of Iowa. The report
was originally created to offer an internal investment
recommendation for the University of Iowa Krause Fund and
its advisory board. The report also provides potential
employers and other interested parties an example of the
students’ skills, knowledge and abilities. Members of the
Krause Fund are not registered investment advisors, brokers
or officially licensed financial professionals. The investment
advice contained in this report does not represent an offer or
solicitation to buy or sell any of the securities mentioned.
Unless otherwise noted, facts and figures included in this
report are from publicly available sources. This report is not
a complete compilation of data, and its accuracy is not
guaranteed. From time to time, the University of Iowa, its
faculty, staff, students, or the Krause Fund may hold a
financial interest in the companies mentioned in this report.
i
https://www.salesforce.com/company/
ii
Salesforce 10K
iii
http://topics.nytimes.com/top/news/business/companie
s/salesforcecom-inc/index.html
iv
Salesforce 10K
v
Salesforce 10K
vi
www.businessinsider.com/infographic-the-state-of-
us-small-business-2013-9
vii
Salesforce 10K
viii
cioinsight.com, bsa.org
ix
Salesforce 10K
x
crmsearch.com/crm-market-share.php
xi
http://fortune.com/worlds-most-admired-
companies/abb-100000/
xii
Salesforce 10K
xiii
http://content.trust.salesforce.com/trust/en/learn/bestp
ractices/
Xv
IBISworldreportscrm
xvi
Clients1.ibisworld.com
xvii
Netadvantage.standardandpoors.com/software
xviii
FactSet
xiv https://www.crunchbase.com/organization/salesforce/acquisitions
xx https://ycharts.com/indicators/sandp_500_total_return_annual
xxi
danodaran.com